フィールドサイエンス
Journal of Field Science
ISSN 1347-3948
Journal of Field Science
No. 10 May, 2012
FIELD SCIENCE CENTER, TOKYO UNIVERSITY OF AGRICULTURE AND TECHNOLOGY
Fuchu, Tokyo 183-8509, Japan
Originals
1 Effects of timings of nitrogen application and irrigation on corn growth / M . Zarif SHARIFI, S . MATSUMURA
9 Long term field investigation about nature environment and quality of wireless transmission in FM Tamakyuryo / K. OHSHIMA, H. HARA, Y. HAGIWARAand M. TERADA
Research materials
17 New research results for blueberries / T. BAN
23 Body size of raccoon dogs and Japanese badgers trapped in the Field MuseumTamakyuryo, Tokyo University of Agriculture and Technology / Y. KURAMOTO, Y. KANEKO
27 Development for the identification of tree species using hyperspectral image analysis in FM Tamakyuro / T. GOMI, F. ANDO, F. FUJIMORI, Y. TAKARAand N. NORO
33 Spatial variability of soil properties within the JaLTER Plot, FM Tamakyuryo / S. D. KIMURA, F. (Mo) KISHIMOTO, N. OURA, S. SEKIKAWA, S. YONEMURA, S. SUDO, A. HAYAKAWA, K. MINAMIKAWA, Y. TAKADA
and H. HARA
フィールドサイエンス
ISSN 1347-3948
No. 10 2012
東 京 農 工 大 学 農 学 部 附 属 広 域 都 市 圏 フィールドサイエンス教育研究センター
J.FIELDSCIENCENo.102012東京農工大学農学部附属FSセンター
平成24年5月
07*フィールドサイエンスVol.10/表紙Vol.10/背幅3ミリ 2019.06.06 13.00.37 Page 1
フィールドサイエンス 第10号
目 次
原 著
1 トウモロコシの生育に及ぼす窒素施用時期と潅水時期の影響/モハマド ザリフ シャリフィ・松村 昭治
9 FM 多摩丘陵における設置環境と無線通信品質の相関調査/大島浩太・原 宏・萩原洋一・寺田 松昭
研究資料
17 ブルーベリーに関する最近の研究成果/伴 琢也
23 東京農工大学フィールドミュージアム多摩丘陵で捕獲されたホンドタヌキとニホンアナグマの体サ イズ/蔵本洋介・金子弥生
27 FM 多摩丘陵におけるハイパースペクトル画像解析による樹種特定手法の開発/五味高志・安藤 史識・藤森雄大・高良洋平・野呂直樹
33 FM 多摩丘陵 JaLTER プロットにおける土壌特性の空間変動/木村園子ドロテア・岸本(莫)文 紅・大浦典子・関川清広・米村正一郎・須藤重人・早川 敦・南川和則・高田裕介・原 宏
フィールドサイエンス編集委員会
編集委員長 島田 順 東京農工大学農学部 FS センター長,教授
編 集 委 員 渡辺 直明 FS センター助教
鈴木 馨 FS センター准教授
松村 昭治 FS センター准教授
伴 琢也 FS センター准教授
鈴木 創三 生物生産学科教授
三浦 豊 応用生物科学科准教授
伊豆田 猛 環境資源科学科教授
澁澤 栄 地域生態システム学科教授
田中 綾 共同獣医学科教授
事 務 局 五十嵐 明 府中地区総務事務長補佐(FS 担当)
Editorial Committee of Journal of Field Science
Editor-in-Chief
Jun SHIMADA Director of Field Science Center, Professor of Tokyo University of Agriculture and Technology
Editorial Board
Naoaki WATANABE Assistant Professor of Field Science Center Kaoru SUZUKI Associate Professor of Field Science Center Shoji MATSUMURA Associate Professor of Field Science Center Takuya BAN Associate Professor of Field Science Center Sohzoh SUZUKI Professor, Dept. of Applied Biological Science
Yutaka MIURA Associate Professor, Dept. of Applied Biological Science
Takeshi IZUTA Professor, Dept. of Environmental and Natural Resources Science Sakae SHIBUSAWA Professor, Dept. of Ecological Science
Aya TANAKA Associate Professor, Dept. of Veterinary Medicine
Management Office
Akira IGARASHI Chief of Field Science Center Office
平成24年5月25日 印刷 平成24年5月31日 発行
発 行 所 東京農工大学農学部附属 FS センター
183―8509 府中市幸町3―5―8 042―367―5799
印 刷 所 電 算 印 刷 株 式 会 社
390―0821 松本市筑摩1―11―30 0263―25―4329
07*フィールドサイエンスVol.10/表紙Vol.10/背幅3ミリ 2019.06.06 13.00.37 Page 2
蔵本ほか図4.捕獲されたタヌキ(No.2)(p.25) 五味ほか図1.50mタワーからのデジタルカメラ画像(p.29)
蔵本ほか図2.捕獲罠に入ろうとするタヌキ(p.24) 蔵本ほか図3.捕獲されたタヌキ(No.1)(p.25)
木村ほかFig.2GeneralcharacteristicsoftheJaLTERplot.(p.35) 木村ほかFig.1LocationofJaLTERPlotintheFMTamakyuryo.(p.34)
木村ほかFig.4Samplingmembersin(a)Julyand(b)December,andthemeasurementscenein(c)Julyand(d)December(p.38)
木村ほかFig.5Relationofa)CO2,b)CH4andc)N2OfluxesinJulyand Decemberaccordingtodifferenttopography.(p.43) 木村ほかFig.3Chamberusedinthisstudy.(p.35)
原 著
トウモロコシの生育に及ぼす窒素施用時期と潅水時期の影響
モハマド ザリフ シャリフィ*1・松村 昭治*2
Effects of timings of nitrogen application and irrigation on corn growth
Mohammad Zarif SHARIFI*1,Shoji MATSUMURA*2
A pot experiment was carried out in a plastic house at the FS center, Faculty of Agriculture, Tokyo Uni- versity of Agriculture and Technology in 2006, in order to examine the effects of timings of nitrogen applica- tion and irrigation on growth and yield of corn. Volcanic ash soil,Silic Andisols,from the upland field of Fuchu farm was packed into a/2000 sized Wagner’s pots. Before planting, 25 kg N ha-1of ammonium sulfate, 150 kg P2O5ha-1of fused phosphate and 150 kg K2O ha-1of potassium sulfate were mixed with the soil in every pot.
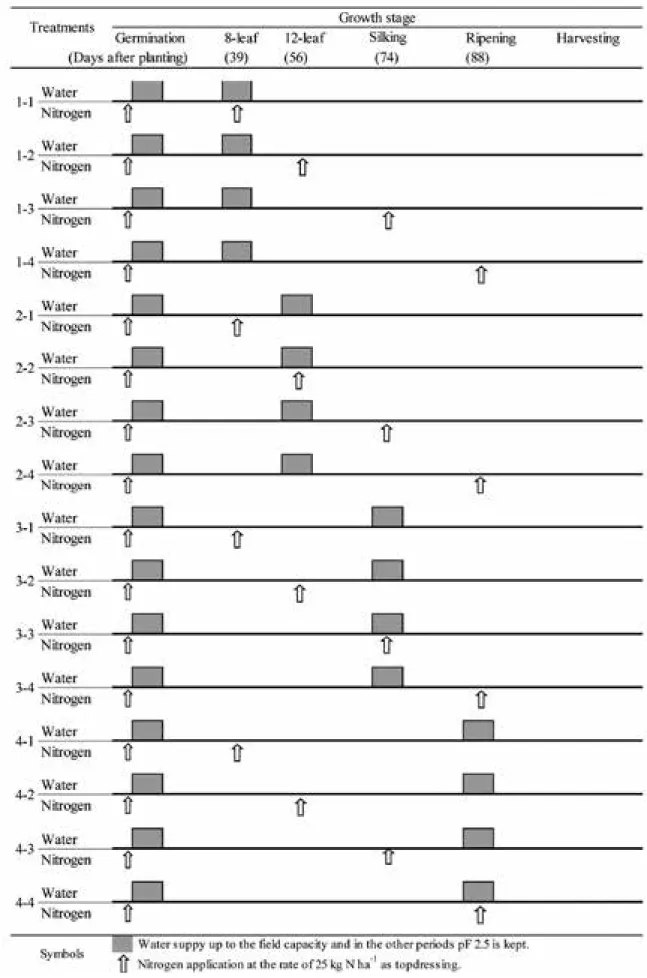
Corn seeds (var. Golddent KD772 SP) were planted in every pot on June 6, and the combination effects of timings of nitrogen topdressing and intensive irrigation (4 timings of nitrogen supply × 4 timings of inten- sive irrigation) on the corn growth were examined. Four timings included 8 leaf stage, 12 leaf stage, silking stage, ripening stage of corn. The corn plant height was not influenced by the nitrogen topdressing time when sufficient water was supplied at the 8 leaf stage, but when the timing of irrigation was later than 12 leaf stage it was increased by early dressing time of nitrogen. The leaf color was almost the same up to 12 leaf stage, but in the silking stage the green color was increased by nitrogen topdressing. The greatest aboveground biomass and the grain yield were achieved by the combination of nitrogen supply at 12-leaf stage and irrigation at silking stage. These results showed that growth and grain yield of corn were effec- tively improved by the combination of nitrogen topdressing at the 12 leaf stage and sufficient irrigation at silking stage. This finding seems to be very useful for regions where water resources and nitrogen fertilizer are limited to use for agricultural production.
Key words: corn grain yield, intensive irrigation at different growth stage, nitrogen topdressing at different growth stage, pot experiment, nitrogen use efficiency
トウモロコシの生育に及ぼす窒素施用時期と潅水時期の影響を明らかにする目的で,2006年夏に東京農工
大学農学部 FS センタ-のビニールハウス内でポット試験を行った。1/2000アールのワグナーポットに黒
ボク土壌を充填し,全ポットに窒素25kg N ha-1,リン酸150kg P2O5ha-1,カリ150kg K2O ha-1をそれぞれ 硫安,熔リン,硫酸カリで施用し,土壌に混合した。こうして準備した全ポットに,6月6日にトウモロコ シ(品種:Golddent KD772 SP)を播種し,トウモロコシの4つの生育時期(8葉期,12葉期,絹糸抽出期,
登熟期)のいずれかに窒素追肥と潅水を行った。8葉期に十分に潅水した場合はトウモロコシの草高が窒素 追肥時期により影響されることはなかったが,12葉期または絹糸抽出期の潅水では早い時期に窒素を追肥し た場合に草高が高くなった。葉色は12葉期までは窒素追肥時期の影響は認められなかったが,絹糸抽出期に は窒素追肥により緑色が濃くなる傾向がみられた。地上部乾物重は12葉期に窒素を追肥し,絹糸抽出期に十 分な潅水を行った場合に最大になった。子実収量は絹糸抽出期以後に潅水した場合に高くなった。以上の結 果から,トウモロコシの生育および子実収量は12葉期の窒素追肥と絹糸抽出期の十分な潅水の組み合わせに
*1 東京農工大学大学院農学研究科 現在:アフガニスタン国カブール大学 Graduate School of Agricultural Science, Tokyo University of Agriculture and Technology. Present affiliation : Kabul University, Afghanistan
*2 東京農工大学農学部 Faculty of Agriculture, Tokyo University of Agriculture and Technology
フィールドサイエンス(J. Field Science)10:1―7,2012 1
1 Introduction
It is important to raise crop productivity and the production in order to meet the increasing food re- quirement by the increasing population all over the world. Since almost all suitable land for food produc- tion has already been developed , the increase of crop production must be by the increase per unit area (Yildirim and Guvence 2005). Except for ge- netic development , the high crop productivity is achieved mainly by supplying an adequate amount of water and nutrients, especially nitrogen, to crops (Fageriaet al.2003).
In semi-arid countries like Afghanistan, the most important issue for crop production is the limited supply of water (Blumenthalet al.2003). Nitrogen is also the most important nutrient to affect crop yield. Grain yield is a result of photosynthetic activ- ity through the growing period of plants and the photosynthetic activity depends on chlorophyll con- tent in leaves. The chlorophyll content is affected by nitrogen status in plant leaves and a supply of nitrogen to crop is inevitable. In many developing countries in semi-arid regions, both water for agri- cultural use and nitrogen fertilizer are limited because of climatic and economic reasons (Sadras 2004). Therefore, the most effective ways to use these limited resources to crops should be devel- oped.
Corn grain is one of the important staple foods in many semi-arid countries. It is reported that corn plants demand 270―370 grams of water to produce one gram of the dry matter. When 490 mm of water was irrigated through the growing period, 6 tons ha-1of corn grain yield was produced (Kirda et al.
1999). They also showed that there must be a most effective timing of irrigation to produce corn grain yield, as well as the best timing of nitrogen top- dressing to paddy rice plants. Therefore, if the most effective timings of irrigation and nitrogen top-
dressing are clarified, corn grain yield will be im- proved even under the limited use of the two resources.
The objective of this study is to find the best tim- ings of irrigation and nitrogen topdressing to pro- duce reasonable growth and yield of corn.
2 Materials and Methods
A pot experiment was carried out in a plastic greenhouse at the Field Science Center of Tokyo University of Agriculture and Technology, in 2006 (Fig. 1). Ten kg of volcanic ash soil, Silic Andisols, was collected from the upland field of Fuchu farm, sieved through 10mm, and then packed into 1/2000- are sized Wagner’s pots . Two-factor experiment was established as shown in Fig. 2, including 4 tim- ings of nitrogen topdressing and 4 timings of inten- sive irrigation with 3 replicates . Four timings included 8-leaf, 12-leaf, silking, and ripening stage.
After packing the soil, 25 kg N ha-1 of ammonium sulfate, 150 kg P2O5ha-1of fused phosphate and 150 kg K2O ha-1of potassium sulfate were mixed with the soil in every pot as a basal dressing on June, 6.
Twenty five kg N ha-1 of ammonium sulfate was applied as the treatment of nitrogen topdressing at one of the 4 stages, 8-leaf, 12-leaf, silking and ripen- ing stage. The treatment of intensive irrigation was conducted to regulate the soil moisture condition at よって最も効果的に達成されることが明らかになった。この結果は水資源に乏しく窒素肥料の使用量も十分 でない地域にとってきわめて有用であると考えられる。
キーワード:トウモロコシ子実収量,生育時期別潅水,生育時期別窒素追肥,ポット試験,窒素利用効率
Fig. 1. Pot experiment in a plastic greenhouse フィールドサイエンス 10号
2
Fig. 2. Experimental design
Timings of N application and irrigation to corn growth(SHARIFI・MATSUMURA) 3
pF 1.5 during a week of one of the 4 stages, while maintained at pF 2.5 during the other periods, by using the soil moisture meter with a ceramic sensor (Fujiwara, SPAD PF-33). The temperature of pot- soil and air in the plastic greenhouse was continu- ously recorded with thermo recorders (Espec, RT- 11 ) during the hottest season , from August 5 to August 25.
Four corn seeds ( var . Golddent KD772 SP , Kaneko co. Ltd) were planted by hand in every pot at a depth of 2-3 cm, and then two liters of water were applied to each pot on June 9. After emerged, the three extra seedlings were removed on June 29, remaining only one plant in each pot. In order to control corn borer and other corn insects’ infesta- tion,“Afirm”(insecticide) was sprayed in three dif- ferent times during the growth period.
For the irrigation treatment, 12 pots from the 48 pots were supplied with efficient water to keep soil moisture at pF 1.5 for one week, and then with a lit- tle water at pF 2.5 during the other periods. The deionized water was used for the irrigation . The amount of water supplied was varied from 0.2 to 2.5 L pot-1, depending on the weather condition. The nitrogen treatment was conducted at one of the stages of 8-leaf, 12-leaf, silking, and ripening, inde- pendently from the irrigation treatment. Soil mois- ture measurement started on June 22 and was done twice a week in the morning hours until July 12.
The required water supply was determined for each pot from the soil moisture data.
The number of leaves was counted in every two weeks . The plant height was measured using a regular ruler from the soil surface up to the end of plant growth point from July 7 to the end of the silk- ing stage, when the plant height reached its final value . The leaf color was measured every week with the chlorophyll meter (Konica Minolta, SPAD- 502) by means of Argentaet al. (2004) from July 7 until the harvesting time . The thickness of corn stems was also measured at the harvesting time on September 9. Measured position of the thickness was 30 cm above the soil surface using a slide cali- per (1/10 mm measuring accuracy).
After the harvest , plants were divided into
smaller organs and their fresh weight was meas- ured. The dry weights were measured after dried in an oven at 70°C for 2 days. All grains were de- tached from corn cobs by hand and the total num- ber and the dry weight of the grains were meas- ured. Statistical analysis was carried out by stan- dard ANOVA procedures using Excel Statistics (Yanai, 2000).
3 Results and Discussion 3.1 Environmental conditions
Changes of air and soil temperature in the green- house during the growth period of corn are shown in Fig. 3. Air temperature changed drastically within the range of 25 to 45°C and the mean daily tem- perature was around 32°C, while the pot-soil tem- perature ranged from 27 to 40°C and the mean was the same as the air temperature.
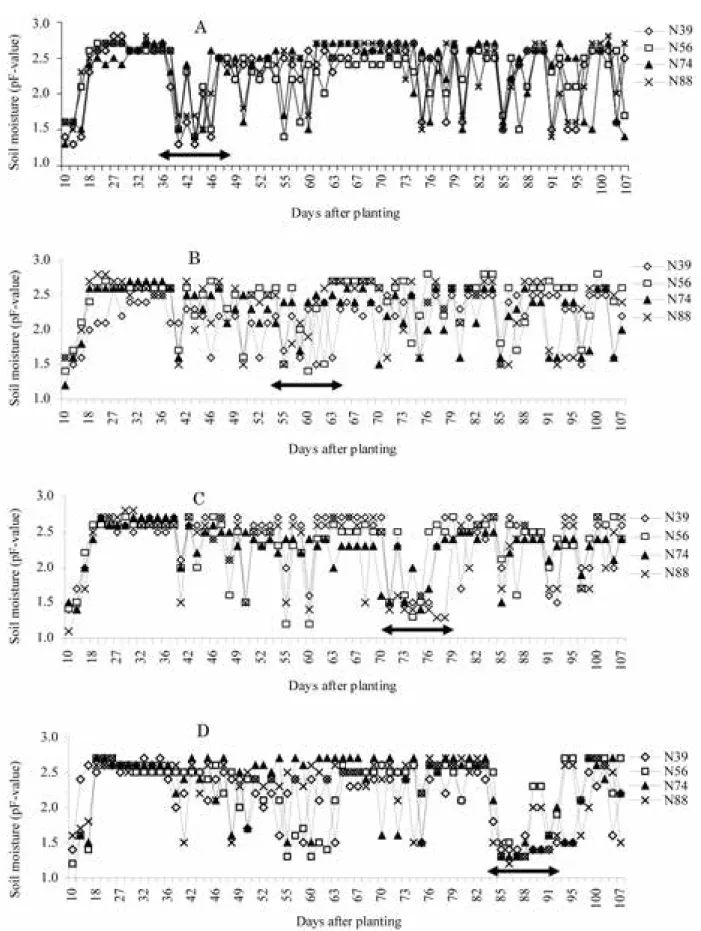
Soil moisture condition was regulated as ar- ranged by the irrigation treatment (Fig. 2). When the moisture content was treated to pF 1.5 for each one week of 8-leaf stage and the ripening stage, it was suitably regulated (Fig. 4A, 4D). However, for the 12-leaf and silking stages, the treatment could not keep the soil moisture at pF 1.5 due to too hot environment in midsummer and it had changed in a rather wide range (Fig. 4B, 4C).
3.2 Plant height
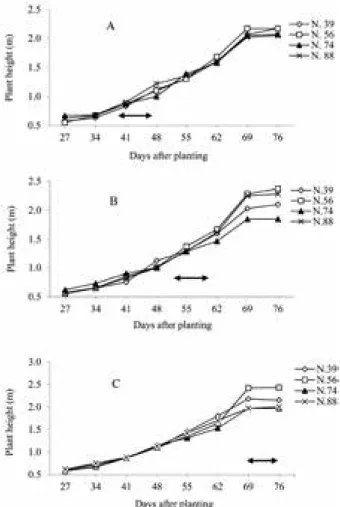
It was observed that both treatments of nitrogen and irrigation after the silking stage (about 70DAP) had not significant effect on plant height, because it’s elongation was already completed; actually , corn plant height reached maximum at silking stage. The height was affected by a combination of the timings of nitrogen supply and irrigation (Fig. 5).
Fig. 3. Temperatures in August in the greenhouse.
フィールドサイエンス 10号 4
Fig. 4. Changes of soil moisture condition affected by different period of sufficient irrigation. A, irrigation at 8 leaf- stage ; B, 12 leaf-stage ; C, silking stage ; D, ripening stage. N 39―88 means the date nitrogen was top-dressed (days after planting).
Timings of N application and irrigation to corn growth(SHARIFI・MATSUMURA) 5
When irrigation was conducted at 8 leaf stage, the timing of nitrogen supply did not influence the plant height (Fig. 5A). It seemed that nitrogen applied at 39 DAP was already run out before rapid growing stages and nitrogen applied later was not available because of low soil moisture condition. Nitrogen ap- plication at 74 and 88 DAP seemed too late to elon- gate (Fig. 5B). However, when water was supplied at the 12 leaf- (Fig. 5B) and the silking stage (Fig.
5C), the plant height was increased by earlier appli- cation of nitrogen (N-39 and N-56). This means that applied nitrogen is unavailable under the low soil moisture condition, pF 2.5, though it was reported that corn is relatively insensitive to water demand during vegetative growth stages because the de- mand is relatively low (Payeroet al.2006).
It seems that sufficient condition of soil moisture
during the 12-leaf and silking stages are predomi- nant factor for corn growth rather than nitrogen application.
3.3 Leaf color
The effect of the timing of nitrogen dressing on leaf color of corn is shown in Fig . 6. The values show the averages among all irrigation treatments.
During the 12-leaf stage, there was no significant change except for the rapid increase in the pots of early nitrogen supply (N-39), suggesting that previ- ously applied nitrogen was remained and became available by water supply. Totally, leaf color was not affected greatly by the nitrogen treatment, and it in all treatments decreased rapidly after 88 DAP.
3.4 Above ground biomass(AGB)
Fig. 7 shows the effects of irrigation and nitrogen treatment on AGB of corn. As mentioned before, the biomass production of corn is one of the impor- tant objectives of this research . AGB was not greatly affected by the timing of nitrogen applica- tion, but the greatest increase was achieved by the irrigation at silking stage (74 DAP) when nitrogen was added at 12-leaf stage (N 56), although signifi- cant difference was not detected (P>0.05). It seems that the combination of irrigation at silking stage and nitrogen application at 12-leaf stage effectively stimulates the corn growth.
3.5 Grain yield
In this experiment , the ripened grain number was too little. This might be due to the infertility caused by too high temperature in greenhouse as shown in Fig. 3. The greenhouse temperature was not suitable for normal pollination of corn. However, Fig. 6. Effect of nitrogen application on leaf color of
uppermost unfolded leaves
Fig. 5. Effect of nitrogen application timing on plant height when soil moisture was kept at pF 1.5 at different growth stage, 8 leaf- (A), 12 leaf- (B) or the silking (C) stage. ; Irrigation period. N 39―
88 ; Dates of nitrogen application ( days after planting).
フィールドサイエンス 10号 6
the highest grain yield was observed in the treat- ment of irrigation at silking stage combined with ni- trogen application at 12-leaf stage (Fig. 8). This com- bination effect was similar to that for AGB (Fig. 7).
4 Conclusion
Corn plant height was not influenced by the tim- ing of N dressing when soil moisture was kept at pF 1.5 during the period of 8-leaf stage, but during the 12-leaf and silking stages, the plant height differed based on their nitrogen condition. It seems that suf- ficient condition of soil moisture during these stages is a predominant factor for the corn growth rather than nitrogen application. The greatest AGB and grain yield were achieved by the combination of ir- rigation at silking stage and nitrogen supply at 12- leaf stage. However, since the grain yield was not in normal level because of inactive pollination in the greenhouse in midsummer, the further verification is needed.
It was clarified that there are the best timings of
irrigation and nitrogen application for the better biomass yield of corn. It seems reasonable to use the limited resources, water and nitrogen, based on plant physiological stages related to the yield com- ponents. The optimum combination of these factors is of a special great importance in arid and semi-arid countries like Afghanistan. However, since in this experiment the soil moisture condition during the 12 - leaf and silking stages could not be precisely regulated because of too hot temperature, the more prudent researches will be needed.
5 References
Argenta, G., da Silva P. R. F. and Sangoi. L. (2004) Leaf relative chlorophyll content as an indica- tor parameter to predicate Nitrogen fertiliza- tion in maize. Ciencia Rural 34 : 1379―1387.
Blumenthal, J. M., Lyon D. J. and Stroup. W.W.
(2003) Optimum plant population and nitrogen fertilizer for dryland corn in Western Ne- braska. Agronomy Journal 95 : 876―883.
Fageria , V . , Baligar C . , and Jones . C . A . ( 2003 ) Growth and Mineral Nutrition of Field Crops, Field crops and Mineral nutrition. Second Edi- tion, New York.
Kirda, P. M., Hera C., and Nielsen D. R.. (1999) Crop Yield Response to Deficit Irrigation, the Neth- erland.
Payero, J. O., Melvine S. R., Irmak S., and Tarkalson D . ( 2006 ) Yield response of corn to deficit irrigation in a semiarid climate . Agricultural Water Management 84 : 101―112.
Sadras, V. O. (2004) Yield and water-use efficiency of water-and nitrogen-stressed wheat crops increase with degree of co-limitation. European Journal of Agronomy 21 : 455―464.
Yanai, H. (2000) Statistics for the excel with“Stat- cel”. OMS Publishing Ltd., Saitama.
Yildirim, E. and Guvence I . ( 2005 ) Intercropping based on cauliflower : more productive, profit- able and highly sustainable. European Journal of Agronomy 22 : 11―18.
Fig. 7. Effects of irrigation and nitrogen treatment on corn biomass. Irrigation was carried out at 8-leaf, 12-leaf or silking stage. Bars show standard de- viation
Fig. 8. Effects of irrigation and nitrogentreatment on grain yield. Irrigation was carried out at 8-leaf, 12 - leaf or silking stage . Bars show standard deviation.
Timings of N application and irrigation to corn growth(SHARIFI・MATSUMURA) 7
原 著
FM 多摩丘陵における設置環境と無線通信品質の相関調査
大島 浩太*1・原 宏*2・萩原 洋一*3・寺田 松昭*1
Long term field investigation about nature environment and quality of wireless transmission in FM Tamakyuryo
Kohta OHSHIMA*1, Hiroshi HARA*2, Yoichi HAGIWARA*3and Matsuaki TERADA*1
1.はじめに
無線センサネットワークは、無線通信機能を備え た膨大な数の小型機器が、相互に協調しながら周囲 の環境情報を取得するという Smart Dust[1]の提唱
から始まり、バッテリ駆動の端末の利用を想定して いることから、電力消費量の低減に主眼を置いた 様々な通信方式や内部処理方式などが提案されてき た。しかし、膨大な数の小型端末の実環境への配置 は、設置場所の準備の難しさや高コストであること One of the problem affecting wireless sensor networks in natural environment is the attenuation of radio waves due to high humidity and weather changes. This paper discusses the transmission performance in wireless sensor networks in terms of the relationships between wireless transmission performance, distance, and environmental conditions observed in field experiments. Measurements were made with sensor nodes equipped with a weather-sensing device at an experimental field of the university, called the Field Museum (FM) Tamakyuryo in Tokyo. The results confirmed that the humidity change affects performance of wire- less transmission and the the distance between sensor nodes and the season of measurement affect the throughput and stability of data transmission.
Key words: wireless sensor network, transmission quality
本論文では、シミュレーションと実環境の差異の明確化と、農学研究での実利用を目標とした無線センサ ネットワークシステム実現に向けた、東京農工大学 FM 多摩丘陵で実施中の通信効率の変動調査実験につ いて述べる。実験は、2.4GHz 帯電波で問題となる無線電波の水分吸収が通信効率に与える影響と、端末の 距離別の通信効率の長期的変動の2種類を実施した。前者から、実環境における湿度変化と通信効率間の相 関関係を示し、湿度変化と変化の一要因である気象の予測を用いた通信制御方式実現の可能性を見出した。
後者から、通信効率の安定・不安定時期の存在を確認し、また実験期間中に発生した台風による通信効率の 変化から、季節による通信安定性を考慮した通信制御方式と、通信効率の異常な変化を利用した計測データ の信頼性確認技術実現の可能性を見出した。今後は、実験のより長期的な実施と、今回得られた成果を用い た応用技術の開発を予定している。
キーワード:無線センサネットワーク,無線通信品質,通信環境計測
*1 東京農工大学大学院工学研究院情報工学専攻 〒184―8588 東京都小金井市中町2―24―16:Institute of Engineer- ing, Tokyo University of Agriculture and Technology, 2―24―16 Nakacho, Koganei-shi Tokyo 184-8588, Japan
*2 東京農工大学農学部附属広域都市圏フィールドサイエンス教育研究センター 〒183―8509 東京都府中市幸町3―
5―8:Field Science Center, Tokyo University of Agriculture and Technology, Saiwaicho, Fuchu-Shi, Tokyo 183―
8509, Japan
*3 東京農工大学総合情報メディアセンター 〒184-8588 東京都小金井市中町2―24―16:Information Media Cen- ter, Tokyo University of Agriculture and Technology, 2―24―16 Nakacho, Koganei-shi Tokyo 184―8588, Japan
フィールドサイエンス(J. Field Science)10:9―15,2012 9
から容易ではない。そのため、シミュレーションを 用いた有効性の検証に留まっている研究が大半を占 めている。シミュレーションは低コストで提案の有 効性を示すには有効な手段である。しかし、無線通 信は周囲の環境変化が通信品質に大きく影響を与え ることが知られており、シミュレーションでは、実 環境に適用した際の性能に懐疑的な面もある。さら に、センサネットワーク分野は、これまで具体的な ニーズを想定せず研究開発が進められており、提案 されている技術の数に比べて実用化の例が非常に少 ないといった課題を有している。
本論文では、シミュレーションと実環境の差異の 明確化と、農学研究での実利用を目標とした無線セ ンサネットワークシステム実現に向けた東京農工大 学 FM 多摩丘陵で実施中の通信効率の変動調査実 験について述べる。無線センサネットワークで一般 的に利用される、免許を必要としない2.4GHz 帯の 電波は、電波の伝搬路中の水分により減衰すること が広く知られている。本研究では、屋外に設置した 無線通信機器について、周囲の水分量と通信効率の 変化の関係および距離と通信効率の関係に注目した 通信品質調査を実施した。2.4GHz 帯電波は、水分 吸収の影響を強く受けるが、その周波数特性から空 気中の水蒸気量や降雨そのものの影響は受けにくい 周波数帯である。しかし、屋外における予備実験の 結果から、異なる天候時において通信帯域の大幅な 変動が認められた。そこで、FM 多摩丘陵に耐環境 性を確保した端末とセンサデバイスを設置し、定常 的に通信品質(無線電波強度、通信帯域)と環境情 報(温湿度・気圧)の取得・蓄積を実施することに した。電波干渉源である無線 LAN アクセスポイン トが多数設置されている都市部と異なり、これらの 存在しない FM 多摩丘陵は、自然環境変化に起因 する通信品質の調査に適している。
関連研究および研究事例について述べる。無線セ ンサネットワークを用いた環境モニタリング事例 に、新宿御苑と大学キャンパスによる実験[2]、火 山[3]、氷河[4]、永久凍土[5]、野生動物[6]などが ある。これらは、いずれも対象環境において確実な 計測と通信できることが優先され、これまでに無線 センサネットワーク分野で提案されてきた通信制御 方式は採用されていない。環境モニタリング時の通 信効率に着目した研究事例に、工場に設置した無線 センサノード間の RSSI と温度変化の関係を1年間 調査した研究[7]や、無線伝搬モデルを実機実装
し、1日程度の短期的な温・湿度と RSSI の関係調 査の結果から、センサノードの配置手法を提案して いるものがある[8]。前者は長期的な実験ではある が、2.4GHz 帯無線電波の他の減衰要因である湿度 を考慮しておらず、後者は計測期間が短いという課 題がある。
本研究は、自然環境との親和性を備え、実用性の 高い通信制御方式の開発を目的としている。
以下、実験の概要および結果について述べる。
2.計測実験概要
FM 多摩丘陵の管理棟前広場に小型ノートパソコ ンを用いて開発した無線センサノード2~3台を設 置し、通信品質、環境情報を距離別に計測する実験 を実施した。2010年5月に2台の無線センサノード による通信効率と湿度の関係調査および自然環境に 設置した電子機器の運用状況の観察[9]を行い、
2011年5月からは前年度に得られた知見を基に改良 した3台の無線センサノードによる、距離別の通信 品質調査[10]を継続して実施している。図1に設置 機材と場所の外観を示 す。Sensor Box#1は FM 多摩丘陵に既設のポールにプラスチック製防雨ボッ クス(未来工業製・ウォルボックス)の中に無線セ ン サ ノ ー ド を 格 納 し て い る。Sensor Box#2,3 は、移動型スタンドに防雨ボックスを設置し、同様 に無線センサノードを格納している。長期的な計測 実験を実施するため、それぞれの無線センサノード は電源に直接つなぎ、電力供給に関する問題は生じ ないようにしている。無線センサノード間は15m で設置した。これは、都市部において経験的に良好 な無線通信が行える距離を考慮して決定した。
図1 設置機材の概要 フィールドサイエンス 10号
10
3.通信効率と湿度変化の関係調査 3.1 設置システム概要
通信効率(電波強度と通信帯域)と湿度変化の関 係調査を目的とし、図2および表1に示す機材を FM 多摩丘陵に設置した。防雨ボックス内に機材固 定用の金具や紐などを取り付け、ネットブックおよ び AC アダプターを格納した。自然環境計測用のセ ンサデバイスとして、USBWeather v2(Spark Fun 社)を利用した。このデバイスの仕様を表2に示 す。SCP1000や SHT15といった広く利用されてい る素子が用いられており、USB インタフェース経 由で端末に計測情報が1秒間隔で送信される。この
実験では、ネットブックに備わった無線通信デバイ ス周辺の環境情報計測の必要性から、センサデバイ スは防雨ボックス内に格納した。
3.2 実験概要
3.1節で述べた機材を、図1の Sensor Box#1,
2の場所に設置し、2010年5月19~27日の期間に通 信効率および環境情報を計測した。前者は10秒間隔 で、後者は1秒間隔で計測している。前者の計測用 に、無線電波強度は iwconfig(Wireless Tools ver.
29)を、通信帯域は IPerf(ver.2.0.4)を用いた。
期間中の降水量分布を図3に示す。梅雨の時期であ るため、全体的に雨の期間が多い。特に、5月23日 および24日は強めの雨であった。
3.3 実験結果と考察
図4に Sensor Box#1,2間の通信帯域の変化を、
湿度の変化を図5に示す。通信帯域は、最少3.91 Mbps,最大17Mbps,平均11.63Mbps,標準偏差 1.71Mbps という結果になった。最大と最少で約 4倍異なり、期間中の変動も大きいことが読み取れ る。
表1 設置機材の仕様
項目 仕様
端末機種 IdeaPad S10-2
OS Ubuntu9.04
CPU Intel Atom1.6GHz
RAM 1024MB
Wi-Fi 802.11b/g(ad-hoc 接続)
Wireless Controller Broadcom BCM4315
Encryption 無し
表2 センサデバイスの仕様
機種 計測対象 性能
SCP1000 気圧 温度
+/-150Pascal
+/-0.3℃
SHT15 湿度 +/-2%
図2 実験機材(通信効率と湿度変化の関係調査)
図3 2010/5/19~27の日降水量変化
(気象庁・東京都八王子市の気象データ)
図4 Sensor Box#1,2間の通信帯域
FM 多摩丘陵における設置環境と無線通信品質の相関調査(大島ら) 11
次に、2.4GHz 帯の無線電波は水分により減衰す ることから、通信帯域と湿度の相関係数を求めたと こ ろ、-0.299と い う 結 果 を 得 た。サ ン プ ル 数 30,000以上により求めた結果であり、通信帯域と湿
度変化には負の相関があると考えられる。
このような設置環境の時間経過による変化は、
Log-distance path loss model に代表される無線電波 の伝搬モデルでは考慮されていないため、本研究の 成果を応用することで、設置環境の状態変化が通信 効率に与える影響を考慮した無線電波の伝搬モデル の構築が可能になると考えられる。また、気圧の変 化から数時間後の天候が予測できるため、湿度の変 化も推測することができる。そのため、気圧センサ の計測値から通信環境の良い時間帯を予測すること で、計測データの任意機器への効率的な伝送方式の 開発も期待できる。通信効率の悪い状況では、通信 そのものの失敗や、単位時間あたりの送信できる データ量に制限が生じ、結果として電力消費量の観 点からは非効率的な通信になる。これに対して、通 信効率の良い状況をデータ送信に利用することで無 駄な電力消費を抑えた通信が可能となる。環境情報 計測用のセンサデバイスが必須になるため、一般的 な無線通信方式への適用には制限が生じるが、環境 情報の計測を目的とした無線センサネットワークに おいては有効な手段であると考えられる。
4.距離別通信効率の長期的変動調査 4.1 設置システム概要
距離別の通信効率(電波強度と通信帯域)と環境 情報の長期的計測を目的とし、図6に示す機材を FM 多摩丘陵に設置した。防雨ボックス内のネット ブックおよびセンサデバイスは3章で述べた仕様
(表1,2)と同じである。これに加えて、防雨ボック
ス内は空気の流れが無いため、正確な環境情報を取 得するためにセンサデバイスを防雨ボックス外に取 り付けた。樹脂製の白い鉢皿を、空気の流れを妨げ ずかつ雨が入り込まない程度の間隔を空けて連結し た容器の中にセンサデバイスを格納している。
4.2 実験概要
4.1節で述べた機材を、図1の Sensor Box#1,
2,3の場所に設置し、2011年5月24から2011年11 月現在まで、距離別の通信効率および環境情報の計 測を続けている。前者は10秒間隔で、後者は1秒間 隔で計測している。前者の計測用に、無線電波強度 は iwconfig(Wireless Tools ver.29)を、通信帯域 は IPerf(ver.2.0. 4)を用いた。期間中の降水量分 布(時間平均)を図7に示す。実験期間は、梅雨、
夏、秋にまたがり、また9月21日には東京地方に強 い勢力の台風が上陸しており、環境条件が様々に変 化している。
図5湿度の変化
図6 実験機材(距離別通信効率の変動調査)
図7 2011/5/24~11/04の1時間降水量変化
(気象庁・東京都八王子市の気象データ)
フィールドサイエンス 10号 12
4.3 実験結果と考察
図8-10に、それぞれの無線センサノード間で計 測した通信帯域における1時間毎の平均値の変化を 示 す。Sensor Box#1,2お よ び#2,3間 は そ れ ぞれ15m、#1,3間は30m 離れている。これらの グラフから分かる興味深い事項として、15m 間隔 の2組のノード間については、梅雨の時期の通信帯 域は不安定であり、それ以外は安定しているといっ た類似の傾向になっている。しかし、設置距離や設 置環境の条件は類似しているにも関わらず、通信帯 域の最大値・平均値は異なる結果を示している。30 m 間隔のノード間は、梅雨の時期は15m の2組同 様に不安定であり、また期間全体を通じても不安定 になっていた。センサノードの設置環境は、それぞ れのセンサノード間の見通し範囲内には障害物は無 いものの、電波の反射面である地面とは十分に離れ ていないため、自由空間ではない。したがって、土 壌水分量変化や植物の生育が無線電波の減衰要因で ある可能性が考えられる。
実験期間中に発生した強い勢力の台風(15号・
2011年9月21日)の通過中に、通信帯域の大幅な下 降が計測された(図9,10)。下降は9月21日17時か ら翌日9時まで続いている。実験環境において、台 風は14~19時頃の勢力が最も強く、通信帯域の下降 期間とは一部重複している。しかし、図8では台風 の通過期間中の通信帯域の大幅な下降は計測されな かった。この要因の可能性の1つとして、Sensor Box#3の転倒が考えられる。正確な転倒時刻は不 明であるが、9月22日の朝に転倒状態から通常状態 に立て直している。設置している3台の内、転倒し ていたのは#3だけであり、残り2台は通常状態で あった。これは、通信帯域の下降が計測された図 9,10に#3が含まれている点と一致している。そ のため、転倒により水分量の多くなった地面と無線 センサノードが近付き、結果として無線通信品質が 低下した可能性が考えられる。しかし、台風通過前 後の環境条件は、短期的な強い降雨や風速、気圧の 大幅な下降といった、通常時とは異なる気象状況で ある。そのため、無線センサノードの設置高度や周 囲の状況を変化させた場合の通信帯域測定実験を行 い、原因を特定する必要がある。
次に、前述の通信効率計測期間の環境情報(温 度、湿度、気圧)を図11-13にそれぞれ示す。図は、
それぞれ Sensor Box#3が計測した結果である。
計測実験中に、#1のセンサデバイスは9月21日の
台風通過中に故障、#2のセンサデバイスは6月10 日に故障していた。本実験で設置した機材は、セン サデバイスの交換時にネットブックの停止と再起動 を伴う。その期間は無線通信品質の計測も中断され るため、センサデバイスは故障状態のまま、無線通 信品質の計測を継続した。しかし、実際の環境モニ
図8 Sensor Box#1,2間(15m)の通信帯域
(時間平均)
図9 Sensor Box#2,3間(15m)の通信帯域
(時間平均)
図10 Sensor Box#1,3間(30m)の通信帯域
(時間平均)
FM 多摩丘陵における設置環境と無線通信品質の相関調査(大島ら) 13
タリングでは、センサデバイスの故障の検知と速や かな交換が求められる。無線センサノードの通信機 能が正常動作していれば、センサデバイスの故障を 無線センサネットワークの運用者に通知することが 可能である。また、今回は比較的近距離かつ見通し の良い環境に3台の無線センサノードを設置してい
たため、それぞれの地点で計測する温湿度・気圧 は、設置場所による差異の影響は小さいと判断し た。故障前までに計測していた環境情報は、センサ デバイスの機差による誤差は認められるものの、計 測値の変化の傾向はそれぞれの地点で類似してい た。
本実験からは、通信効率の安定・不安定期間を考 慮した通信方式と、通信効率の変化から無線センサ ノードの障害を検知する技術実現の可能性が考えら れる。前者については、通信効率の安定時期と不安 定期間を区別し、それぞれの期間において効率的な データ伝送が可能な通信制御方式を選択的に利用す るなど、設置場所の環境条件の変化と親和性の高い 通信制御方式の実現が期待できる。後者について は、無線センサノードの障害発生を、通常とは異な る通信効率変化から検出する技術の実現が期待でき る。一般的に、環境モニタリングを実施する場合、
環境情報を計測した条件の把握も重要である。計測 条件の変化は、計測値の信頼性に影響を与える恐れ がある。そのため、通信効率の変化から無線センサ ノードの障害を検知できれば、計測値の信頼性の判 断に利用できると考えられる。また、多くの無線セ ンサノードが自律分散的に協調しながら、計測した データを任意ノードに伝達する無線センサネット ワークにおいて、安定した通信トポロジー実現の観 点からも障害の検知は重要事項である。
6.むすび
本論文では、我々がこれまでに FM 多摩丘陵で 実施してきた2種類の実験について、その概要と得 られた結果について述べた。防雨ボックスに格納し たネットブックから構成される無線センサノードを 実際に設置し、通信効率と環境情報の計測実験を 行った。通信効率と湿度変化の関係調査では、湿度 変化と通信効率間の相関関係を明らかにし、成果を 応用した通信制御方式の可能性について言及した。
距離別通信効率の長期的変動調査では、15m 間隔 で設置した3台の無線センサノード間の通信効率を 2011年5月から11月現在まで計測し続けている。長 期的な計測実験を通して、通信効率の安定・不安定 期間の存在と、距離による安定性の違いも確認でき た。本実験の成果を応用した通信制御方式の可能性 についても言及した。
今後は、実験のより長期的な継続や、通信効率変 動の詳細な解析と変動要因の特定、成果を踏まえた 図11 実験期間中の温度変化
(Sensor Box#3)
図12 実験期間中の湿度変化
(Sensor Box#3)
図13 実験期間中の気圧変化
(Sensor Box#3)
フィールドサイエンス 10号 14
通信制御方式への応用を予定している。
謝辞
本研究の一部は,科研費(21700069)の助成を受 けている.
参考文献
1)J. M. Kahn, R. H. Katz, and K. S. J. Pister.“Next Century Challenges: Mobile Networking for
“Smart Dust”.”, ACM MobiCom 1999, pp. 271―
278, 1999.
2)伊藤昌毅,“センサネットワーク技術を活用し た環境モニタリングの実現”,電気学会次世代 産業システム研究会,IIS―10―070,pp.23―28,
2010.
3)G. Werner-Allen, K. Lorincz, M. Welsh, O. Mar- cillo, J. Johnson, M. Ruiz, and J. Lees,“Deploy- ing a wireless sensor network on an active volcano,”IEEE Internet Computing, vol. 10, no.
2, pp. 18―25, 2006.
4)K. Martinez, P. Padhy, A. Elsaify, G. Zou, A. Rid- doch, J. Hart, and H. Ong,“Deploying a sensor network in an extreme environment , " Sensor Networks, Ubiquitous, and Trustworthy Com- puting, International Conference on, vol.1,pp.
186―193, 2006.
5)A. Hasler, I. Talzi, C. Tschudin, and S. Gruber,
“Wireless sensor networks in permafrost re- search-concept, requirements, implementation and challenges,”in Proc. 9th International Con- ference on Permafrost (NICOP 2008), 2008.
6)V. Dyo, S. A. Ellwood, D. W. Macdonald, A.
Markham, C. Mascolo, B. Pasztor, S. Scellato, N.
Trigoni, R. Wohlers, and K. Yousef, “Evolution and sustainability of a wildlife monitoring sen- sor network”, In Proceedings of the 8th ACM Conference on Embedded Networked Sensor Systems (SenSys’10), pp. 127―140, 2010.
7)C. A. Boano, J. Brown, N. Tsiftes, U. Roedig, T.
Voigt, “The Impact of Temperature on Out- door Industrial WSN Applications”, IEEE Trans. Industrial Informatics, pp. 451―459, 2010.
8)Y. Chen and A. Terzis,“On the implications of the lognormal path loss model : an efficient method to deploy and move sensor motes", In Proceedings of the 9th ACM Conference on Embedded Networked Sensor Systems(SenSys
’11), pp. 26―39, 2011.
9)K. Ohshima, H. Hara, Y. Hagiwara, M. Terada,
“Field Experiments for Developing Transmis- sion Control Based on Weather Estimation in an Environmental Wireless Sensor Network”, 2010 Australasian Telecommunication Net- works and Applications Conference (ATNAC 2010), pp. 25―30, 2010.
10)K. Ohshima, H. Hara, Y. Hagiwara, M. Terada,
“Field Investigation of the Radio Transmission Performance and Distance in a Environmental Wireless Sensor Network”, The International Conference on Information Networking (ICOIN 2012), 2012.
FM 多摩丘陵における設置環境と無線通信品質の相関調査(大島ら) 15
研究資料
ブルーベリーに関する最近の研究成果
伴 琢也
New research results for blueberries
Takuya BAN
1.はじめに
我が国におけるブルーベリーに関する本格的な研 究は故・岩垣駿夫先生(元東京農工大学農学部教 授)による「ブルーベリーの生産開発に関する研究」
が始まりである。以来,多くの研究者により本果樹 の成長・成熟生理が解明され,その知見にもとづい た様々な栽培技術が提唱されている。筆者は2000年 1月に島根大学生物資源科学部附属生物資源教育研 究センターにて初めてブルーベリーの成木に出会 い,植田尚文島根大学名誉教授の御指導のもとで本 果樹を対象とした研究を開始した。その後,早10年 が経過したが,その間においてもブルーベリーに関 する多くの知見が報告されている。本稿では我が国 におけるブルーベリーの栽培状況と最近の研究成果 を紹介する。
2.原産国と我が国における栽培の現状 ブルーベリーは米国原産のツツジ科スノキ属の落 葉性低木果樹である(Vander Kloet1988)。本果樹 のうち,経済栽培上,重要な種(species)として ローブッシュ,ハイブッシュおよびラビットアイブ ルーベリーの3種が知られている。ローブッシュブ ルーベリーは,米国北東部とカナダの一部に原生す る Vaccinium angustifolium Ait . および Vaccinium myrtilloidesMich. などに由来し,別名ワイ ル ド ブ ルーベリーと呼ばれる野生種である。収穫された ローブッシュブルーベリー果実のほとんどが各種加 工品の原料として利用されている。ハイブッシュブ ルーベリーは主に米国北東部に原生する Vaccinium corymbosumL. な ど,ま た ラ ビ ッ ト ア イ ブ ル ー ベ リ ー は 米 国 南 東 部 に 原 生 す るVaccinium virgatum
Aiton に由来し,これらには多数の栽培品種が存在 する(Eck1966)。我が国へのブルーベリーの導入 はハイブッシュブルーベリーが1951年,ラビットア イブルーベリーが1962年であり,1981年には栽培面 積が10ha に達した。近年,我が国における栽培面 積は増加しており(図1),農林水産省が実施した 特産果樹生産出荷実績調査によると,2007年におけ る栽培面積は852.9ha であり,収穫量は1,808t,
主要産地は長野県・群馬県・埼玉県となっている
(農林水産省 2009,表1)。ブルーベリーの栽培 面積が増加している背景には,国民の健康志向の上 昇と果実に豊富に含まれる植物色素アントシアニン が有する様々な生体機能性(視機能改善作用,抗腫 瘍機能,生体過酸化防止機能など)が広く消費者に 認知されたことが要因の一つとして考えられる。果 実の使途について,収穫量の約80%が生食用とし て,残りの約20%がジャム,ソース,ワインなどの 加工用として消費されている。我が国におけるジャ
*1 東京農工大学農学部附属広域都市圏フィールドサイエンス教育研究センター 〒183―8509 東京都府中市幸町3―5―
8:Field Science Center, Faculty of Agriculture, Tokyo University of Agriculture and Technology, 3-5-8 Saiwai-cho Fuchu-shi, Tokyo, 183-8509, Japan
フィールドサイエンス(J. Field Science)10:17―21,2012
図1.我が国におけるブルーベリーの栽培面積と収穫量 の推移
17
表1.ブルーベリーの都道府県別生産量(2007年)
都道府県名 栽培面積
(ha)
収穫量
(t)
出荷量
(t)
出荷量のうち 加工向け(t)
主要産地名
(市町村名)
北海道 23.9 29.7 29.3 12.7 仁木町
青森 37.6 44.5 27.6 17.1 八戸市,十和田市,東通村 岩手 54.0 96.6 94.2 69.5 岩手町,岩泉町,盛岡市 宮城 28.0 37.7 29.0 6.8 蔵王町,大崎市,富谷町 秋田 19.2 10.5 6.4 1.4 鹿角市,大館市,由利本荘市 山形 14.3 27.0 14.9 8.0 鶴岡市,寒河江市,尾花沢市 福島 17.9 14.8 9.9 7.1 三春町,棚倉町,郡山市 茨城 70.7 198.9 162.3 1.2 つくば市,かすみがうら市,石岡市 栃木 15.2 12.9 9.5 3.9 大田原市,茂木町,佐野市 群馬 90.6 123.5 79.9 1.3 渋川市,川場村,沼田市 埼玉 65.3 112.7 87.5 4.7 狭山市,美里町,熊谷市 千葉 25.5 68.2 42.9 2.7 君津市,いすみ市,市原市 東京 30.1 142.6 59.6 5.7 八王子市,小平市,国分寺市 神奈川 9.9 50.8 13.2 5.0 横浜市,小田原市,相模原市
山梨 18.5 28.0 22.0 - 北社市,富士河口湖町 長野 108.0 351.0 210.0 32.0 長野地域,北信地域,佐久地域 静岡 15.7 20.6 17.6 7.9 静岡市,浜松市,菊川市 新潟 10.8 90.2 79.7 4.2 上越市,阿賀野市,胎内市
富山 0.7 0.8 0.8 - 氷見市
石川 10.7 17.2 11.7 6.8 能登町 福井 4.9 4.5 3.5 1.0 おおい町,坂井市 岐阜 3.2 6.2 3.2 - 郡上市,多治見市,下呂市 愛知 7.1 7.6 4.1 2.8 豊根村,新城市,豊田市
三重 1.3 0.1 0.1 - 松阪市
滋賀 10.2 20.9 20.7 1.2 米原市,野洲市,愛荘町 京都 2.7 2.7 0.9 - 京都市,南山城村,南丹市,京丹後市 兵庫 4.3 4.7 1.6 0.6 養父市,洲本市,宍粟市 大阪 0.6 0.4 0.3 0.1 河内長野市,富田林市 奈良 11.3 27.9 27.9 8.7 宇陀市,奈良市,五條市 和歌山 5.9 22.1 19.9 1.4 和歌山市,紀の川市,有田川町
鳥取 13.0 7.1 0.4 0.4 江府町,大山町 島根 21.5 12.1 6.9 3.8 雲南市,大田市,邑南町 岡山 9.2 2.5 1.4 0.4 吉備中央町,真庭市 広島 6.8 29.2 21.7 18.3 大崎上島町,神石高原町,福山市 山口 1.4 2.9 2.5 - 下関市,長門市,周南市 徳島 2.0 6.0 5.9 5.0 小松島市,美馬市,東みよし町 愛媛 10.9 37.8 36.6 0.8 松山市,伊予市,砥部町 福岡 13.6 34.1 32.6 13.1 久留米市,北九州市,うきは市 佐賀 0.8 10.6 9.8 0.3 鳥栖市,多久市,佐賀市
長崎 0.8 0.8 0.7 - 対馬市,平戸市
熊本 15.6 44.9 44.4 43.2 山都町,西原村 大分 23.4 9.8 8.2 1.1 九重町,由布市,玖珠町 宮崎 6.7 14.5 13.6 0.5 都城市,西都市,宮崎市 鹿児島 9.1 20.4 12.5 6.8 霧島市,湧水町,大口市
計 852.9 1,808.0 1,287.4 307.5
フィールドサイエンス 10号 18
ム類の総生産量に占めるブルーベリージャムの割合 は比較的高いにもかかわらず(日本ジャム工業組合 2010,図2),原材料のほとんどは輸入に頼ってい る。ブルーベリーの栽培面積は今後も増加する傾向 にあるものと考えられ,果実の安定供給を可能とす る経済栽培技術の確立が求められている。
3.ブルーベリーの特徴 ―果実の成熟生理―
ブルーベリーは同一樹の結果枝内,さらには果房 内において個々の果実の成熟開始期が異なる。その ため,収穫は適熟果実を順次選択する必要があり,
収穫期間は一カ月以上におよぶ。本果樹の果実の成 熟に関する早晩性については多くの報告があり,玉 田(1998)はブルーベリーは着果枝の先端から基部 に向かって,同一果房内では基部から先端に向かっ て開花するが,開花の早晩と果実の成熟開始期は直 接関係ないことを報告している。また,ブルーベ
リーの果実は同一品種でも早期に成熟した果実は晩 期に成熟したものよりも大きく,種子数も多い傾向 にあることが報告されている(岩垣・玉田1971;
Mooreet al.1972)。さらに Kushima・Austin(1979)
は,ラビットアイブルーベリー21品種の果実中の種 子数とその大きさを調査し,大粒の果実には多くの 種子と大型の種子が多く含まれているとしており,
以上の研究報告からもブルーベリー果実の肥大と成 熟には含有する種子の影響が非常に大きいものと推 測される。
前述の通り,ブルーベリーの収穫期間は長期にわ たる。その間において,たとえ外観上の同一成熟段 階の果実でも,内成分は収穫時期により異なる場合 がある。筆者が5品種3系統のラビットアイブルー ベリーを供試して,適熟果実の果汁中の可溶性固形 物含量を収穫期間を通じて調査したところ,‘Blue- belle’,‘Homebell’,T―142,T―100のそれは収穫日 が遅くなるにしたがって有意に増加することが明ら かになった(伴ら 2003,表2)。可溶性固形物含 量の増加については,果実の収穫にともなって果房 内に残存する果実数が減少し,その結果として果実 あたりの葉からの光合成同化産物の転流量が増加し たためと考えられる。可溶性固形物含量以外にも,
ペクチン,セルロース,ヘミセルロースをはじめと する果肉中の細胞壁構成成分がたとえ同一成熟段階 の果実でも,その収穫時期により異なることが明ら かにされている(伴ら 2010a)。
以上のように,ブルーベリーの果実品質はその収 穫時期により大きく変化する。実際の生産現場にお いても,収穫時期により果実の食味が大きく変化す ることはよく知られており,特に収穫初期の大型の 果実は生食用として,晩期の小型の果実は加工用と
表2.ラビットアイブルーベリー‘Bluebelle’の収穫果実品質
(2000年調査)
収穫日 果実重
(g)
果実横径
(mm)
果実縦径
(mm)
可溶性固形物 含量(Brix°)
滴定酸含量
(g/100ml 果汁)
アントシアニン含量
(O.D. at525nm)
7月17日 2.2±0.1z 16.5±0.3 13.0±0.2 7.4by 0.98NSx 0.89NS 7月22日 2.0±0.1 15.5±0.3 12.3±0.2 7.8b 0.94 0.94 7月27日 1.9±0.1 15.2±0.2 12.2±0.2 8.0b 0.89 0.94 8月1日 1.5±0.1 14.5±0.3 11.7±0.3 9.6ab 0.89 1.01 8月6日 1.3±0.1 12.9±0.2 10.3±0.2 10.8a 0.96 1.07 z:平均値±標準誤差
y : Tukey の多重検定により,異なる文字間に5%水準で有意差あり x:有意差なし
図2.我が国におけるジャム類の種類別生産割合(2008年)
ブルーベリーに関する最近の研究成果(伴) 19
して利用されている。果実中の糖含量や細胞壁成分 はジャムなどの加工品の性状に非常に大きな影響を およぼすことから,果実の使途と内成分の変化を考 慮した収穫体系の設定が必要である。また,ブルー ベリー果実の成熟生理現象の解明のためには経時的 な調査に加えて,果実の成熟特性を十分考慮に入れ た実験区の設定が今後必要になるものと考えられる。
4.ブルーベリーの特徴
―根系発達特性の解明と画像解析―
ブルーベリーは他の一般的な落葉果樹と異なり酸 性土壌を要求する。樹体の成長に好適な土壌の pH はハイブッシュブルーベリーで4.0~5.2,ラビット アイブルーベリーで4.2~5.5とされている(玉田 1997)。また,根は非常に細いことから硬い土壌で
は成長が著しく制限され,根群の分布も浅層に限定 される。以上のような理由により,ブルーベリーの 原産国ではない我が国において,本果樹を栽培する ためには土壌改良が必須となる。具体的には,植え 穴の中にピートモスや暗渠資材を投入して土壌の物 理性を改善した後に苗を定植し,保水性の向上を目 的として有機物を利用したマルチを設置する方法で ある。このように我が国におけるブルーベリーはか なり特殊な土壌環境下で成長しているといえ,根系 発達特性も原産国におけるものと大きく異なること が予想される。これまでにもブルーベリーの根系発 達特性を調査した例は非常に多くある。しかし,ブ ルーベリーの根系は非常に細い根で構成されるた め,根部の採取が非常に困難であり,その解析項目 も限定されていた。近年のパーソナルコンピュター の性能向上は著しく,比較的安価に画像解析を行う ことが可能になった。そのなかで木村(1998)はフ リーの画像解析ソフトを利用して根長と根径を測定 する方法を開発した。本手法では根のサンプリング 後,染色し,パーソナルスキャナーを用いて画像を 取り込み,画像解析するものである。実際,本手法 により,カーネーションとツツジの根系が解析され ている(小林ら 2010;間下・今井 2008)。著者 も本手法を用いてブルーベリーの根系解析を試みて おり,安価で比較的簡単に根長と根径を測定できる ことを確認している(伴ら 2010b,図3)。また 最近では根系内にパーソナルスキャナーを設置し,
根の発達状況を経時的に測定する試みがキャベツな どを供試して行われており,本果樹への応用も期待 される(小野ら 2010)。
5.おわりに
2007年現在,我が国では43都道府県でブルーベ リーが栽培されている。また,最近ではほぼ一年を 通じて簡単に生食用の果実を入手できるようになっ た。しかし,本果樹は農林水産省の統計資料では特 産果樹に分類されており,未だマイナークロップの 域を脱したとは言えない。現在の我が国におけるブ ルーベリーの生産量が需要に占める割合はわずかで あり,安全で安心な国産果実を安定的に流通させる ためには増産を可能とする栽培技術の確立が必須で ある。今後はここ東京農工大学農学部附属広域都市 圏 FS 教育研究センターにて,ブルーベリーの栽培 技術の革新を目的とし,特に根系発達に注目して研 究を行っていく予定である。
引用文献
伴 琢也・山口雅篤・吉永好明・小川智広・植田尚 文(2003)収穫期間を通じたラビットアイブ ルーベリーの果実品質の比較.農業生産技術管 理学会誌 10:9―14.
伴 琢也・今野里美・宮下和也・石丸 恵・板村裕 之(2010a)成熟期間を通じたラビットアイブ 図3.ラビットアイブルーベリー‘Tifblue’2年生
挿し木苗の根系解析の様子 フィールドサイエンス 10号
20
ルーベリーの果肉中の細胞壁成分の変化.園芸 学研究 9(別2):403.
伴 琢也・串崎可奈恵・足立文彦・小林伸雄・浅尾 俊樹(2010b)培養土における鹿沼土の混合比 率がブルーベリー挿し木苗の根系発達に及ぼす 影響.園芸学研究 9(別1):295.
Eck, P. (1966) Botany. In Blueberry culture, Eck, P.
and Childers, N. F. (eds.), 378 pp, Rutgers Univ.
Press, New Brunswick : 14―44.
岩垣駿夫・玉田孝人(1971)ラビットアイブルーベ リー果実の横径生長と熟期および種子数との関 係について.園芸要旨昭46春:10―11.
木村和彦(1998)画像解析による根長と根の直径の 測定-その1.実践編-.根の研究 7:8―11.
小林伸雄・宮崎まどか・伴 琢也・中務 明・足立 文彦(2010)常緑性ツツジ挿し木苗における根 系の特性について.園芸学研究 9:25―29.
Kushima, T. and Austin, M. E. (1979) Seed number and size in rabbiteye blueberry fruit. HortScience 14 : 721―723.
間下なぎさ・今井克彦(2008)根箱,スキャナ及び パソコンを用いたカーネーション根の形態解
析.愛知県農業総合試験場研究報告 40:65―
68.
Moore, J. N., Reynolds, B. D. and Brown, G. R. (1972) Effects of seed number, size, and developmenton fruit size of cultivated blueberries. HortScience 7 : 268―269.
日本ジャム工業組合(2010)http : //www.jca-can.
or.jp/~njkk/(2010年9月24日確認)
農林水産省(2009)農林水産統計 平成19年特産果 樹生産動態等調査.
小野勇治・根本知明・武田容枝・三浦吉則(2010)
キャベツの定植前リン酸苗施用における改良型 ミニライゾトロン法を用いた根伸長反応の解 析.園芸学研究 9(別2):491.
玉田孝人(1997)ブルーベリー生産の基礎 [10].
農業および園芸 73:529―534.
玉田孝人(1998)ブルーベリー生産の基礎 [19].
農業および園芸 73:77―84.
Vander Kloet, S. P. (1988) The genus Vaccinium in North America. 201 pp, Canadian government publishing centre supply and services, Ottawa : 57―156.
ブルーベリーに関する最近の研究成果(伴) 21