Cross-national Social Survey in East Asia:
World Values Survey, ISSP, AsiaBarometer, Asian Barometer, East Asia Value Survey and EASS
Kunio MINATO
Osaka University School of Foreign Studies
東アジアにおける国際比較社会調査とその課題
−世界価値観調査、
ISSP
、アジア・バロメーター、アジアン・バロメーター、東アジア価値観国際比較調査から
EASS
へ−湊 邦生 大阪大学外国語学部
In East Asia (Japan, South Korea, Taiwan, China and Hong Kong) in recent years, cross-national social surveys have started such as the AsiaBarometer, the Asian Barometer (East Asia Barometer) and the East Asia Value Survey. These surveys, in contrast with surveys conducted worldwide like the World Values Survey and the ISSP (International Social Survey Programme), focus their attention on East Asia, and aim at clarifying issues and features which are inherent in the region. This article is a review of surveys with East Asian focus, and cross-national studies based on the result of such surveys, within the range of availability in Japan.
The purposes of the article are: 1) to gain understanding and knowledge of the current situation and problems of cross-national social surveys in East Asia; 2) to discuss the issues which the EASS (East Asian Social Surveys) project, implemented jointly by the Japanese General Social Surveys (JGSS) project team and South Korean, Taiwanese, Chinese and Hong Kong teams, has to work on.
Key Words: JGSS, EASS, Cross-national Social Survey
東アジア(日本・韓国・台湾・中国・香港)では、近年「アジア・バロメーター」
(AsiaBarometer)や「アジアン・バロメーター(東アジアバロメーター)」(Asian Barometer;
East Asia Barometer)
、「東アジア価値観国際比較調査」(East Asia Value Survey)などの国際 比較調査が開始されている。これらは世界規模で実施されている国際比較調査である「世 界価値観調査」(World Values Survey)やISSP(International Social Survey Programme)と
は異なり、東アジアに焦点を絞り、東アジアに特有の問題や特徴の解明を目指したもので ある。本稿では、それらの調査や、調査結果に基づく各国・地域の比較分析の結果につい て検討し、東アジアにおける国際比較調査の現状と課題について述べる。その上で、JGSS
プロジェクトが韓国・台湾・中国・香港のチームとともに実施しているEASS(East Asian Social Surveys)プロジェクトが取り組むべき課題について考察する。
キーワード:JGSS,EASS,国際比較社会調査
1. Introduction
Cross-national social surveys, targeting on people living in plural countries/regions with common question batteries or questionnaires, have been developed in Europe. In East Asia, on the other hand, such survey had been said to fall behind for a long time (Ikeda, 2004; Inoguchi, 2002).
Although there are countries/regions participating well-known worldwide surveys, the “World Values Survey” and the ISSP (International Social Survey Programme), those surveys are not always suitable for cross-cultural comparison within East Asia for the various reasons which will be mentioned below.
Recently, however, cross-national social surveys focusing on East Asia have appeared, such as
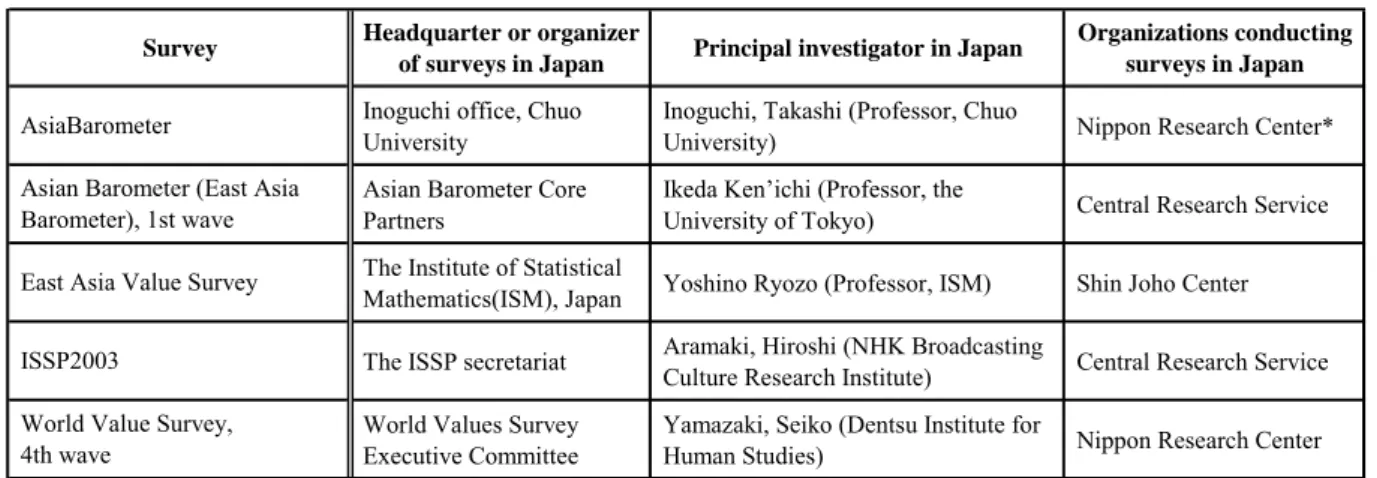
“AsiaBarometer”, “Asian Barometer (East Asia Barometer)” and “East Asia Value Survey”, and several studies based on those results have come to be seen. Summary of those surveys are complied in table 1 and table 2. Table 1 shows the name of the survey, countries and regions surveyed, target population, actual sample size in the survey in Japan, and the method of the surveys. Table 2 contains the Headquarter or organizer of the survey, principal investigator in Japan, and Organizations conducting the survey in Japan. Out of 5 surveys, the AsiaBarometer and the East Asia Value Survey are headquartered in Japan, while the East Asia Barometer is organized by Taiwanese researchers.
In addition to those surveys, the EASS (East Asian Social Survey) project was launched jointly by Japanese, South Korean, and Taiwanese teams which conduct nationwide social survey in each country/region. Japanese team is the JGSS (Japanese General Social Survey) team, conducting survey with the cooperation of Institute of Social Science, the University of Tokyo; South Korean team is the Sungkyunkwan University Survey Research Center; And Taiwanese team is the Institute of Sociology, Academia Sinica. In February 2005, Hong Kong team (the Survey Research Center at Hong Kong University of Science and Technology) and Chinese team (the School of Sociology and Population Studies, Renmin University of China) joined the project. The EASS conducted its first survey in 2006, with the topic of “Family in East Asia”. The second survey, “Globalization and Culture in East Asia”, will be conducted in 2008, and the third survey “Health” is planned in 2010
(1).
Table1 Cross-national social surveys in East Asia (1)
Target people Respondents Survey (age)2) (Response rate)2) method2) Japan1), South Korea, China, Thailand, Malaisia, Vietnam, 800 857
Myammer, India, Sri Lanka, Uzbekistan (20-59) -58.80%
1,200 −
(20 or over) (−)
1,200 787
(20 or over) -65.60%
1,800 1,102
(16 or over) -61.20%
1,000 1,362
(17 or over) (−) Note: 1) Countries and regions with underline are participating in the EASS 2006.
Source: Websites of the AsiaBarometer, the Asian Barometer, the East Asia Barometer, the East Asia Value Survey, the ISSP, the World Values Survey.
2) The number of respondents and survey method are those in Japan, and some difference, which will be mentioned below, can be seen in other countries/regions.
World Values Survey, 4th wave
34 countries/regions including Japan, South Korea,
Taiwan Interview
96 countries/regions including Japan, South Korea,
China Mailing
ISSP2003
Asian Barometer (East Asia Barometer), 1st wave East Asia Value Survey
Interview Countries and regions surveyed
Name
AsiaBarometer 2003
Japan, South Korea, Taiwan, China, Hong Kong,
Philippines, Thailand, Mongolia Interview
Japan, South Korea, Taiwan, China (Beijing, Shanghai,
Hong Kong), Singapore Interview
Table2 Cross-national social surveys in East Asia (2)
Inoguchi office, Chuo University
Inoguchi, Takashi (Professor, Chuo
University) Nippon Research Center*
Asian Barometer Core Partners
Ikeda Ken’ichi (Professor, the
University of Tokyo) Central Research Service The Institute of Statistical
Mathematics(ISM), Japan Yoshino Ryozo (Professor, ISM) Shin Joho Center The ISSP secretariat Aramaki, Hiroshi (NHK Broadcasting
Culture Research Institute) Central Research Service World Values Survey
Executive Committee
Yamazaki, Seiko (Dentsu Institute for
Human Studies) Nippon Research Center
Note: *2004 and 2005 surveys were conducted by Shin Joho Center.
Source:
Headquarter or organizer
of surveys in Japan Principal investigator in Japan Organizations conducting surveys in Japan
Websites of the AsiaBarometer, the Asian Barometer, the East Asia Barometer, the East Asia Value Survey, the ISSP, the World Values Survey.
Survey
AsiaBarometer
Asian Barometer (East Asia Barometer), 1st wave East Asia Value Survey
ISSP2003
World Value Survey, 4th wave
This article aims at clarifying current situation and challenges of cross-national social survey in East Asia. For that purpose, we will first examine worldwide social surveys mentioned above, i.e.
the World Values Survey and the ISSP, and discuss necessity of cross-national survey focusing on East Asia. Then we will review such surveys, the AsiaBarometer, the Asian Barometer and the East Asia Value Survey, and cross-national comparative studies based on the result of those surveys, within the range of availability in Japan.
2. The World Values Survey
The World Values Survey (WVS), headed by Michigan University Professor Ronald Inglehart, is a cross-national comparative research project which aims at grasping change of political culture and society of various countries in courtiers and regions all over the world. Up to now five waves (surveys) have been carried out since 1981, and out of these, the summary and data of 1st, 2nd, 3rd and 4th waves are published. Table 3 shows outline of those surveys, and table 4 shows methodology of the World Values Survey in East Asia. The survey data are deposited in ICPSR (Inter-university Consortium of Political and Social Research), and in the World Values Survey website, the data of each wave (from 1st wave to 4th) and cumulative data set can be also downloaded in SPSS form.
Table 3 Summary of World Values Survey
1)Survey years
No. of participant countries and regions Participant countries and regions in East Asia1981 12 Japan, South Korea, China
1989-1992 37 Japan, South Korea, China
1995-1998 91 Japan, South Korea, Taiwan
1999-2002 96 Japan, South Korea, China, Taiwan
2)Note:
Source: The World Values Survey website.
1) Survey years and counting and name of surveys are not unified between literatures. In this table they are based on Yamazaki (2004) and are different from World Values Survey website or some of other literatures.
2) In Yamazaki (2004), Taiwan is listed as a participant, but in World Values Survey website it is said to have participated only in “WVS-1995” (3rd wave)
4th Wave
1st
2nd
3rd
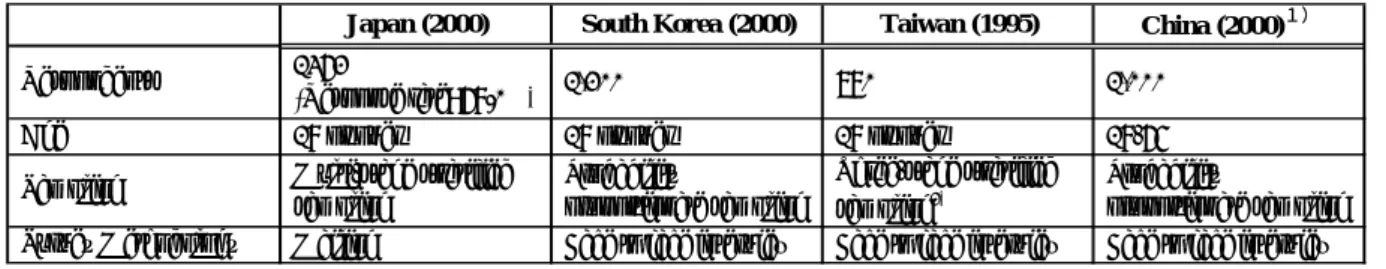
Table 4 Methodology of the World Values Survey
1362
(Response rate: 68.0%) 1,200 780 1,000
18 or over 18 or over 18 or over 18-65
Multi-stage stratified sampling
Probability
proportionate sampling
Three-stage stratified sampling2)
Probability
proportionate sampling Mailing Face to face interview Face to face interview Face to face interview Note:
2) Confirmed by Dr. Su-Hao Tu, Assistant Research Fellow of the Office of Survey Research, Academia Sinica.
Source: The World Values Survey website.
Sampling
Survey Methodology
1) In China, six remote provinces with very low population density were excluded from the sampling process: Hainan, Tibet, Gansu, Qinghai, Ningxia, and Xinjiang. These provinces consists 5.1% of the total population and 4.6% of total households of the country. (The World Values Survey website)
Japan (2000) South Korea (2000) Taiwan (1995) China (2000)1)
Respondents Age
The main feature of the WVS lies in its scale, which enables us to clarify various aspects of values of diverse people living in various countries and regions. As shown in table 3, the number countries and regions participating in WVS increased time to time, with various backgrounds of economic standard, political system and religions. Especially, the WVS carries out survey and offers valuable social data in Asia, Africa, the former Soviet Union and Latin America, where survey data had long been hardly available. Besides, there are various questions asking respondents’ values on various topics including family, health, environment, job, politics, economy and religion in a questionnaire and 4th wave question items reach almost 250.
Acknowledging the merits mentioned above, we have to be aware of problems in the WVS.
First, the sample of the WVS in each country or region is supposed to be at least 1,000, consisting of men and women aged 18 or over. Yet actually it is uneven between countries and regions. In 4th wave, for example, the sample size was the smallest in Puerto Rico with 720 respondents, while the largest size was 3,401 in Turkey
(2), which is about 4.7 times larger than that of Puerto Rico
(3).
Another problem is in methodology. In the WVS conduct and data collection is left to a participant of each country or region, and there are not unified survey schedule, sampling specifications of data collection. In addition, until 4th wave every country and region was to use the same questionnaire
(4), but actually not all the questions were asked in each country. So we cannot obtain all the data in the original questionnaire in all countries and regions questions.
As for analysis of East Asia, other problems should be point out. As seen in table 3, Japan, South Korea, Taiwan, and China have not conducted survey in the same wave. Moreover, translation from English questionnaire is another issue to be examined. Manabe et. al. (1996) pointed out two discrepancies between the questionnaire used in the USA and that used in China. There is an item saying “Trade unions” in the former, English version of the questionnaire, but in the latter the item was translated as “Organizations of trade”. Also, “lying in your own interest” in the US questionnaire was changed into “relying on interest” in the Chinese version.
Judging from above, although data of the WVS enables us comparative analysis of various countries and regions in the world, it is dangerous to use the data unless we examine the data carefully
(5).
3. The ISSP
The ISSP is the cross-national comparative survey which was started in 1984 by West Germany,
USA, UK and Australia. Since then countries and regions participating in the ISSP had increased,
and number of those reached 39 countries in 2003. From East Asia Japan was first accepted to the
ISSP 1992 and started survey in 1993, followed by Taiwan (accepted in 2001 and started survey in 2002) and South Korea (accepted in 2002 and started survey in 2003).
The main characteristics of the ISSP are seen in existence of a certain topic in each survey, such as “National Identity” (1995 and 2003) or “Role of Government” (1985, 1990 and 1996), and repetition of the topics after a certain period of time. This enables researchers to make time-series comparison between surveys, as well as cross-national analysis at the same survey. Survey topics and the countries and regions conducting survey until 2009 are shown in table 5 and table 6.
Another feature of the ISSP is its detailed rules on conduct of survey (ISSP working principles).
The standard questionnaire is decided at the General Meeting held a year before the survey, and it is bound to be written in British English. The questionnaire is translated into each national questionnaire by non-literal, culturally equivalent translation, but no transformation of the questionnaire or addition of new question is permitted. The working principles of the ISSP establishes that questionnaires should be 15 minutes-long with 60 questions, and At this chance the insertion of a new question and a change of a turn are not accepted. Sample has to consist of at least 1,000 person aged 18 years old or over (16 years old or over in Japan and Russia), which represents each country or region and is chosen by random sampling. It is determined that each participating nation should conduct a survey and send the archive the result of the survey by definite deadline, and it is required to report precisely the outline of the survey and sampling method when sending the data.
Besides, it is necessary to answer the questionnaire called Study Monitoring Questionnaires which regards the method of the survey. These points shows clear contrast to the WVS, which allows variations in data collection, survey schedule and specification the data (Yamazaki, 2004:93).
Survey data of the ISSP is released by German data archive ZA (Zentralarchiv für Empirische Sozialforschung) and the ICPSR.
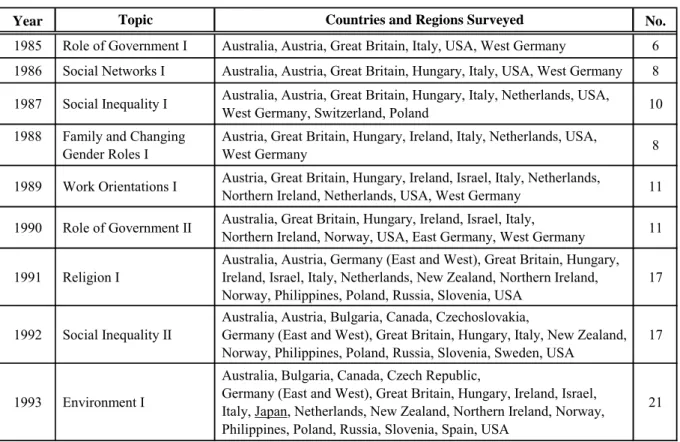
Table 5 Survey topics of the ISSP
Year No.
1985 Role of Government I Australia, Austria, Great Britain, Italy, USA, West Germany 6 1986 Social Networks I Australia, Austria, Great Britain, Hungary, Italy, USA, West Germany 8 1987 Social Inequality I Australia, Austria, Great Britain, Hungary, Italy, Netherlands, USA,
West Germany, Switzerland, Poland 10
1988 Family and Changing Gender Roles I
Austria, Great Britain, Hungary, Ireland, Italy, Netherlands, USA,
West Germany 8
1989 Work Orientations I Austria, Great Britain, Hungary, Ireland, Israel, Italy, Netherlands,
Northern Ireland, Netherlands, USA, West Germany 11 1990 Role of Government II Australia, Great Britain, Hungary, Ireland, Israel, Italy,
Northern Ireland, Norway, USA, East Germany, West Germany 11 1991 Religion I
Australia, Austria, Germany (East and West), Great Britain, Hungary, Ireland, Israel, Italy, Netherlands, New Zealand, Northern Ireland, Norway, Philippines, Poland, Russia, Slovenia, USA
17
1992 Social Inequality II
Australia, Austria, Bulgaria, Canada, Czechoslovakia,
Germany (East and West), Great Britain, Hungary, Italy, New Zealand, Norway, Philippines, Poland, Russia, Slovenia, Sweden, USA
17
1993 Environment I
Australia, Bulgaria, Canada, Czech Republic,
Germany (East and West), Great Britain, Hungary, Ireland, Israel, Italy, Japan, Netherlands, New Zealand, Northern Ireland, Norway, Philippines, Poland, Russia, Slovenia, Spain, USA
21 Countries and Regions Surveyed
Topic
Year No.
1994 Family and Changing Gender Roles II
Australia, Austria, Bulgaria, Canada, Czech Republic,
Germany (East and West), Great Britain, Hungary, Ireland, Israel, Italy, Japan, Netherlands, New Zealand, Northern Ireland, Norway,
Philippines, Poland, Russia, Slovenia, Spain, Sweden, USA
23
1995 National Identity I
Australia, Austria, Bulgaria, Canada, Czech Republic,
Germany (East and West), Great Britain, Hungary, Ireland, Italy, Japan, Latvia, Netherlands, New Zealand, Norway, Philippines, Poland, Russia, Slovakia, Slovenia, Spain, Sweden, USA
23
1996 Role of Government III
Australia, Bulgaria, Canada, Cyprus, Czech Republic, France, Germany(East and West), Great Britain, Hungary, Ireland,
Israel (Jews and Arabs), Italy, Japan, Latvia, New Zealand, Norway, Philippines, Poland, Russia, Slovenia, Spain, Sweden, Switzerland, USA
24
1997 Work Orientations I
Bangladesh, Bulgaria, Canada, Cyprus, Czech Republic, Denmark, France, Germany(East and West), Great Britain, Hungary, Israel (Jews and Arabs), Italy, Japan, Netherlands, New Zealand, Norway, Philippines, Poland, Portugal, Russia, Slovenia, Spain, Sweden, Switzerland, USA
25
1998 Religion II
Australia, Austria, Bulgaria, Canada, Chile, Cyprus, Czech Republic, Denmark, France, Germany (East and West), Great Britain, Hungary, Ireland, Israel, Italy, Japan, Latvia, Netherlands, New Zealand, Northern Ireland, Norway, Philippines, Poland, Portugal, Russia, Slovakia, Slovenia, Spain, Sweden, Switzerland, USA
31
1999 Social Inequality III
Australia, Austria, Bulgaria, Canada, Chile, Cyprus, Czech Republic, Denmark, France, Germany (East and West), Great Britain, Hungary, Israel, Japan, Latvia, New Zealand, Northern Ireland, Norway, Philippines, Poland, Portugal, Russia, Slovakia, Slovenia, Spain, Sweden, USA
27
2000 Environment II
Austria, Bulgaria, Canada, Chile, Czech Republic, Denmark, Finland, Germany, Great Britain, Ireland, Israel, Japan, Latvia, Mexico, Netherlands, New Zealand, Northern Ireland, Norway, Philippines, Portugal, Russia, Slovenia, Spain, Sweden, Switzerland, USA
26
2001 Social Networks II
Australia, Austria, Brazil, Canada, Chile, Cyprus, Czech Republic, Denmark, Finland, France, Germany, Great Britain, Hungary, Israel, Italy, Japan, Latvia, New Zealand, Northern Ireland, Norway, Philippines, Poland, Russia, Slovenia, South Africa, Spain, Switzerland, USA
28
2002 Family and Changing Gender Roles III
Australia, Austria, Brazil, Bulgaria, Chile, Cyprus, Czech Republic, Denmark, Finland, Flanders (Belgium), France, Germany,
Great Britain, Hungary, Ireland, Israel, Japan, Latvia, Mexico, Netherlands, New Zealand, Northern Ireland, Norway, Philippines, Poland, Portugal, Russia, Slovakia, Slovenia, Spain, Sweden, Switzerland, Taiwan, USA
34
2003 National Identity II
Australia, Austria, Bulgaria, Canada, Chile, Czech Republic, Denmark, Finland, France, Germany, Great Britain, Hungary, Ireland, Israel, Japan, Latvia, Netherlands, New Zealand, Norway, Philippines, Poland, Portugal, Russia, Slovakia, Slovenia, South Africa, South Korea, Spain, Sweden, Switzerland, Taiwan, Uruguay, USA, Venezuela
34
2004 Citizenship
Australia, Austria, Brazil, Bulgaria, Canada, Chile, Cyprus, Czech Republic, Denmark, Dominican Republic, Finland, Flanders (Belgium), France, Germany, Great Britain, Hungary, Ireland, Israel, Japan, Latvia, Mexico, Netherlands, New Zealand, Norway, Philippines, Poland, Portugal, Russia, Slovakia, Slovenia, South Africa, South Korea, Spain, Switzerland, Taiwan, Uruguay, USA, Venezuela
38
2005 Work Orientations III
Australia, Bulgaria, Canada, Cyprus, Czech Republic, Denmark, Dominican Republic, Finland, Flanders, France, Germany, Great Britain, Hungary, Ireland (Republic), Israel, Japan, Latvia, Mexico, New Zealand, Norway, Philippines, Portugal, Russia, Slovenia, South Africa, South Korea, Spain, Sweden, Switzerland, Taiwan, USA
31
Note: Countries and regions with underline are participating in the EASS 2006.
Countries and Regions Surveyed Topic
Table 6 Survey topics of the ISSP (countries and regions have not been announced)
Topic Role of Government IV Leisure Time and Sports Religion III
Social Inequality IV Environment III
Note: Survey topics in 2009 and 2010 are under contemplation.
Source: the ISSP website.
Year
2010 2009 2008 2007 2006
The ISSP, with above-mentioned characteristics, has also some problems in methodology.
Survey method differs between countries/regions such as interview, mailing, and distribution collection method. Difference is also seen in a sampling method and the degree of usage of provisional sample. Some countries and regions do not use any of it, while the Philippines is said to approach people 10 times more than the target sample before conducting a survey. And in France in the 1999 survey, there were 11,015 persons who are targeted on the survey, but the number of respondent was only 1,889 (Aramaki and Onodera, 2004; Onodera, 2003b). On account of these differences, careful examination in required when we are to use data of these countries.
There are also problems as to comparative analysis within East Asia. As mentioned earlier, it is 2003 when Japan, South Korea and Taiwan conducted the ISSP survey altogether, and survey has not been carried out in China so far
(6). This imposes strict limitation on the possibility of comparative analysis using the ISSP data. In addition to this, as Onodera (2003b) pointed out, questionnaires are not free from Western sense of values because most of the participating countries and regions are Western nations. For example, in countries and regions participating in the 2003 survey, there are only 4 non-Christian countries and regions: Japan, South Korea, Taiwan and Israel.
Non-European countries beside those 4 were Chile, the Philippines, South Africa and Venezuela, but they are still minority in the 34 participants. Onodera also recollected her own experience as a representative Japanese team in the 1998 survey “Religion”; at that time all countries and regions but Israel were those holding Christianity, so she took some trouble explaining Japanese values toward religion and religious activities in Japan, which were far different from those in Western culture. (ibid.) Judging from above, as far as the current ISSP data is concerned, it is difficult to use the data on comparative analysis between East Asian countries and regions. Although cross-national comparative studies using the ISSP data do exist in Japan, they focus on comparison with Japan and Western countries (Onodera, 2000; 2001; 2003a), or comparison with Japan and other countries and regions all over the world (Manabe, 1999).
Onodera, who has been engaged in the ISSP project in the NHK Broadcasting Culture Research
Institute, argues that the ISSP in the future should “be premised that there are countries whose
structure of values differs with each other, incorporate variety of values, and be oriented to the survey
which examines the difference of the structure of value between areas” (Onodera, 2003b:27). And
she expects the researcher using the ISSP data to make and analysis on such difference. Her
argument is based on the anticipation that many countries and regions with various backgrounds will
participate in the ISSP in future. This may apply to the WVS as well, which already includes great
variety of countries and regions. In other words, when we are going to make a comparative analysis
within East Asia, where some common feature might be observed in values, cross-national survey is
necessary which can capture characteristics of the area. The following chapters are review of such
survey and studies based on them.
4. The AsiaBarometer
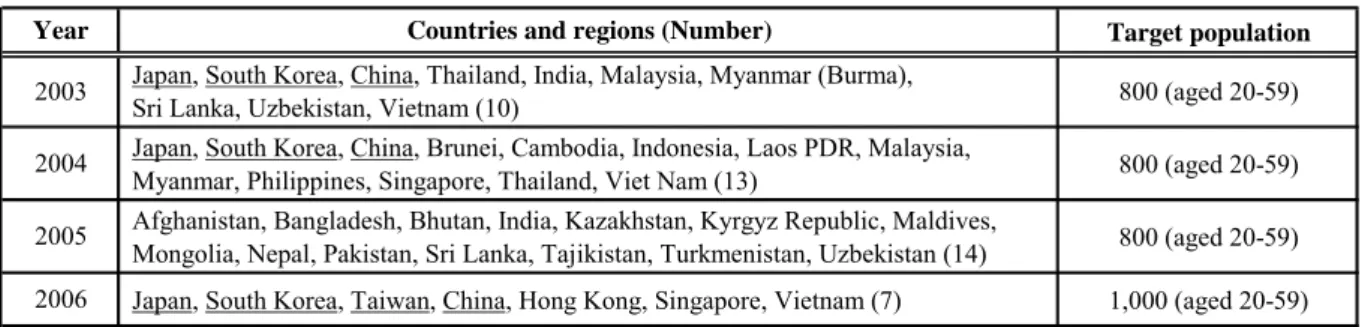
The AsiaBarometer has been conducting survey since 2003 in various parts in Asia, based on a common framework with a common standard questionnaire. The countries and regions surveyed vary every year, which are shown in table 7
(7). Table 8 shows the method of the AsiaBarometer in East Asia, taking 2003 survey for example.
Table 7 Countries and regions surveyed, and target population in the AsiaBarometer
Target population
Japan, South Korea, China, Thailand, India, Malaysia, Myanmar (Burma),
Sri Lanka, Uzbekistan, Vietnam (10) 800 (aged 20-59)
Japan, South Korea, China, Brunei, Cambodia, Indonesia, Laos PDR, Malaysia,
Myanmar, Philippines, Singapore, Thailand, Viet Nam (13) 800 (aged 20-59) Afghanistan, Bangladesh, Bhutan, India, Kazakhstan, Kyrgyz Republic, Maldives,
Mongolia, Nepal, Pakistan, Sri Lanka, Tajikistan, Turkmenistan, Uzbekistan (14) 800 (aged 20-59) Japan, South Korea, Taiwan, China, Hong Kong, Singapore, Vietnam (7) 1,000 (aged 20-59)
Note: Countries and regions with underline are participating in the EASS 2006.Source: The AsiaBarometer website.
2005 2006
Countries and regions (Number) Year
2003 2004
Table 8 Methodology of sampling and survey of the AsiaBarometer 2003
Sample size 857 (Response rate: 58.8%) 800 800
Sampling Two-stage stratified random sampling
Two-stage stratified random sampling
Choosing 10 individuals from randomly-chosen 10 survey points in 8 cities (Beijing, Shanghai, Guangzhou, Chongqing, Xi’an, Nanjing, Dalian and Tsingtao)
Survey Method Placement Face to face interview Face to face interview Source: The AsiaBarometer website.
Japan South Korea China
Takashi Inoguchi, the leader of the AsiaBarometer, describes the main subject of the AsiaBarometer as “daily of ordinary people in Asia” (Inoguchi, 2005a:17). Unlike the WVS or the ISSP, questionnaires of the AsiaBarometer contain questions regarding life of respondent, which can be categorized into the following nine clusters: 1) social infrastructure, 2) patterns of economic life, 3) patterns of daily life, 4) values and norms in daily life, 5) values and norms associated with social behavior, 6) identities, 7) views on social and political issues and institutions, 8) health conditions, and 9) sociological attributes of respondents (Inoguchi, 2006b; Inoguchi and Fujii, 2007:7).
Basically, the survey of the AsiaBarometer is conducted thorough face-to-face interview to respondents chosen by random sampling. However, telephone is used in area where interviews are difficult, and in Japan 2003 survey was conducted by placement method (Inoguchi et. al., 2005a).
In addition, in 2003 survey people in urban area were focused on, except Japan and South Korea which conducted a nationwide survey.
The data of the AsiaBarometer is now being released. In the AsiaBarometer website 2003 and 2004 data can be downloaded upon request. 2003 data is also deposited in ICPSR and SSJ (Social Science Japan) Data Archive and is open to public. Also, a CD-ROM containing data and all the questionnaires used in each country is attached to the codebook of 2003 survey (Inoguchi, et. al., 2005b), which will be mentioned below.
There are already several cross-national studies covering East Asia with the survey result of the
AsiaBarometer. Manabe (2004) made three exploratory analyses with 2003 survey data. First, he
investigated the condition and process of spread of public utilities such as waterworks, electricity and
city gas (Q1; see «Appendix A» for questions of the AsiaBarometer). Then, he made two correlation analyses, among well-being (Q4, Q5a-o and Q6), trust in people (Q9, Q10 and Q11) and institution (Q21a-r) and among frequency of voting (Q24a and b), sense of obligation to vote (Q25a), political cynicism (Q25b-g) and national pride (Q15-2). With his analyses, he revealed that countries could be divided into two categories according to the correlation between political behavior and national pride; the one consisted of countries where national pride correlated positively to frequency of voting and sense of obligation to vote, as well as negatively to political cynicism (Q25b-g), the other was countries where such correlations do not exist. Japan, South Korea and China were included in the former category. In addition, in the article he indicated two advantages of the AsiaBarometer.
The one is related on Asian focus of the AsiaBarometer, although cross-national surveys have mainly focused on North America and Europe. With its Asian focus, he explains, it becomes possible to produce hypotheses and scientific knowledge based on Asian reality, and thus to understand diversified consciousness of Asian people. The other advantage is that the AsiaBarometer encourages reinvestigating and clarifying stereotypes and concepts which tend to be regarded as self-evident
(8).
In Manabe (2006a), concepts of “happiness and satisfaction” were examined by using questions on happiness (Q4) and satisfaction (Q5) out of 2003 and 2004 data. The results could be summarized as the following four things: first, happiness cannot be fully determined by economic development; second, correlation between happiness and satisfaction is weak; third is on the relationship between income and satisfaction. Income increases as the age of respondents get older, but satisfaction with income decreases at the same time. And correspondence of income with satisfaction with income is not necessarily strong; fourth, in Japan, South Korea and China, “public safety”, “environment”, “social welfare”, “democracy” are loaded in one factor.
Inoguchi (2005b, 2005c) summarized arguments about “the East Asian Community” which was frequently put on a topic in recent years and produced five theories about driving forces of the East Asian Community, i.e. functional unification which is based on economic ties, regional identity, middle class impellers, reorganization of national and regional security, and democracy. He argued that the AsiaBarometer could offer proof and/or disproof to the five theories by presenting data which showed consciousness of East Asian citizens. However, he did not make analysis in the article, and left concrete image of East Asian Community to be described in future.
Inoguchi (2006a) discussed whether the Japanese lost their law-abiding spirit through a cross-national comparison. From the data of AsiaBarometer 2003 and 2004 on how to deal with bureaucracy (Q26) and sense of justice and solidarity (Q11), he argued that in Japan more people tend to ignore the authority, and to refuse to be taken in on people in trouble. Based on his argument, he alerted Japanese society seemed at stake.
In the series of his analyses, Tanaka (2005, 2006, 2007) argued current situation of Asian international politics and Japanese foreign diplomacy with the question asking whether a country has a good influence or a bad influence on respondent’s own country/region (Q20). The result regarding East Asia, which is our concern, showed that Japan was seen to have good influence in most countries, except countries including South Korea and China. China also showed good performance in many countries, which was not the case in Japan and Taiwan. South Korea was a country which scarcely thought to have a good influence from other countries. From these results, he argued that mutual distrust was prevailing in East Asia and it was the most important challenge Japanese diplomacy was facing.
Kawato (2005) discussed on whether “East Asian Civilization” can be formed or not with the data
of AsiaBarometer 2003. He argued that there were both encouraging and discouraging factors found from the result of the AsiaBarometer; the former included high level of trust in others (Q9), middle-class consciousness and satisfaction with life (Q6), indifference to religion (Q17-1), and fine image of East Asia seen by other Asian countries (Q20); the latter contained relatively low sense of identification to Asia (Q16-1), adherence to social group in countries other than Japan (Q16-2), authoritarianism (Q21) and mutual distrust among East Asian countries (Q20).
Fukushima (2005) made a cross-national comparison on trust in the UN, WTO and IMF among Japan, South Korea and ASEAN countries (Q21). The result showed that the UN, although very few respondents chose the answer of “trust a lot”, garnered trust more than other organizations.
Fukushima attributed it to the lack of an organization dealing with security in Asia. When it comes to economic organization, WTO gained almost as much trust as the UN in those countries, while the IMF, criticized its treatment of Asian currency crisis, turned out to be less trusted than WTO.
Sonoda (2005b) discussed whether newly-emerging “urban middle class”
(9)could support the forthcoming “East Asian Community”, by examining their own educational background, ethnic consciousness (Q15-2), importance of religion (Q21), sense of belonging to a social group within a country, identification as an Asian person (Q16-1) and trust in central government (Q21). On the basis of these, he argued that there was a similarity between new middle class and working class within a country, so middle class in Asia did not share common value across countries. Although usage of the Internet (Q2, Q38) might well show as if cultural exchange and mutual understanding were prevailing in East Asia, it was not clear whether this was the truth. On the contrary, exchange of information only within the borders might raise radical nationalism, as seen in Chinese anti-Japan demonstrations in 2005.
Sonoda (2006a) extended his discussion above to a comparative analyses between new middle class
(10)and working class in Asia on the following ten items: 1) age, 2) sex, 3) percentage of university graduate, 4) exposure to globalization (Q2), 5) fluency of English, 6) anti-nepotism (Q13), 7) religiosity, 8) support of gender-equal policy (Q23j), 9) support of environmental policy (Q23a) and 10) pro-democratic attitude (Q27). He first analyzed difference between new middle class and working class, both of which consisted of the total number in Asia. The difference was significant in most variables, but in some socio-political variables (4, 7, 8, 9) it was smaller than in socio-cultural variables (1, 2, 3, 5), and not significant in others (6, 10). He also analyzed the difference in each country, and found that two clusters of middle classes in countries surveyed. The one was former Anglo-American colonies, (Malaysia, Philippines, and Singapore), and the other non-English speaking countries. Compared with the latter, new middle class of the former consisted of more women.
They are equipped with higher educational background and more fluency in English. In the former cluster income was influenced positively by the fluency in English, while such influence was not found in some of the countries in the latter (Japan and China), or if any, very weak effect was seen (Indonesia).
Hosono (2005) argued the relationship between economic and social development and sense of happiness in ASEAN+3 countries. His analysis showed that no correlation could be found between life expectancy, which was used as a proxy variable of development, and other variables including happiness (Q4), satisfaction with aspects of life (Q5) and trust in central government (Q21).
Focusing his attention on Japan and South Korea, both of which had developed far more than other countries surveyed but showed low sense of happiness, he argued that sense of happiness could not be determine so much by development as by one’s own status compared with others surrounding him/her.
Such comparison created relative dissatisfaction, and it was a background lying in a society with high
standard of living and low sense of happiness. Based on this argument, he suggested to reduce the disparity in society and thus to restore social integration.
Other than the above-mentioned studies, source books were edited about investigation in 2003 survey, written in Japanese and English (Inoguchi et. al., 2005a; English version, Inoguchi, et. al., 2005b). In the source book case studies of 10 countries were performed based on 2003 survey, which was appreciated by a book review by Chen (2006) as “largely succeeded in putting together … a wealth of information from a timely source on a diverse group of Asian countries” (Chen, 2006:400).
The AsiaBarometer is a cross-national research specialized in Asia, which offers wide variety of data about everyday life and consciousness of citizens living in Asia. It also made it possible to make comparative research within Asian countries and regions. At the same time, however, we cannot put aside some problems, as Kawato (2006) pointed out in his book review of the source book.
First, some questions about politics are ambiguous so that they may not provoke caution of the authorities in some countries. Q20, for example, asks whether respondents think countries mentioned in the questionnaire “have a good influence or a bad influence on your country” (AsiaBarometer 2003 questionnaire). But as ‘influence’ has many aspects such as politics, economy or culture, so answers might differ depending on which aspect respondent see. Moreover, as Sonoda (2005a) argues, when consciousness of citizens is surveyed in a socialist country or a country under dictatorship, it would be necessary to add a question to ask whether the respondent is a member of the party in power. Besides, in countries where citizens are strictly monitored by the authorities, respondents might answer to the questions taking the authorities’ intention into account.
Sonoda (2006b) also pointed out challenges the AsiaBarometer is facing. As seen before, East Asia is an area which has short history of cross-national survey. This makes it difficult to explain the survey results logically, for in such area framework for logical explanation on survey result does not exist. Besides, drafting a questionnaire is likely to be led by the member of the project. Sonoda regards calling for a question battery, which JGSS project adopts, as one of the solutions for this.
5. The Asian Barometer (East Asia Barometer)
The Asian Barometer (ABS) is a comparative survey of public opinion on political values, democracy, and governance around the region. The headquarter of the ABS is at National Taiwan University (NTU), with the cooperation of the Department of Political Science at the NTU and the Institute of Political Science of Academia Sinica. Originally, the ABS was launched as the East Asia Barometer (EABS) in 2000, a survey focusing on democracy and value change in the region. The EABS merged with the South Asia Barometer in 2003 and became the ABS. Meanwhile, in 2001 the EABS built a partnership with three survey project in other area: Latinobarometro, Afrobarometer and the Arab Barometer, and together they inaugurated the Global Barometer Survey (GBS).
Table 9 shows countries and regions surveyed in either wave of the ABS. In regards of methodology, although it has not been open to public in most countries and regions, we can see Japanese country report of the 2nd survey of the ABS in Japan. According to the report, the 2nd wave survey in Japan was conducted in face-to-face interview by Central Research Services. Target population was 2,500 people aged 20 or over, chosen in two-stage stratified random sampling method.
Out of the samples 1,067 valid responses were obtained, and the response rate was 42.7% (Ikeda et. al., 2007)
(11).
Out of two waves of the ABS, dataset of the 1st wave has already been released and can be
obtained in the Asian Barometer website. Online analysis is also possible on the website. There is
preliminary dataset of the 2nd wave with the exclusion of countries where data processing are not
completed, but the two dataset has already provided number of cross-national studies concerning democracy in East Asia, which will be reviewed below.
Albritton et. al. (2003) analyzed determinants of support for democracy (100, 101, 103, 104, 118 and 119 in «Appendix B»; numbers refer to questions in the 1st wave unless otherwise indicated).
The analysis showed that support for democracy is not determined by nationality except Thailand, but by location of the respondents (urban or rural area), modern attitudes (64-72), trust to other people (24) and economic prospect (6). In this analysis, based on studies of Thailand, it was assumed people in urban area and with modern orientations tend to give less support for democracy than those in rural area and with more traditional backgrounds, and the analysis did support their assumption.
Table 9 Countries and regions surveyed in the ABS Survey year Countries and regions surveyed
2001-2002 Japan, South Korea, Taiwan, China, Hong Kong, Mongolia Philippines, Thailand 2006-2007 Japan, South Korea, Taiwan, China, Hong Kong, Cambodia, Philippines, Indonesia,
Malaysia, Mongolia, Singapore, Thailand, Vietnam
Note: Countries and regions with underline are participating in the EASS 2006.Source: The East Asia Barometer website.
Wave 1st 2nd
Chang et. al. (2003) made an analysis on how corruption affected trust in political institution (7-10, 12-14) in East Asia. From the result of their analysis, corruption, both perceived (114, 115) and witnessed (116), eroded trust in political institution, even when they controlled economic condition in past (2), present (1) and future (3), satisfaction with democracy (104), perceived fairness of government (106), perceived influence of people on government (107), perceived freedom (105), gender and age.
Chu et. al. (2003) explored what would lead people in East Asia to detach from authoritarian regime, which is still considered to be a potential alternative to democracy in the area. Pointing out exceptional generosity to non-democratic regime in East Asia (121-124), they analyzed the impact of factors which previous studies regarded as a source of detachment from authoritarianism: i) socio-economical background such as education, age and income; ii) institutional influences measured by electoral (27, 29, 30) and non-electoral (73, 75, 76, 78) participation, membership in civic organizations (19) and psychological involvement in politics (56-58); iii) performance of democratic regime indicated by satisfaction with it (98), trust in democratic institutions (8-10, 14, 16), level of political corruption (114, 115) and perceived responsibility of political leaders (128, 129); iv) economic condition of respondents themselves (4, 5) as well as their country/region (1, 2); v) regime comparison consisting of perceived democratic progress (99, 100), increase in political rights (105-113); and vi) social and political value revealed in detachment from traditionalism (64-71), values toward democracy and authoritarianism (132-139) and belief in procedural norm in democracy (145-148). Their cross-national analyses showed that the social and political value, more specifically, detachment from traditionalism and democratic orientation was the most critical force of detachment from authoritarianism.
Comparison on regime performance came next, while economic condition did not hold significant effect on democracy.
Another study on the source to orient people toward democracy is Chu and Huang (2007). In
this study not only determinants of detachment from authoritarian regime (121-124) but also support
for democracy (101, 103, 117, 118) was analyzed, but here they used the data of the 2nd wave, while
the previous study used the 1st. Also, variables included in the analysis were somewhat different
from Chu et. al. (2003). The most striking is that quality of democracy evaluated by the respondents, consisting of rule of law (43, 104, 112-116, 120 in the 2nd wave), equality (108, 109 in the 2nd wave), freedom (110, 111 in the 2nd wave), and accountability (103 in the 2nd wave), replaced performance of democratic regime. From their analyses they concluded that culture of detachment from traditionalism and democratic orientation was the main source of detachment from authoritarianism, which confirmed the argument of Chu et. al. (2003). Meanwhile, support for democracy, they argued, was determined by perceived democratic progress and satisfactory with democracy, rather than cultural factors.
Ikeda et. al. (2003) investigated the patterns of social capital in promoting democracy under different cultural contexts. For that purpose, they analyzed how political participation was related with social capital and cultural factors. Political participation was divided into two categories, i.e.
election participation (27, 29, 30) and active political participation (73-80). Social capital includes participation in community-level associations (19s2-s16), social (24) and institutional trust (7-18), and others related to trust such as perceived corruption (114, 115) and social connections (25). Cultural factors is represented by collective value (68, 69), which is regarded as a main feature in East Asia, and ideas about political leadership (121, 122, 131, 133-135, 138, 139). Based on the analysis, they argued that social trust and entry in community-level associations had significant effect on political participation, especially behavior regarding election. Cultural factors influenced political participation indirectly; effect of social trust becomes on political participation becomes larger when people are less collectivistic or more embedded in Asian “tradition” of supporting morally upright political leaders.
Varying operations of social capital on democracy was also analyzed in Ikeda and Kobayashi (2007). They made the analysis out of the same variables used in Ikeda et. al. (2003), but here tested was whether cultural factors have effect on political participation on aggregate level, that is, cultural character in country/regional level, as well as personal level. The result verified the findings of the aforementioned study that the less collectivistic, or the more supportive for politically upright leaders, the more effective social trust becomes on participation in political activities.
Park and Shin (2005) discussed how democracy was perceived in Asian new democracies: Korea, Mongolia, the Philippines, Taiwan and Thailand. They first sorted out respondents by their perception of democracy, i.e. whether or not they were satisfied with it (98) and how they evaluate it (105-113). The result clarified that the largest number of respondents showed satisfaction and high evaluation to democracy. They also made analyses on relationship between the perception and attachment to democracy (101, 117), detachment form authoritarian regime (121-124), and commitment to democracy which was made up by combination of the two variables. According to their analyses, the largest number of respondents both showed satisfaction with their democracies and gave better assessment on current regime than previous non-democratic regime. Moreover, citizens in these countries support democracy and reject authoritarianism when they are not only satisfied with current democratic system, but also see the system is performing better than previous regime.
Shin (2007a) again argued the perception of democracy in the five emerging democracies. In his argument he made another index of perception of democracy (98-100), and the analysis assured the findings of the above-mentioned study. Those who were satisfied with their democracies and gave better assessment on current regime than previous non-democratic regime dominated the largest share in the respondents, and satisfaction and perceived better performance of current democratic system increases their support for democracy and rejection of authoritarianism.
Albritton and Bureekul (2005) focused on impacts of cultural socialization and interaction with
government in regards to support for democracy (98, 101, 103, 117-119), pluralist values (135-137, 145,146), regime legitimacy (130, 131, 133, 134) economic situation in country/region (1-3) and personal (4-6) level, perceived (114, 115) and witnessed (116) corruption and institutional trust. The result showed that cultural socialization had contradicting impact; modernization (64-71) influence negatively on interaction with government, while trust to others (24) did positively. An Interaction with government also produced differences in other interactions.
Tan and Wang (2007) examined whether or not younger generation in Asia was more proactive to democracy. First they made intergenerational comparison on pro-democratic variables such as democratic values (132-139), support for democracy (101, 103, 117-119), and traditional values (64-71), which showed that democratic values increased from older generation to younger generation as a whole. Then they analyzed effect of age on democratic values and support for democracy, finding that although age did have effect on pro-democratic variables, the effect reduced when other variables were included. They also observed that in East Asia, Support for Democracy in democratic societies is overall stronger than that in the non-democratic societies.
In Park and Lee (2007), the effect of association in democracy was tested. They made cross-national correlation analyses between the following items: membership in organization or group (19), civic virtue such as social trust (24), reciprocity (30 of the 2nd wave) and citizenship (152, 153 in the 2nd wave); democratic values and norms reflected in attachment to democracy (117, 118), detachment from authoritarianism (123, 124) support for political institutional pluralism (136, 137) and for rule of law (125, 145); and political activism such as political efficacy (127), political interest (50 in the 2nd wave), activities of voting (27), campaign (29, 30), contact with officials or organizations (73, 75-77) and protest (86-88 in the 2nd wave). From the analyses they found that most respondents in each country were not engaged in any of associations, regardless of the country and region. Moreover, association had little or did not have effect on civic virtue, nor did it promote democratic values or norms. It only turned out to have correlation with political activism in every country.
Chang and Chu (2007) focused on two conceptions of democracy (92 in the 2nd wave), i.e.
liberal democracy which regards electoral procedure or freedom of expression as essential to a democracy, and substantivist notion which places small income gap or satisfying basic necessities as an essence of it. They elucidated the significant effect on the conceptions of gender, education, political involvement (56) and detachment from traditionalism (64, 66, 69 in the 1st wave; 64 in the 2nd wave). Age and detachment from authoritarianism (121-123) proved insignificant, while effect of media exposure (57), they argued, might be absorbed in education. They also showed that the two conceptions made differences in support for democracy (101, 103, 117-119), but did not in evaluation of it (103, 104, 108, 115, 116 in the 2nd wave).
Huang et. al. (2007) assessed quality of democracy and explored its relationship with popular support for democracy and belief in liberal democratic values. They argued that quality of democracy had the following nine dimensions: i) Rule of Law (104, 113 in the 2nd wave); ii) Controlling Corruption (115 in the 1st wave, 120 in the 2nd wave); iii) Competition (43, 105, 114 in the 2nd wave); iv) Participation (27, 29, 30); v) Vertical Accountability (103, 106, 112 in the 2nd wave); vi) Horizontal Accountability (107, 115 in the 2nd wave); vii) Freedom (110, 111 in the 2nd wave); viii) Equality (108, 109 in the 2nd wave); and ix) Responsiveness (116 in the 2nd wave).
Their assessment revealed that most of respondents gave low evaluations on their democracy,
especially on rule of law, controlling corruption and horizontal accountability. Lower quality of
democracy led to less satisfaction with democracy (98), less popular support for democracy (103,
117-119) and less belief in liberal democratic values (125, 133-139, 145), according to their correlation analyses. They also regressed support for democracy (101, 103, 117, 118) on quality of democracy which were categorized into four dimensions, that is, rule of law (43, 104, 107, 112- 116, 120 in the 2nd wave), freedom, and equality and accountability (103 in the 2nd wave), as well as on political participation (27, 29, 30), economic condition in both country (2 in the 2nd wave) and personal (5 in the 2nd wave), democratic orientation (125, 133-139, 145), priority of democracy (119) and interest in politics (56). According to the result, quality of democracy, especially rule of law hold crucial effect on support for democracy.
Wu and Chu (2007) examined whether uneven income distribution affected satisfaction with democracy. They analyzed the effect on satisfaction with actual condition of democracy (98) and support for democracy (101, 103, 117-119) caused by income and subjective social status (SE9, SE9a, SE19 in the 2nd wave), Gini coefficient in each country/region, satisfaction with basic necessities (109 in the 2nd wave), assessment of present government (104), demand for liberal democracy (125, 133-137, 139, 145) and current economic condition (1, 4). From the analyses both higher lower income holder were found to be less satisfied with democratic performance than income holders, which means that income disparity accumulates dissatisfaction with democracy.
Nathan (2007) discussed how political and cultural values affected support for current regime in East Asia, where there are various types of regimes. In his discussion democratic values (132-139) and traditionalism (64-72 in the 1st wave, 61-65 in the 2nd wave) were used in order to operationalize the two values. Nathan made analyses of effect of those variable, as well as perceived regime performance in democracy (105-107, 112, 113) and policy execution (108-111), on detentions of support for current government (98, 101, 103, 117-119, 121-124, 130). He argued from his analyses that political and cultural values have effect more on respondents’ support for existing regime than performance variables, and of the two values democratic values was the more effective. Yet the effect was so complicated that Nathan left future task to solve the complexity.
In Shin (2007b) people’s reaction to democratization was focused on. In the study reaction to democratic change was classified into four categories, according to attachment to democracy (101, 103, 117) and detachment from authoritarian alternative (121-123): that is, hybrids; anti-authoritarians;
proto-democrats; and authentic democrats. Then the source of the different types of the reaction was analyzed, from the result of which they pointed out strong effect of attachment to Confucianism and experience of democratic regime.
The ABS, as stated above, has been providing data and studies on democracy in Asia. Since democratic change is still a critical issue in Asia where diverse types of regime exist, the data and the finding of the ABS will produce various guidelines for the future of the area.
However, we should be aware of the danger in the interpretation of “traditionalism”. The ABS covers variety of East and Southeast Asian countries and regions, which are different from each other in regime. And so are they in terms of tradition. The ABS covers the area where variety of religions is believed (Buddhism, Islam, Catholic, etc.) and where there are diverse way of living from farming to nomadic pastoralism. This means that there is no unified “tradition” in the area where the ABS is conducted, and careful examination is required when we are to deal with “traditionalism” or cultural factors in the ABS.
6. The East Asia Value Survey
(12)The Institute of Statistical Mathematics has been performing various cross-national comparative
researches whose subject is mainly national character and culture, since it started the survey of
Hawaiian Nikkei (Japanese-American) people in 1971. The East Asia Value Survey, which is going to be discussed here, is one of such surveys, conducted in Japan, South Korea, Taiwan, China (Beijing, Shanghai and Hong Kong) and Singapore. The survey is based on the criticism to the WVS and the idea that “Survey in Asia should be done from Asian viewpoint” (Yoshino, 2005a:143). The focus of the East Asia Value Survey is on the structure of consciousness and sense of values, especially “sense of trust”. Table 8 shows the period of survey, the age of targeted people, sample size and the number of the actual respondents.
There have already been analyses using the result of the East Asia Value Survey, mainly done by researchers of the Institute of Statistical Mathematics.
Table 10 Outline of the East Asia Value Survey
Japanese aged 20 or over Two-stage stratified random sampling 1,200 787(65.6%)
South Korean aged 20 or over Quota - 1,006
Taiwanese aged 20 or over Three-stage stratified random sampling1) 1,800 734
Adults aged 18 or over Multi-stage stratified random sampling 3,6332) 1,062 (29.2%) Adults aged 18 or over Multi-stage stratified random sampling 1,915 1,052 (54.9%) Residents in Hong Kong Aged 18 or over,
living in China including Hong Kong, Macao and Taiwan more than 5 years
Multi-stage stratified random sampling 3,000 1,057
Singaporean aged 20 or over Two-stage stratified random sampling - 1037 (about 20%)
Note: 1) Confirmed by Dr. Su-Hao Tu, Assistant Research Fellow of the Office of Survey Research, Academia Sinica.
2) Including supplementary sample.
Source: East Asia Value Survey website, Yoshino (2006).
China (Beijing) Countries and
regions
China (Shanghai)
Hong Kong
Singapore
Respondents (response rate) Sample
Sampling method size Target population
Japan South Korea Taiwan