Secular Changes in Craniofacial Morphology during the Edo Period of Japan
Kazuhiro Sakaue
Department of Anthropology, National Museum of Nature and Science 4–1–1 Amakubo, Tsukuba-city, Ibaraki Prefecture 300–0005, Japan
Telephone: +81–29–851–8187, Fax: +81–29–853–8998 E-mail: k-sakaue@kahaku.go.jp
Abstract Although significant differences in craniofacial morphology can be recognized among the townsmen, the lower-middle-class samurai, and the higher-class samurai (including shogunʼs wives and territorial lords) from the middle-late Edo period (Sakaue, 2012), there has been no study on secular changes in craniofacial morphology during the Edo era. The purpose of this study is to investigate the morphological differences in the skull between the early Edo period and the middle-late Edo period. The subjects included 44 males and 22 females from the early Edo period, and 181 males and 118 females from the middle-late Edo period. A total of 67 measurements were examined, and multivariate analyses were employed to test the significant differences between the early Edo period skulls and the middle-late Edo period skulls. The results showed that the cranial morphology of the early Edo period was similar to that of the middle-late Edo period townsmen, but apparently different from that of the middle-late Edo period samurai of both sexes. The early Edo period subjects had somewhat stouter mandibles than those of the middle-late Edo period male townsmen and relatively larger skulls than those of the middle-late Edo period female towns- men. Thus it can be said that secular changes in cranial morphology occurred during the Edo period.
Key words : Edo, Skull, Craniofacial morphology, Secular change
Introduction
In a previous study, group differences in cra- niofacial morphology could be recognized statis- tically between the skeletal remains buried in cir- cular wooden coffins “Hayaoke” and those buried in ceramic coffins “Kamekan” during the middle to late Edo period (from the late 17th century to the late 19th century) (Sakaue, 2012). Because the “Hayaoke” was utilized by the townsmen and the “Kamekan” by the lower-middle-class samu- rai, it could be said that oneʼs craniofacial mor- phology was affected by oneʼs social class among the Edo period people. These differences among social classes can be investigated by using the skeletal remains after the late 17th century because the “Kamekan” burial style commenced after that time (Tanigawa, 2004).
In order to answer the question of why these
morphological changes occurred, it will be help- ful to know the time when the people in the samurai class acquired the unique features of the skull. However, there has been no study on secular changes in craniofacial morphology during the Edo era. The large number of skeletal remains newly excavated from the early Edo period (the 17th century) makes it presently possible to investigate this secular change.
Thus, the purpose of this study was to investi- gate the morphological differences in the skull between the early Edo period and the middle-late Edo period.
Materials and Methods
The materials of this study were composed of
human skeletal remains excavated from three
cemetery sites located in Tokyo (Table 1). The
excavation results, historical records, and old maps of the Edo indicated that all temples of these cemeteries had been relocated to the other places during the 17
thcentury. Although most of the skeletal remains excavated at these cemeter- ies are thought to be those of townsmen, some people of the samurai class may have been also buried at these cemeteries judging from epitaphs and burial accessories, such as weapons (Toritu Hitotsubashi koukou Iseki Chosa-dan, 1985;
Hatchobori Sanchome iseki (dainiji) Chosa-kai, 2003).
The criteria for selecting the samples were as follows: 1) complete closure of the sphenooccipi- tal synchondrosis; 2) at least one remaining tooth or socket of the maxillary central incisors; 3) at least one remaining tooth or socket of molars for each maxilla and mandible; 4) no contamination by another individual or, if any, restricted con- tamination easily identifiable of another individ- ual; and 5) almost a complete skull without deformation or missing values for all measure- ments.
The sexual assessment of individuals was basi- cally carried out with craniofacial traits (Sakaue and Adachi, 2009). When these traits were insuf- ficient for identification of the sex, some pelvic features, such as a greater sciatic notch, ventral arc, or ischiopubic proportion, were used (Bru- zek, 2002). A total of 67 measurements were examined (Table 2), and their definitions fol- lowed those of Martinʼs measurements (Baba, 1991). When both sides were available, the left side was basically measured.
Statistical analyses were performed as follows:
1) The Shapiro-Wilk test was conducted for all variables in each group in order to test for any
deviations from a normal distribution; 2) In order to compare the relative significance of differ- ences between the early Edo period group and the middle-late “Hayaoke” Edo period group or between the early Edo period group and the mid- dle-late Edo “Kamekan” period groups, the Dun- nettʼs tests were conducted for variables of nor- mal distributions, or the Steelʼs tests were carried out for variables of doubtful normal distributions as a multiple comparison procedure (Nagata and Yoshida, 1997) ; 3) Forty-seven variables which had been chosen in the previous study (Sakaue, 2012) were also used for multivariate analysis in this study. In addition, Wilksʼ lambdas were cal- culated and their statistical significances were tested in order to test the differences of these groups for a combination of dependent variables;
4) The plot of factor scores were made in order to elucidate group differences in cranial variation of the early Edo period people and the middle- late Edo period people. The principal component scores of the early Edo period people were calcu- lated by the component coefficients resulting from the principal component analysis on corre- lation matrix in the middle-late Edo period sam- ples (Sakaue, 2012); and 5) The principal com- ponent analysis on correlation matrix was carried out with 12 variables of the mandibular bone, which showed distinct differences between the early Edo period people and the middle-late Edo period people of both sexes. This analysis was conducted on the middle-late Edo period people, and then the scores of the early Edo period peo- ple were calculated by its component coeffi- cients. All statistical analyses were carried out with SYSTAT 13.
Table 1. Sites and sample sizes used in this study.
site location period Male Female
Early Edo
Hatchobori-Sanchyome (1st) Chuou-ku the last 16th A.D. to the middle17th A.D. 2 2 Hatchobori-Sanchyome (2nd) Chuou-ku the last 16th A.D. to the middle17th A.D. 15 9 Shitaya-Dohochyo Taitou-ku the last 16th A.D. to the late 17th A.D. 1 4 Hitotsubashi Senior High School Chiyoda-ku the last 16th A.D. to the late 17th A.D. 26 7
sum 44 22
Middle-late Edo 181 118
Table. 2 Summary statistics of all measurements and Indexes
Martin
No. Variables
Male Female
Early (N=44)
Middle-late (Hayaoke)
(N=131)
Middle-late (Kamekan) (N=50)
Early (N=22)
Middle-late (Hayaoke) (N=70)
Middle-late (Kamekan) (N=48) Mean S.D. Test Mean S.D. Test Mean S.D. Mean S.D. Test Mean S.D. Test Mean S.D.
1 Maximum length 181.8 6.7 181.5 6.4 ≫177.4 6.1 174.5 4.7 172.3 6.7 ≫ 169.1 5.5
8 Maximum breadth 138.3 5.1 138.5 4.5 ≪141.3 5.3 135.0 5.8 133.2 5.7 135.3 4.4
17 Basion-Bregma height 137.1 4.9 136.2 4.7 138.0 5.7 129.5 4.3 130.6 3.9 < 132.0 4.0
9 Least frontal breadth 93.4 4.7 93.5 4.2 94.4 4.9 90.5 3.8 89.3 4.8 89.5 3.3
10 Maximum frontal breadth 115.4 3.9 114.7 4.2 < 117.2 5.4 111.8 4.7 > 109.4 4.8 110.1 3.9
5 Basion-Nasion length 101.9 3.5 101.8 4.5 > 99.9 4.2 95.3 3.0 94.9 3.7 95.1 3.6
11 Biauricular breadth 125.3 4.4 126.0 4.3 125.0 4.3 120.2 4.7 119.2 4.4 118.8 4.6 12 Biasterionic breadth 108.9 3.9 108.5 4.6 108.2 5.2 106.7 4.0 > 104.4 4.0 > 104.2 3.8
13 Mastoid width 103.3 4.5 103.2 4.7 102.2 4.8 98.3 5.0 97.2 5.9 96.4 4.3
40 Basion-Prosthion length 98.7 4.6 99.3 4.9 > 96.0 6.0 93.8 4.2 94.4 5.3 92.7 3.8 14 Minimum cranial breadth 67.9 3.0 68.7 3.5 ≪ 69.7 4.0 65.0 2.5 64.1 3.3 65.1 3.7
7 Foramen magnum length 35.6 2.1 35.8 2.2 35.3 2.4 33.7 1.9 33.7 2.0 33.7 2.0
16 Foramen magnum breadth 29.2 1.6 29.6 2.0 29.9 2.2 28.5 2.0 28.3 1.7 28.1 1.9
23Horizontal circumference 516.5 16.6 518.2 13.9 514.9 13.0 502.7 12.8 > 494.6 14.0 ≫ 491.1 11.9 24 Transverse arc 313.1 9.5 312.8 9.4 ≪321.0 11.7 301.8 10.7 301.7 11.3 304.6 9.9 26 Frontal sagittal arc 127.5 5.6 125.9 5.7 126.9 5.3 121.6 5.0 121.3 5.9 119.8 5.7 27 Parietal sagittal arc 126.2 6.9 126.3 8.1 125.7 8.3 120.6 8.6 120.9 7.1 119.8 11.1 28 Occipital sagittal arc 116.6 6.1 118.2 8.3 117.7 5.4 116.4 8.5 115.1 8.1 113.9 6.6 25 Total sagittal arc 370.3 12.2 370.4 13.3 370.2 12.5 358.6 12.3 357.3 12.9 353.4 13.0 29 Frontal sagittal chord 111.7 4.3 110.6 4.4 110.8 4.4 106.6 3.4 106.3 4.2 105.6 4.2 30 Parietal sagittal chord 113.2 5.5 112.7 6.4 112.2 6.5 109.9 6.0 108.9 5.7 > 106.5 7.0
31 Occipital sagittal chord 98.3 4.2 98.4 5.3 99.3 4.1 97.5 5.3 96.8 5.4 97.6 4.2
43 Outer biorbital breadth 104.6 3.6 104.7 4.0 104.0 4.0 100.5 3.0 99.2 3.7 > 98.7 3.0
43a Bifrontal breadth 97.5 3.8 97.3 4.0 96.8 3.7 93.4 2.8 92.3 3.6 92.1 2.8
Nasion subtence (calculated) 14.5 2.1 14.1 2.4 14.5 3.1 12.7 1.4 12.5 2.3 13.1 2.3
44 Biorbital breadth 98.5 3.7 97.9 3.8 97.3 3.7 95.3 3.1 > 93.6 3.5 ≫ 92.8 3.1
45Bizygomatic breadth 134.8 4.3 134.9 4.5 133.1 5.1 126.6 4.2 125.0 3.8 > 123.8 4.6
46Bimaxillary breadth (zm) 99.8 5.2 99.9 4.7 > 97.3 5.0 94.7 4.1 93.3 3.8 > 92.2 4.8
46bBimaxillary breadth (zm:a) 100.3 5.4 99.9 4.7 > 97.6 4.9 95.2 4.7 94.1 4.2 92.7 4.9
Subspinale subtence (calculated) 22.3 2.9 22.7 3.3 < 23.9 2.9 19.5 2.8 20.5 3.0 ≪ 22.0 2.3
48 Upper facial height 71.9 3.8 72.2 4.2 < 73.7 3.3 66.4 4.1 66.7 4.2 < 68.5 3.4
48H Upper facial height (Howells) 68.1 3.5 68.3 4.0 < 69.9 3.2 62.9 3.9 63.4 4.4 < 65.1 3.6
48d Malar height 23.7 2.4 24.3 2.5 23.7 2.5 22.1 1.9 22.0 2.0 21.9 1.9
49a Interorbital breadth 21.2 1.8 21.0 2.0 20.7 2.1 20.8 1.7 20.3 2.1 > 19.7 2.0
50 Anterior interorbital breadth 16.9 2.1 16.9 2.1 16.9 2.1 16.8 1.7 16.4 1.9 16.3 1.7
51 Orbital breadth 43.0 1.9 43.3 2.0 43.4 1.8 41.1 1.8 40.8 1.9 41.2 1.5
52 Orbital height 33.9 1.9 34.1 1.9 ≪ 35.6 1.9 33.1 1.9 33.3 1.8 ≪ 34.6 1.7
54 nasal breadth 24.9 1.6 < 25.6 1.9 24.5 1.7 24.2 1.3 24.4 1.6 24.5 1.9
55 nasal height 51.9 2.8 52.3 3.1 ≪ 53.6 2.6 47.5 2.9 48.5 2.7 < 49.4 2.6
55(1) Height of piriform aperture 30.2 2.9 29.6 2.6 30.7 2.5 26.1 2.4 26.5 2.2 < 27.5 2.7
56 Length of nasal bone 23.8 3.1 24.4 2.8 24.9 3.0 22.4 2.4 22.6 2.5 22.9 2.8
57(1) Maximum breadth of nasal bone 17.9 1.8 18.2 1.9 17.7 1.6 17.5 1.5 16.9 1.6 17.1 1.9
57 Least nasal breadth 7.1 1.9 7.3 1.6 7.2 2.0 7.6 1.6 7.0 1.9 7.8 1.6
Nasal subtense (calculated) 2.2 0.9 2.5 1.0 < 2.6 1.1 1.8 0.9 1.8 0.9 < 2.3 0.9
60 External palate length 51.6 3.7 52.3 3.0 50.4 3.5 49.0 2.5 50.3 3.6 48.9 2.3
61 External palate breadth 64.9 3.8 65.7 3.8 65.5 3.8 61.5 3.8 61.4 3.4 61.5 3.6
62 Internal palate length 44.6 2.7 45.5 2.7 44.7 2.7 42.4 2.5 < 44.0 2.7 43.4 2.1
63 Internal palate breadth 40.7 2.7 40.7 3.3 > 39.5 3.3 39.4 3.0 38.1 2.6 38.6 3.0
66 Bigonial breadth 102.6 5.8 >100.2 5.8 ≫ 98.9 5.9 95.2 5.4 93.8 5.6 ≫ 90.9 4.5
68 Projective length of mandible 72.1 4.9 70.7 5.0 69.8 4.9 67.0 3.5 66.2 4.3 65.6 4.3 65 Bicondylar breadth 120.7 5.5 121.6 5.7 120.8 5.8 116.1 5.1 113.8 5.2 ≫ 110.8 5.8
65(1) Bicoronoid breadth 97.3 5.5 97.4 4.8 98.1 5.2 94.4 4.1 ≫ 90.5 4.5 ≫ 90.5 5.0
67 Bimental breadth 47.7 3.0 47.5 2.5 47.4 2.5 46.5 2.7 45.8 2.2 45.2 2.0
69 Height of mandibular symphysis 35.0 3.6 35.6 3.2 36.0 3.1 30.5 3.4 31.6 3.2 < 32.2 2.8
69(1) Mandibular body height 31.4 2.3 31.6 2.7 32.1 2.4 28.9 2.8 28.7 2.5 28.9 2.1
69(2) Mandibular body height at M2 27.0 2.0 26.8 2.5 26.5 2.7 25.1 2.3 24.8 2.2 24.3 2.0 69(3) Mandibular body breadth 13.8 1.5 ≫ 13.2 1.4 ≫ 12.5 1.4 13.3 1.4 12.7 1.2 ≫ 12.2 1.1 69b Mandibular body breadth at M2 18.0 1.5 ≫ 17.1 1.6 ≫ 16.6 1.3 17.1 1.1 17.0 1.4 > 16.3 1.5 70 Height of mandibular ramus 63.6 4.9 < 64.9 4.4 64.8 4.3 57.9 3.4 57.6 3.9 57.6 3.9 71a Minimum width of ramus 34.7 2.9 34.7 3.3 ≫ 32.4 2.6 33.2 2.2 33.1 2.7 ≫ 31.2 2.4 71(1) Condylo-cornoid breadth 35.5 3.9 36.2 3.2 > 33.4 3.9 32.8 2.4 < 34.1 3.0 32.7 2.9 Mandibular condyle breadth 20.2 1.8 20.7 2.0 20.6 1.9 18.5 1.8 18.5 1.7 17.9 1.4
Results
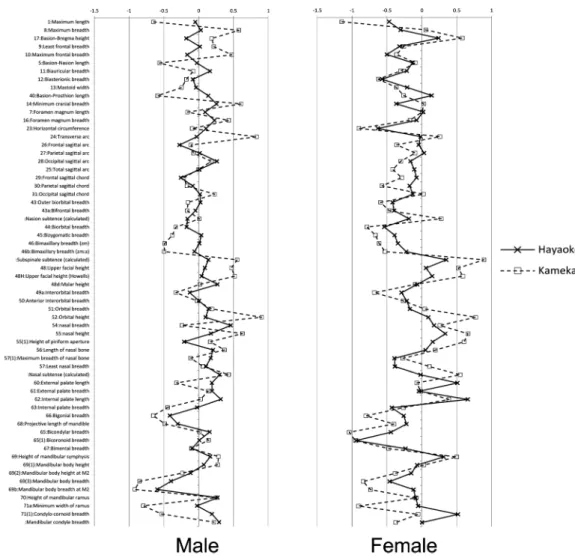
Table 2 shows the descriptive statistics of cra- nial variables of the early Edo period people, the middle-late Edo period people buried in “Haya- oke” (the townsmen), and the middle-late Edo period people buried in “Kamekan” (the lower- middle-class samurai). Figure 1 shows the rela- tive deviation curve of all liner variables based on means of the early Edo period people. In
males, only 5 variables showed statistically sig- nificant differences between the early Edo period people and the middle-late “Hayaoke” Edo period people, and 4 of the 5 variables were related to the mandible (bigonial breadth, two mandibular body breadths, and height of mandibular ramus).
On the contrary, there are 21 variables showing statistically significant differences between the early Edo period people and the middle-late
“Kamekan” Edo period people. These variables
Table. 2 Continued
Martin
No. Variables
Male Female
Early (N=44)
Middle-late (Hayaoke)
(N=131)
Middle-late (Kamekan) (N=50)
Early (N=22)
Middle-late (Hayaoke) (N=70)
Middle-late (Kamekan) (N=48) Mean S.D. Test Mean S.D. Test Mean S.D. Mean S.D. Test Mean S.D. Test Mean S.D.
8/1 Cranial index 0.76 0.04 0.76 0.03 ≪ 0.80 0.04 0.77 0.03 0.77 0.05 ≪ 0.80 0.03
17/1 Index 0.75 0.03 0.75 0.03 ≪ 0.78 0.03 0.74 0.03 < 0.76 0.03 ≪ 0.78 0.03
17/8 Index 0.99 0.04 0.98 0.04 0.98 0.04 0.96 0.04 0.98 0.05 0.98 0.03
9/10 Index 0.81 0.04 0.82 0.03 0.81 0.03 0.81 0.03 0.82 0.04 0.81 0.03
9/8 Index 0.68 0.04 0.68 0.03 0.67 0.04 0.67 0.03 0.67 0.04 0.66 0.03
8/12 Index 1.27 0.06 1.28 0.05 ≪ 1.31 0.06 1.27 0.06 1.28 0.06 < 1.30 0.05
40/5 Index 0.97 0.04 0.98 0.04 0.96 0.05 0.98 0.04 0.99 0.04 0.98 0.03
16/7 Index 0.82 0.06 0.83 0.06 < 0.85 0.06 0.85 0.05 0.84 0.05 0.84 0.05
27/26 Index 0.99 0.06 1.00 0.07 0.99 0.07 0.99 0.08 1.00 0.07 1.00 0.09
28/26 Index 0.92 0.05 0.94 0.08 0.93 0.06 0.96 0.07 0.95 0.08 0.95 0.08
29/26 Index 0.88 0.01 0.88 0.02 0.87 0.02 0.88 0.01 0.88 0.02 0.88 0.02
30/27 Index 0.90 0.02 0.89 0.02 0.89 0.03 0.91 0.05 0.90 0.02 0.89 0.04
31/28 Index 0.84 0.02 > 0.83 0.03 0.84 0.02 0.84 0.02 0.84 0.03 ≪ 0.86 0.02
+17)/3(1+8Modulus 152.39 3.71 152.03 3.54 152.24 4.09 146.32 3.52 145.35 3.59 145.49 3.37 Frontal index of flatness 0.15 0.02 0.14 0.02 0.15 0.03 0.14 0.01 0.13 0.02 0.14 0.02 Zygomatic index of flatness 0.22 0.03 0.23 0.03 ≪ 0.25 0.03 0.21 0.03 0.22 0.03 ≪ 0.24 0.03
43/8 Index 0.76 0.04 0.76 0.03 ≫ 0.74 0.03 0.75 0.03 0.75 0.04 > 0.73 0.03
46/45 Index 0.74 0.03 0.74 0.03 0.73 0.03 0.75 0.03 0.75 0.03 0.74 0.03
48/45 Index 0.53 0.03 0.54 0.03 ≪ 0.55 0.03 0.52 0.04 0.53 0.03 ≪ 0.55 0.03
48/46 Index 0.72 0.04 0.72 0.04 ≪ 0.76 0.04 0.70 0.06 0.72 0.05 ≪ 0.75 0.05
9/45 Index 0.69 0.04 0.69 0.03 < 0.71 0.03 0.72 0.03 0.71 0.03 0.72 0.03
45/8 Index 0.98 0.04 0.97 0.04 ≫ 0.94 0.04 0.94 0.04 0.94 0.04 > 0.92 0.03
50/44 Index 0.17 0.02 0.17 0.02 0.17 0.02 0.18 0.02 0.17 0.02 0.18 0.02
52/51 Index 0.79 0.05 0.79 0.04 ≪ 0.82 0.05 0.81 0.05 0.82 0.04 < 0.84 0.05
54/55 Index 0.48 0.04 0.49 0.04 ≫ 0.46 0.03 0.51 0.03 0.51 0.04 > 0.50 0.04
54/55(1) Index 0.83 0.10 < 0.87 0.10 0.80 0.08 0.93 0.08 0.93 0.09 0.90 0.13
Simotic index 0.32 0.13 0.34 0.12 < 0.37 0.13 0.23 0.11 0.25 0.12 < 0.29 0.11
57/57(1) Index 0.40 0.10 0.40 0.09 0.41 0.11 0.44 0.10 0.41 0.10 0.46 0.09
61/60 Index 1.26 0.11 1.26 0.08 1.30 0.10 1.26 0.10 1.22 0.09 1.26 0.09
63/62 Index 0.92 0.08 0.90 0.08 > 0.87 0.16 0.93 0.09 ≫ 0.87 0.07 0.89 0.08
68/65 Index 0.60 0.05 > 0.58 0.04 0.58 0.05 0.58 0.04 0.58 0.05 0.59 0.04
69(3)/
69(1)Index 0.44 0.06 > 0.42 0.05 ≫ 0.39 0.05 0.46 0.05 0.44 0.04 ≫ 0.42 0.04
69b/
69(2)Index 0.67 0.06 > 0.64 0.07 ≫ 0.63 0.08 0.69 0.08 0.69 0.07 0.68 0.09
71/70 Index 0.55 0.06 0.54 0.05 ≫ 0.50 0.05 0.57 0.05 0.58 0.06 > 0.54 0.05
72Total profile angle 83.6 3.2 83.3 3.1 84.4 3.6 82.9 2.8 > 81.3 3.4 82.7 2.5
73 Nasal prof ile angle 93.0 2.8 92.4 3.1 92.8 4.0 91.8 2.3 ≫ 89.1 5.8 91.8 3.0
74Alveolar profile angle 66.4 5.1 64.8 6.3 67.5 6.7 63.9 4.7 62.8 6.2 64.3 5.2
75Profile angle of nasal bone 64.8 5.7 63.4 6.0 > 62.2 5.5 68.4 4.9 ≫ 65.1 5.1 ≫ 64.7 5.0 79 Mandibular angle 124.0 6.2 124.5 6.9 < 126.5 6.9 123.7 4.9 < 126.5 6.8 ≪ 129.6 7.2
“<” and “<<” mean the results of the Dunnettʼs test or the Steelʼs test for multiple comparison between “Early Edo” group and “Hayaoke” or “Kamekan” respectively
“<” means P<0.05 and “<<” means P<0.01 respectively.
The means with under bar indicate that the normal distribution of its variable is denied with the Sapiro-Wilk test.
The signs of inequality with under bar indicate that these tests were performed by the Steelʼs test.
were almost the same as those showing statisti- cally significant differences between the “Haya- oke” group and “Kamekan” group (Sakaue, 2012). In females, 7 variables (maximum frontal breadth, biasteric breadth, horizontal circumfer- ence, biorbital breadth, internal palate length, bicoronoid breadth, and condylo-cornoid breadth) showed statistically significant differ- ences between the early Edo period people and the middle-late “Hayaoke” Edo period people. As seen in Figure 1, many variables of the early Edo period people (47 out of 62 variables) tend to be larger than those of the middle-late “Hayaoke”
Edo period females. Likewise in males, the vari- ables showing statistically significant differences
between the early Edo period people and the middle-late “Kamekan” Edo period people resembled those between the “Hayaoke” group and “Kamekan” group.
The Wilksʼ lambdas and their probabilities are in Table 3. Statistically significant differences of the 47 variables existed between the early Edo
Fig. 1. The relative deviation curve of all liner variables based on means of the early Edo period.
Table 3. Results of Wilkʼs lambda between the early Edo and the middle-late “Hayaoke” Edo or the middle-late “Kamekan” Edo
Male Female
Hayaoke Kamekan Hayaoke Kamekan Wilksʼ λ 0.586 0.270 0.406 0.113
p-Value 0.002 0.001 0.130 0.000
period people and the middle-late “Hayaoke”
Edo period males, and between the early Edo period people and the middle-late “Kamekan”
Edo period people of both sexes, but there were no statistically significant differences between the early Edo period people and the middle-late
“Hayaoke” Edo period females.
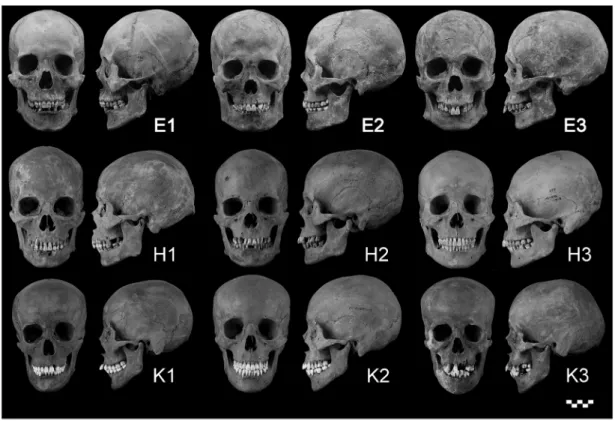
The scatter plots of the second and third prin- cipal component scores are presented in Figure 2 for males and Figure 3 for females. In this analy- sis, the second principal component was inter- preted as the relationship among calvarial breadth, orbital height, and sagittal diameter of the facial structure, and the third principal com- ponent was interpreted as the relationship among facial flatness and the heights of the orbit and nose (Sakaue, 2012). The letters in these plots correspond to the photographs in Figure 4 for males and Figure 5 for females. In these plots,
most of the early Edo period people are scattered within the standard deviation ellipse of the middle-late “Hayaoke” Edo period people of both sexes. Therefore, it was difficult to classify the early Edo period people and the middle- late “Hayaoke” Edo period people with these char- acteristics; conversely, the “Hayaoke” group, the
“Kamekan” group, and the higher-class samurai group (including shogunʼs wives “Ooku” and ter- ritorial lords “Daimyo”) of the middle-late Edo period were easily classifiable.
Table 4 shows the results of the principal com- ponent analysis with 12 mandibular variables of middle-late Edo period males. The first principal component, accounting for 29.1% of the total variance, has relatively high loading values for all measurements. Therefore, this component can be interpreted as indicating total mandibular size.
The second principal component can be inter- preted as indicating the relationship between mandibular breadth and mandibular size in sagit-
Fig. 2. Plot of the second and third principal com- ponent scores of males.
The ellipses represent the 68.27% confidence interval for the early Edo period (thick line), the middle-late “Hayaoke” Edo period (thin line), and the middle-late “Kamekan” Edo period (dash line). The letters in the plot correspond to those of Figure 4. “E”, “H”, and “K” correspond to “Early Edo”, “Hayaoke”, and “Kamekan”, respectively. The measurements of the higher- class samurai (Daimyo) were done with elabo- rative casts (Sakaue, 2012).
Fig. 3. Plot of the second and third principal com- ponent scores of females.
The ellipses represent the 68.27% confidence interval for the early Edo period (thick line), the middle-late “Hayaoke” Edo period (thin line), and the middle-late “Kamekan” Edo period (dash line). The letters in the plot correspond to those of Figure 5. The measurements of the higher-class samurai (Ooku) were done with elaborative casts (Sakaue, 2012).
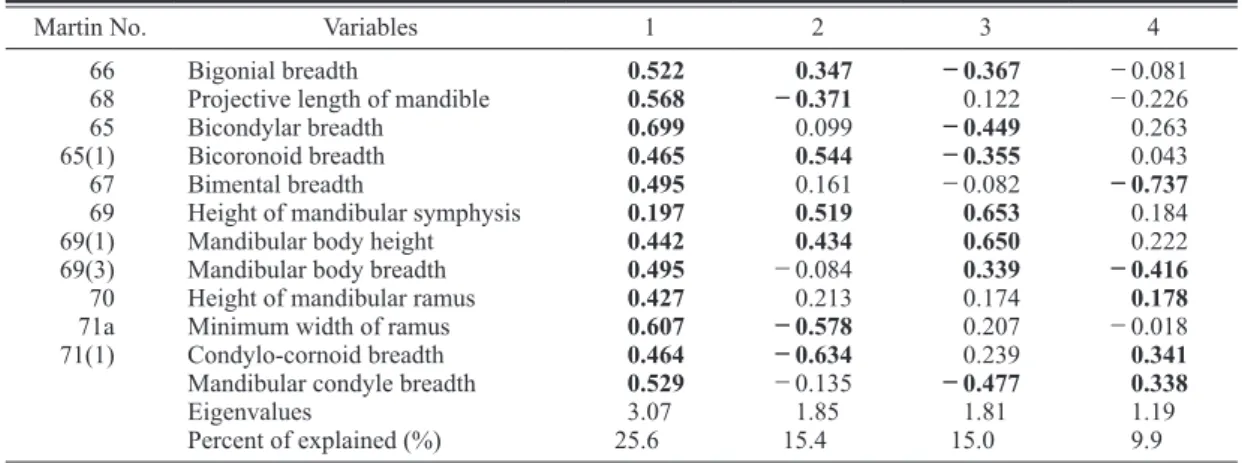
tal direction. The third principal component can be interpreted as mandibular body size. Table 5 shows the results of the principal component analysis with 12 mandibular variables of middle- late Edo period females. As in males, the first principal component can be seen as the total size of the mandible. For the second principal compo- nent, the breadth between coronoid processes correlates with the variables mandibular body height and sagittal diameter of the mandible. The third principal component can be interpreted as indicating the relationship between mandibular body size and mandibular breadth.
The scatter plots of the first and third principal component scores of mandibular variables are presented in Figure 6 for males and Figure 7 for females. Component scores of the early Edo period people were calculated by their coeffi- cients. In these plots, the distributions of the
samples of each group may indicate the morpho- logical cline from the early Edo period speci- mens to the “higher class” specimens (“star” in these plots) with some overlapping in both sexes.
This result indicates that the whole size of the mandible and mandibular body size may show secular changes from the early Edo period to the middle-late Edo period.
Discussion
This study revealed that the craniofacial mor- phology of the early Edo period is similar to that of the middle-late “Hayaoke” Edo period, but apparently different from that of the middle-late
“Kamekan” Edo period in both sexes. In addition, the early Edo period people had somewhat stouter mandibles than the middle-late “Haya- oke” Edo period males, and the early Edo period
Fig. 4. Male examples of each group. The letters correspond to those of Figure 1. “E” corresponds to early Edo period, “H” corresponds to middle-late “Hayaoke” Edo period, and “K” corresponds to middle-late “Kamekan”
Edo period. The numbers after letters within ellipses correspond to the following: “1” is “having features of a samurai; “2” is “the closest to the centroid of ellipse”; “3” is “having features of a townsman”
people had relatively larger skulls than the middle- late “Hayaoke” Edo period females. Thus it can be said that secular changes in cranial morphol-
ogy occurred during the Edo period.
It is interesting that craniofacial morphology can change during such a short period of time.
Table 4. Results of princiapal component analysis with 12 mandibular variables of the middle-late Edo male.
Martin No. Variables 1 2 3 4
66 Bigonial breadth 0.495 0.385 0.276 0.277
68 Projective length of mandible 0.609 −0.220 −0.057 0.037
65 Bicondylar breadth 0.620 0.518 0.103 −0.228
65(1) Bicoronoid breadth 0.406 0.725 −0.048 0.152
67 Bimental breadth 0.581 0.085 0.136 0.598
69 Height of mandibular symphysis 0.410 −0.202 −0.728 0.263
69(1) Mandibular body height 0.531 −0.228 −0.658 0.105
69(3) Mandibular body breadth 0.420 −0.374 0.474 0.340
70 Height of mandibular ramus 0.523 0.032 −0.252 −0.376
71a Minimum width of ramus 0.684 −0.443 0.331 −0.066
71(1) Condylo-cornoid breadth 0.506 −0.501 0.237 −0.386
Mandibular condyle breadth 0.601 0.298 0.014 −0.495
Eigenvalues 3.49 1.77 1.53 1.25
Percent of explained (%) 29.1 14.7 12.7 10.4
A bold number means its loading score is greater than 0.3
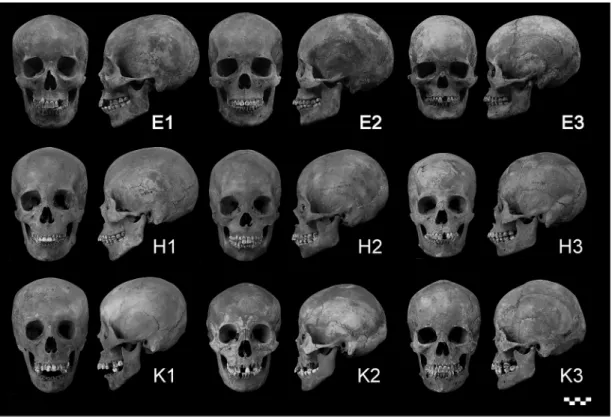
Fig. 5. Female examples of each group. The letters correspond to those of Figure 1. “E” corresponds to early Edo period, “H” corresponds to middle-late “Hayaoke” Edo period, and “K” corresponds to middle-late “Kamekan”
Edo period.
The numbers after letters within ellipses correspond to the following: “1” is “having features of a samurai; “2”
is “the closest to the centroid of ellipse”; “3” is “having features of a townsman”
During the 17th century, Edo city underwent drastic changes in terms economics, logistics, labor characteristics, culture, and demographics (Kito, 2010). These changes affected the life- styles of the common people, which might have led to variations in the morphological structure of the mandible and cranium among the Edo people.
It is questionable whether the morphological differences between the early Edo period and the middle-late “Kamekan” Edo period can be regarded as secular change. These differences may only reflect differences in social class, and it is difficult to determine what social class a per- son of the early Edo period belonged to. Unfortu- nately, there is presently no reliable way to deter-
Table 5. Results of princiapal component analysis with 12 mandibular variables of the middle-late Edo female.
Martin No. Variables 1 2 3 4
66 Bigonial breadth 0.522 0.347 −0.367 −0.081
68 Projective length of mandible 0.568 −0.371 0.122 −0.226
65 Bicondylar breadth 0.699 0.099 −0.449 0.263
65(1) Bicoronoid breadth 0.465 0.544 −0.355 0.043
67 Bimental breadth 0.495 0.161 −0.082 −0.737
69 Height of mandibular symphysis 0.197 0.519 0.653 0.184
69(1) Mandibular body height 0.442 0.434 0.650 0.222
69(3) Mandibular body breadth 0.495 −0.084 0.339 −0.416
70 Height of mandibular ramus 0.427 0.213 0.174 0.178
71a Minimum width of ramus 0.607 −0.578 0.207 −0.018
71(1) Condylo-cornoid breadth 0.464 −0.634 0.239 0.341
Mandibular condyle breadth 0.529 −0.135 −0.477 0.338
Eigenvalues 3.07 1.85 1.81 1.19
Percent of explained (%) 25.6 15.4 15.0 9.9
A bold number means its loading score is greater than 0.3
Fig. 6. Plot of the first and third principal compo- nent scores of male mandible.
The ellipses represent the 68.27% confidence interval for the early Edo period (thick line), the middle-late “Hayaoke” Edo period (thin line), and the middle-late “Kamekan” Edo period (dash line).
Fig. 7. Plot of the first and third principal compo- nent scores of female mandible.
The ellipses represent the 68.27% confidence interval for the early Edo period (thick line), the middle-late “Hayaoke” Edo period (thin line), and the middle-late “Kamekan” Edo period (dash line).
mine the social class from the burial method or accessories of the early Edo period. The social status of the temple where the cemetery is located might be helpful in roughly estimating the social class of the buried people at a particu- lar archaeological site. More samples and a new method for determining social class are needed in future studies.
Acknowledgement
I wish to thank Dr. K. Hirata, Professor of the Department of Anatomy, St. Marianna University School of Medicine, for kindly permitted us to study the skeletal remains. I wish to express my sincere gratitude to Dr. Y. Mizoguchi, Director of the Department of Anthropology, the National Museum of Nature and Science, and Dr. Sawada (St. Marianna University School of Medicine) for their many helpful suggestions in this study.
My sincere thanks are due to Ms. M.
Kajigayama, Ms. A. Nakatuka (The National Museum of Nature and Science), and H. Koi- zumi (Tokyo Metropolitan Board of Education) for their valuable advice. This research is sup- ported by JSPS KAKENHI Grand Number 23370102.
References
Baba H. (1991) Anthropology. Additional volume 1, II:
Osteometry. Yuzankaku, Tokyo (in Japanese).
Bruzek J. (2002) A method for visual determination of sex using the human hip bone, American Journal of Physi- cal Anthropology, 117: 157–168.
Hatchobori Sanchome iseki (dainiji) Chosa-kai (2003) Hatchobori Sanchome iseki II, Tokyo. (in Japanese) Katoh Construction Co., Ltd. (2010) Taito-ku maizou-
bunkazai haxtukutu chyosa houkokusyo 53: Shitaya Doubouchyo iseki. Tokyo. (in Japanese)
Kito H. (2010) Bunmei toshiteno Edo system (The Edo system as the civilization). Kodanshya, Tokyo. (in Jap- anese)
Sakaue K. (2012) Craniofacial variations among the com- mon people of the Edo period. Bulletin of National Museum Nature and Science, Tokyo, Ser. D vol. 38, pp.
39–49.
Sakaue K. and Adachi N. (2009) Evaluation of the sexing methods using the cranial traits in the Japanese popula- tion (In Japanese with English summary). Nihon Houigaku Zashi 63: 125–140.
Tanigawa A. (2004) edo no haka no maisousisetu to huku- souhin (Burial facilities and accessories in the graves of Edo era). Edo iseki kennkyuukai (ed.) Haka to Maisou to Edo-jidai. Yoshikawakoubunnkann, Co. Ltd., Tokyo, pp. 224–250. (in Japanese)
Toritu Hitotsubashi koukou Iseki Chosa-dan (1985) Edo:
Toritu Hitotsubashi koukou Iseki Chousa houkoku (Edo: Excavation report of the Hitotsubashi metropori- tan high school site), Tokyo. (in Japanese)
Nagata Y. and Yoshida M. (1997) Toukeiteki Tajyuhikakuhou no kiso. (the Basis of the multiple comparison methods in Statics). Scientist press, Tokyo.
(in Japanese)