Cross-Sectional Effects of Common and Heterogeneous Regressors on Asymptotic Properties of Panel Autoregressive Unit Root Tests
Katsuto Tanaka
Faculty of Economics, Gakushuin University, Tokyo, Japan
The present paper deals with nonstationary panel autoregressive (AR) models, and examines cross- sectional effects of regressors on the asymptotic properties of panel unit root tests for the AR(1)
coefficient. We consider various types of common and heterogeneous regressors and compute limiting local powers of tests as T →∞ for each N, where T and N are the time and cross section dimensions, respectively. Dealing with tests based on the ordinary least squares estimator (OLSE) and the generalized LSE (GLSE) , we examine how common and heterogeneous regressors affect the tests as N becomes large. It is shown that the existence of common regressors does not affect the tests asymptotically as N →∞ . This means that the power of the tests remains the same even if the model contains common regressors. We further derive the limiting power envelopes of the most powerful invariant (MPI) tests, which yields the conclusion that the GLSE-based tests are asymptotically efficient, unlike the time series case.
Keywords Asymptotically effi cient test, Common regressor, Cross-sectional effect, Heterogeneous regressor, Moment generating function, Numerical integration, Panel unit root tests.
Address correspondence to Katsuto Tanaka:
Faculty of Economics Gakushuin University
Mejiro, Toshima-ku, Tokyo 171-8588 Japan
e-mail: [email protected]
1. INTRODUCTION
Nonstationary panel AR models were extensively discussed in Moon and Perron (2008) and Moon,
Perron, and Phillips (2007) , where the former deals with the case of heterogeneous intercepts, whereas
the latter discusses the case of heterogeneous trends. In these papers, the limiting local powers of various
panel AR unit root tests are computed as T and N jointly tend to ∞ under the local alternative that
shrinks to the null at the rate of 1/( TN
κ) , where T is the time series dimension and N is the cross section
dimension with 0 < κ < 1.
Unlike the above works, the present paper examines the effect of the cross section dimension N on the unit root tests as T →∞ . This may be useful when T is bigger than N and it is desirable to see the intermediate situation rather than the final situation as both T and N go to ∞ . We consider four types of regressors: (1) a common intercept and trend, (2) heterogeneous intercepts and a common trend, (3) a common intercept and heterogeneous trends, (4) heterogeneous intercepts and trends. For these models we conduct panel unit root tests based on the OLSE and GLSE of the AR coefficient, and some other tests based on these residuals. To see the cross-sectional effect, we compute limiting local powers of these unit root tests as T → ∞ for each intermediate N under the AR coefficient close to unity in the order of 1/ T. It is theoretically and graphically shown that, as N becomes large, the existence of common regressors does not affect the asymptotic properties of these tests, although that of heterogeneous regressors does affect. This fact was also partly observed in panel AR models discussed in Breitung
(2000) and Moon et al. (2007) . We give more detailed analysis of this fact for each intermediate value of N. We also derive the limiting powers of these tests and envelopes of the most powerful invariant
(MPI) tests as N →∞ , utilizing the joint moment generating functions (m.g.f.s) associated with the test statistics obtained in Nabeya and Tanaka (1990) , Tanaka (1996, Chap. 7) , and Tanaka (2017, Chap.
10) .
The outline of the paper is as follows. In Section 2 we present panel AR models to be dealt with in this paper. In Section 3 we compute limiting local powers of various unit root tests. In Section 3.1 we deal with OLSE-based tests, followed by GLSE-based tests in Section 3.2. The limiting power envelopes are derived in Section 3.3, and it is found that the GLSE-based tests are asymptotically efficient, unlike the time series case. The effect of temporal or cross-sectional dependence of the error term on the tests is discussed in Section 3.4. Section 4 concludes the paper. Proofs of theorems are provided in the Appendix.
2. PANEL AR MODELS
The panel AR models to be discussed in this paper are the following types:
Model A: y
it=α+β t+η
it, (1)
Model B: y
it=α
i+β t +η
it, (2)
Model C: y
it=α+β
it+η
it, (3)
Model D: y
it= αi+ βi t + η
it , (4)
t + η
it, (4)
where i refers to cross section, whereas t refers to time series. The process { η
it} is defined for all models
by
η
it= ρi η
i,t−1+ εit , ( i =1, . . . , N ; t =1, . . . , T ) , (5)
, ( i =1, . . . , N ; t =1, . . . , T ) , (5)
where it is assumed that { η
it} starts from ηi0=0 for each i , and is driven by { εit} . We initially assume { εit}
} . We initially assume { εit}
~ i.i.d.(0, σ
2) for simplicity of presentation. The case of temporal or cross-sectional dependence will be discussed in Section 3.4.
Model A is the most restricted model with common intercept and trend. Model B has heterogeneous intercepts, whereas Model C has heterogeneous trends. Model D is the most unrestricted model with heterogeneous intercepts and trends. Note that these four models coincide with each other when N =1.
For the above models we consider the panel AR unit root test
H
0: ρ
i=1 versus H
1: ρ
i<1 for some i, (6)
where we assume that, under H
1, ρ
itakes the following form:
ȡ
i=1− cN
T , c
N= c
N
ț, (7)
with c > 0 and 0 < κ < 1. This is a simple extension of the time series unit root test. A more general alternative allows the true value of ρ
ito be different among cross sections. Moon and Perron (2008) and Moon, Perron, and Phillips (2007) assume such an alternative, but we maintain (7) to simplify subsequent discussions.
Under the above setting we shall explore asymptotic properties of various unit root tests. For this purpose we define the Ornstein-Uhlenbeck (O-U) process by
dY (i r )=− c
N Y (i r ) dr + dW (i r ) , Y (0)=0 , i ( i =1, . . . , N ) , (8)
r ) dr + dW (i r ) , Y (0)=0 , i ( i =1, . . . , N ) , (8)
( i =1, . . . , N ) , (8)
where r ∈ [0, 1] and { W (i r )} is the standard Brownian motion independent of { W (k r )} ( i ≠ k ) so that Y (1 r ) , . . . , Y (N r ) are i.i.d. for any r ∈ [0, 1] .
r )} ( i ≠ k ) so that Y (1 r ) , . . . , Y (N r ) are i.i.d. for any r ∈ [0, 1] .
r ) are i.i.d. for any r ∈ [0, 1] .
3. LIMITING POWERS AND POWER ENVELOPES
We first compute the limiting local powers of various unit root tests for Models A through D. In Section 3.1 we deal with OLSE-based tests, followed by GLSE-based tests in Section 3.2. The limiting power envelopes of the MPI tests are derived in Section 3.3. The effect of temporal or cross-sectional dependence of the error term is discussed in Section 3.4.
3.1. OLSE-Based Tests
The present test was earlier considered in Moon et al. (2007) , and Moon and Perron (2008) . The
limiting local power was also computed in these works as both T and N go to ∞ under a more general
setting. Here we examine the cross-sectional effect of regressors as T →∞ for each N.
Let η ˆ(itM) be the OLS residual obtained from Model M (M=A, B, C, D) . Then we compute the estimator ˆ ρ
(M) of ρ
i= ρ under H0 by
by
ˆ
ȡ =
Ni=1 T
t=2
Ș ˆ
(M)i,t−1Ș ˆ
(M)itNi=1 T
t=2
Ș ˆ
(M)i,t−12
=1+ 1
T
Ni=1
U
(M)iTNi=1
V
(M)iT,
(M)
(9)
where
(10)
(11)
The following theorem describes the asymptotic distribution of ˆ ρ(M) as T → ∞ for each N, the proof of which is given in the Appendix.
Theorem 1. As T →∞ with N fixed under ρ
i=1− cN / T , the asymptotic distribution of ˆ ρ(M) in Model M
in Model M
(M=A, B, C, D) follows
T ( ȡ
(M)ˆ −1) =
Ni=1
U
(MiT )Ni=1
V
(M)iT⇒ Q(MN )= U(D)1 +
Ni=2 U
(Mi )
+
Ni=2U
(Mi )V
(D)1+
Ni=2V
(M)i, (12)
where
U
(A)i=
10
Y (ri ) dY (r)
i , V
(A)i =
1
0
Y
i(r)
2dr , U
(B)i=
10
Y (r)i −
1
0
Y (si ) ds dY (r)
i , V
(B)i =
1
0
Y (r)i −
1
0
Y (si ) ds
2dr , U
(Ci )=
10
Y (r)i −3 r
1
0
sY (s)i ds dY (ri )−3
01sY (s)i ds dr , V
(Ci )=
1
)−3
01sY (s)i ds dr , V
(Ci )=
1
0
Y (r)i −3 r
1
0
sY (s)i ds
2dr , U
(D)i =
1
0
Y (r)i −(4−6 r)
1
0
Y (s)i ds −(12 r−6)
1
0
sY (i s ) ds dY (r)i , V
(D)i =
1
, V
(D)i=
10
Y (r)i −(4−6 r)
1
0
Y (s)i ds −(12 r−6)
1
0
sY (si ) ds
2dr . U
(M)iT= 1
Tı
2T
t=2
Ș ˆ
(M)i,t−1Ș ˆ
(M)it−ˆ Ș(M)i,t−1
= 1
2 Tı
2Ș ˆ
(M)iT 2− Ș ˆ(M)i1 2−
T
t=2
Ș ˆ
(M)it−ˆ Ș(Mi,t−)1 2 , V
(M)iT = 1
T
2ı
2T
t=2
Ș ˆ
(M)i,t−1 2.
Some remarks follow.
(a) When N =1, that is, in the time series case, the distribution of Q
(M)Nin (12) reduces to Q
(1D)= U(1D)/ V(1D) for all M. Note also that U
(1A)/ V(1A) corresponds to the popular near-unit root distribution associated with the time series model x
t= ρxt−1+ εt with ρ =1− c / T .
for all M. Note also that U
(1A)/ V(1A) corresponds to the popular near-unit root distribution associated with the time series model x
t= ρxt−1+ εt with ρ =1− c / T .
+ εt with ρ =1− c / T .
(b) As N becomes large, it holds that
Q
(M)N= U(D)1 +
Ni=2 U
(M)i
V
(D)1 +
+
N
+
i=2
V
(M)i=
Ni=2
U
(M)iO (p 1 )
Ni=2
V
(M)iO (1)p 㲔
Ni=1
U
(M)iNi=1
V
(M)i,
where the distribution of this last quantity is obtained from Model M without common regressors, which means that the effect of common regressors fades away as N becomes large.
(c) We can deal with some other variations of the above models, for which we can also consider the statistics T (ρ ˆ(・)−1) . For example, we can show that, as T →∞ with N fixed under ρi=1− c
N/T ,
=1− c
N/T ,
y
itȘ
itNi=1
U
(A)iNi=1
V
(A)iĮ+
+
+
+ Șit
U
(B)1+
Ni=2U
(A)iV
(B)1+
Ni=2V
(A)i,
ȕ t Ș
itU
(C1 )+
Ni=2U
(A)iV
(CM )+
Ni=2V
(A)i, ,
Į
iȘ
itNi=1
U
(B)iNi=1
V
(B)i, ȕ
it Ș
itNi=1
U
(Ci )Ni=1
V
(C)i. , T ȡ
(A1)−1)
= ( ˆ ⇒ yit= , T ( ȡ(Aˆ
2)− 1 ) ⇒ yit= , T ( ȡ(Aˆ
3)−1) ⇒ yit= , T ( ȡ(B1)ˆ − 1 ) ⇒ y
it= , T ( ȡ(Cˆ
1)− 1 ) ⇒ Model A1:
ˆ
2)− 1 ) ⇒ yit= , T ( ȡ(Aˆ
3)−1) ⇒ yit= , T ( ȡ(B1)ˆ − 1 ) ⇒ y
it= , T ( ȡ(Cˆ
1)− 1 ) ⇒ Model A1:
ˆ
3)−1) ⇒ yit= , T ( ȡ(B1)ˆ − 1 ) ⇒ y
it= , T ( ȡ(Cˆ
1)− 1 ) ⇒ Model A1:
ˆ − 1 ) ⇒ y
it= , T ( ȡ(Cˆ
1)− 1 ) ⇒ Model A1:
Model A2:
Model A3:
Model B1:
Model C1:
Thus we also conclude that, for these models, the existence of common regressors does not affect the asymptotic behavior of the OLSE-based tests as N →∞ , which was also described in (b) .
(d) U(iC) and V
(iC) behave differently from the other quantities, which may be because U
(iC)/V
(iC) results from the restricted regression without intercept y
it=β
it+η
it. It can also be shown that U
(i
M)
and V
(i M)are uncorrelated under ρ=1 for M=B, D, but are correlated for M=A, C. In fact, it holds that Cov
( U(iA), V
(iA))=1/3 and Cov ( U(iC), V
(iC))=1/175 when cN=0. These can be computed easily from the joint moment generating function (m.g.f.) described below.
, V
(iC))=1/175 when cN=0. These can be computed easily from the joint moment generating function (m.g.f.) described below.
To compute the distribution of Q
(NM)in (12) for each N, we use the joint m.g.f.m
(M)( x, y ) of U(iM)
and V
(iM)defined by
m
(M)( x, y ) =E exp x U(M)i + y V(M)i = e(cN−x)/2 H
(M)( x, y )
−1/2, (13)
= e(cN−x)/2 H
(M)( x, y )
−1/2, (13)
where, by putting μ= c
2N− 2 y , we have [Tanaka (2017, Chap. 10)]
x c
2N+ 3
(
( (
( (
c
N+ 3 ) −c
3Nμ
2sinh μ
μ c
2Nμ
2cosh μ 3 x c
2N+3 cN+3) −6 y cN+1)
+1)
μ
4sinh μ
μ − cosh μ , c
5N− c4Nx−4 x
2 c
2N+3 cN+27) −8 y c2N−3 cN−3)
+27) −8 y c2N−3 cN−3)
−3)
μ
4sinh μ
μ 24 c
4Nx + 8 x
2y + 4 ( c
N+ 1 ) ( 3 x2− y2)
)
μ
6sinh μ
μ cosh μ μ
21
μ
2c
4Nμ
48 c
3N( cNx− 2 y ) +4 x (
2 c
2N+3 cN+6)
μ
6cosh μ
4 c
4Nx+ 4 x (2 c
2N+ 3 c
N− 3 ) − 2 c2N( y cN+ 3 )
+ 3 )
μ
6.
−
−
−
+
+
+
− +
+
=
( x, y ) H(C)
( x, y ) H(D)
=
( x, y )
( x, y )
H
(A)= cosh μ +( c N−x) sinh μ μ ,
H
(B)−
+
x
2+c
2Nx−c
3N+2 y μ2 sinh μ
μ + c
2Nμ
2cosh μ 2 x
2+
( c2Nx− 2 c
Ny )
μ
4cosh μ−1 ,
=
Then the distribution of Q
(NM)can be computed by using Imhofʼs formula [Imhof (1961)]
P Q
(M)N侑 z = P z V(D)1 + − −
N i=2
V
(Mi )U
(D)1N i=2
U
(M)i侒 0
= 1 + 2
1 ʌ
∞ 0
1
ș Im m
(D)( − iș, ișz ) m(M(
)− iș, ișz )
N−1 dș .
(14)
Numerical computation like Simpsonʼs formula can be used to compute (14) by taking care of the computation of square roots of complex-valued quantities [Tanaka (1996)] .
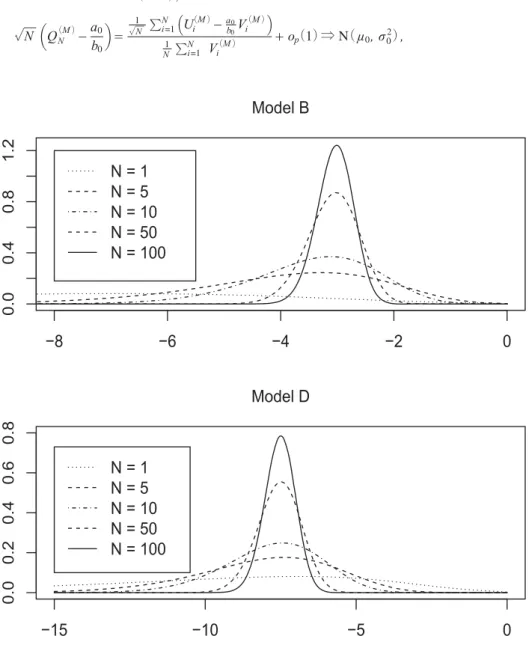
Figure 1 draws the probability densities of Q
(NB)
and Q
(ND)
for various values of N under H
0(c
N=0)
to examine the cross-sectional effect of N. As Theorem 2 below indicates, these distributions converge to
−3 and−15/2, respectively, as N becomes large. Note that Q(1B)= Q(1D). The distributions Q
(N
. The distributions Q
(NB)
for N >1 are shifted from Q
(1D), whereas Q
(ND)for N > 1 are just the convolution since P ( Q
(ND)侑 z )= P (∑
Ni=1( zV(iD)
− U(iD))侒0) , as is seen from (14) . The general feature of Q(NA) and Q
(NC) are the same as Q
(N
and Q
(NC)are the same as Q
(NB)
, although those densities are not presented here.
We next compute limiting powers of the tests based on Q
(NM)as N → ∞ under ρ =1− c
Nwith c
N=
c/ N
κ. We need to find the limiting distribution of normalized Q
(NM)by suitably choosing κ . For this purpose, let us put
E ( U
(M)i)= a0+ a1c
N+ a2c
2N+ O c (
3N) , E (V
(M)i )= b0+ b1c
N+ b2c
2N+ O c ( )
3N .
c
N+ a2c
2N+ O c (
3N) , E (V
(M)i )= b0+ b1c
N+ b2c
2N+ O c ( )
3N .
+ b1c
N+ b2c
2N+ O c ( )
3N .
c
2N+ O c ( )
3N.
The joint m.g.f. m
(M)( x, y ) of U(iM) and V
(iM) shown above can be used to compute these moments using the Taylor expansion, as is shown in the Appendix. We have, by the week law of large numbers (WLLN)
and the central limit theorem (CLT) , N Q
(M)Na
0b
0= +
−
1N
Ni=1
U
(M)i−
ab00V
(M)iN1
Ni=1
V
(Mi )o (p 1 ) ⇒ N ( μ
0, ı
02) ,
FIGURE 1 Densities of
( )under are drawn at the top, whereas those of
( )at the
bottom. Densities are computed for =1, 5, 10, 50, 100 for both graphs.
where
Then it is recognized that, for the asymptotic distribution of normalized Q
(NM)to be nondegenerate, c
N= O (1/ N ) when a1b
0− a0b
1≠0, and c
N= O (1/ N1/4) when a1b
0− a0b
1=0 and a
2b
0− a0b
2≠0. It is shown in the Appendix that cN= O (1/ N ) for Q(NA) and Q
(NB) , whereas c
N= O (1/ N1/4) for Q(NC) and Q
(ND), and we have the the following theorem.
b
1≠0, and c
N= O (1/ N1/4) when a1b
0− a0b
1=0 and a
2b
0− a0b
2≠0. It is shown in the Appendix that cN= O (1/ N ) for Q(NA) and Q
(NB) , whereas c
N= O (1/ N1/4) for Q(NC) and Q
(ND), and we have the the following theorem.
b
0− a0b
1=0 and a
2b
0− a0b
2≠0. It is shown in the Appendix that cN= O (1/ N ) for Q(NA) and Q
(NB) , whereas c
N= O (1/ N1/4) for Q(NC) and Q
(ND), and we have the the following theorem.
b
2≠0. It is shown in the Appendix that cN= O (1/ N ) for Q(NA) and Q
(NB) , whereas c
N= O (1/ N1/4) for Q(NC) and Q
(ND), and we have the the following theorem.
and Q
(NB), whereas c
N= O (1/ N1/4) for Q(NC) and Q
(ND), and we have the the following theorem.
and Q
(ND), and we have the the following theorem.
Theorem 2. The limiting powers of the tests based on Q
(NM)(M=A, B, C, D) under ρ=1− c/(NκT) at the 100γ% level are given as follows:
P N
2 Q
(A)N< zȖ → ĭ zȖ+ 0.707 c ,
+ 0.707 c ,
P +3 < +0.470
+4
z
Ȗ→ ĭ zȖ c ,
P < z
Ȗ→ ĭ zȖ+0.0721 c ,
P + < z
Ȗ→ ĭ zȖ
5 N
51 Q
(B)N7 N
110 Q
(C)N 2+0.0527 c ,2
112 N
2895 Q
(D)N15 2
where Φ(·) is the distribution function of N (0, 1) , and z
γis the 100γ% point of N (0, 1) , whereas κ = 1/2 for Models A and B, and κ =1/4 for Models C and D.
It follows that the OLSE-based unit root tests in Models A and B have nontrivial powers in a N−1/2T
−1 neighborhood of unity, whereas the powers for Models C and D are nontrivial in a N
−1/4T
−1
neighborhood of unity. It is also seen that the limiting power decreases as the model complexity increases.
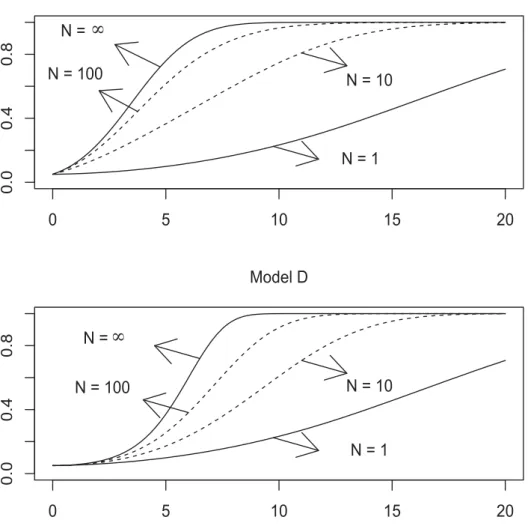
Figure 2 shows powers of the Q
(NB)
- and Q
(ND)
-tests against c=c
NN
κ∈[0, 20] at the 5% level for N
=1, 10, 100, ∞ , where the powers for N < ∞ are obtained from (14) by putting z at the 5% point of the null distribution of Q(NM), whereas those for N =∞ are obtained from Theorem 2. It seems that the powers for N =100 are still not well approximated by the limiting powers. This is particularly true of Model D. The powers of the Q
(NB) -test are higher than those of the Q
(ND) -test, which is also evident from Theorem 2. This means that the existence of heterogeneous trends decreases the power.
In the next subsection we consider the GLSE-based tests, which will be shown to be better than the μ0=
Nlim
→∞ +
=
Nlim
→∞− N a1b
0− a0b
1
b
1b
0c
Na
2b
0− a0b
2
b
0 c
2N , ı
20 Var U
(M)i a
0
b
0V
(M)i.
OLSE-based tests.
3.2. GLSE-Based Tests
Let us express Model M (M=A, B, C, D) as y = X
(M)γ
(M)+ η , where X(M) and γ
(M) are the regression matrix and parameter vector in Model M, respectively, whereas
y = y
1y ...
N, y
i= yi1
y ...
iTȘ = Ș
1...
Ș
NȘ
i= Și1
Ș ...
iT
.
, ,
FIGURE 2 Powers of the
( )-test are shown at the top, whereas those of the
( )-test are
at the bottom. Powers are computed for =1, 10, 100, ∞ for both graphs.
Then we define the GLS residual by η ˜
(M)= y − X(M)γ ˜
(M), where
γ ˜
(M)= ( ( X
(M)) ( ' I
N ⊗ CC' )−1X
(M))
−1( X
(M)) ( ' I
N ⊗ CC' )−1y . (15)
y . (15)
Here ⊗ is the Kronecker product and C is the T × T lower triangular matrix with ( s, t ) -th element being 1 for s 侒 t and 0 otherwise. The GLSE ρ ˜
(M)of ρ can be computed following (9) with η ˆ
(M)replaced by η ˜
(M).
The following theorem describes the asymptotic distribution of ρ ˜(M) as T → ∞ for each N, the proof of which is given in the Appendix.
Theorem 3. As T →∞ with N fixed under ρ=1− c
N/T , the asymptotic distribution of ρ ˜(M) for Model M (M = A, B, C, D) follows
R
(M)NW
(D)1+
Ni=2W
(M)iX
(D)1+
Ni=2X
(M)i,
T ( ȡ ˜
(M)− 1 ) ⇒ = (16)
where
It is noticed that the distributional structure of the GLSE-based statistics R
(NM)remains the same as that of the OLSE-based statistics Q
(NM). It is also seen that R
(NA)coincides with R
(NB). The same is true of R
(NC)and R
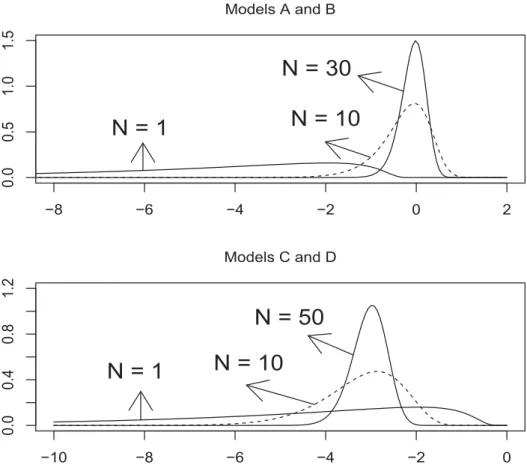
(ND), and these properties are also shared in the time series case [Tanaka (1996)] . The densities of R
(NA)(= R
(NB)) under H0 are drawn at the top of Figure 3 for N =1, 10, 30, whereas those of R
(NC)(=
R
(ND)) at the bottom for N =1, 10, 50. The former densities are seen to be shifted from the latter as N becomes large. Both R(NA) and R
(NB) converge to 0, whereas both R
(NC) and R
(ND) converge to −3, as is described in Theorem 4 below.
We next consider limiting powers of the tests based on R
(NM)as N → ∞ , which is described in the following theorem, the proof of which is given in the Appendix.
Theorem 4. The limiting powers of the tests based on R
(NM)
(M=A, B, C, D) as N →∞ under ρ=1−
c/(N
κT) at the 100γ% level are given as follows:
P N
2 R
(M)N< zȖ → ĭ zȖ+ 0.707 c , ( M = A, B )
+ 0.707 c , ( M = A, B )
P 5 N +3 < z
Ȗ6 R
(M)N,
+0.0745
→ ĭ zȖ c ,
2 (M=C, D) , W(A)i W
(B)i 1
W
(B)i 10
Y
idY
i, X
(A)iX
(B)i 10
Y
i2dr , W
(Ci )W
(D)i1
2 , X
(Ci )X
(D)i 10
Y
irY
i2
dr .
= (r) (r) = = (r)
=
= − = = (r) − (1)
=
where κ =1/2 for Models A and B, and κ =1/4 for Models C and D.
It follows from Theorem 4 that R(NM) converges to 0 for M = A, B, whereas it converges to −3 for M=C, D, as was mentioned before. It is also noticed from Theorems 4 and 2 that the GLSE-based tests are better than the OLSE-based tests in Models B, C, D, although those are the same in Model A. The top of Figure 4 shows powers of R
(NA)(= R(NB)) -tests at the 5% level for N =1, 10, 50, ∞ , whereas the bottom of Figure 4 those of the R(NC)(= R(ND)) -tests. It is seen that, for Models A and B, the powers for N =50 are reasonably well approximated by the limiting powers, whereas, for Models C and D, the aprroximation is still not good enough for N =50. It is seen that the former powers are higher than the latter, as is anticipated from Theorem 4. This means that the existence of heterogeneous trends decreases the power, as in the OLSE-based tests.
) -tests at the 5% level for N =1, 10, 50, ∞ , whereas the bottom of Figure 4 those of the R(NC)(= R(ND)) -tests. It is seen that, for Models A and B, the powers for N =50 are reasonably well approximated by the limiting powers, whereas, for Models C and D, the aprroximation is still not good enough for N =50. It is seen that the former powers are higher than the latter, as is anticipated from Theorem 4. This means that the existence of heterogeneous trends decreases the power, as in the OLSE-based tests.
) -tests. It is seen that, for Models A and B, the powers for N =50 are reasonably well approximated by the limiting powers, whereas, for Models C and D, the aprroximation is still not good enough for N =50. It is seen that the former powers are higher than the latter, as is anticipated from Theorem 4. This means that the existence of heterogeneous trends decreases the power, as in the OLSE-based tests.
FIGURE 3 Densities of
( )(=
( )) under
0are drawn at the top, whereas those of
( )(=
( )) at the bottom. Densities at the top are computed for =1, 10, 30,
and those at the bottom for =1, 10, 50.
3.3. Limiting Power Envelopes
In previous subsections, dealing with Models A through D, we considered panel unit root tests based on OLSE and GLSE, for which the limiting local powers were computed and power comparisons were made among those tests, examining the cross-sectional effects. In this subsection we derive the power envelopes, from which the performance of these tests can be evaluated. The idea was earlier developed in the time series context by Elliott et al. (1996) , and was extended to the nonstationary panel data by Moon et al. (2007) . Here we derive the power envelopes for Models A through D, paying attention to the cross-sectional effects.
Let us consider the testing problem H0 ȡ
i
ș
NT ,
= 1
: versus H
1: ȡ
i= 1 − =(ș) ȡ (17)
where θ
N= θ / Nκ with θ being a known positive constant. We assume that the true value of ρ under H
1 is FIGURE 4 Powers of the
( )(=
( ))-test are shown at the top, whereas those of the
( )
(=
( ))-test at the bottom. Powers are computed for =1, 10, 50, ∞ for both
graphs.
given by ( ρ c )=1− c
N/ T with cN= c / Nκ. Assuming { ε
it}~ NID (0, σ2) , the Neyman-Pearson lemma tells us that the test which rejects H0 for small values of
. Assuming { ε
it}~ NID (0, σ2) , the Neyman-Pearson lemma tells us that the test which rejects H0 for small values of
for small values of
S
(M)NT(ș)=
Ni=1 T
t=1
Ș ˜
(M)it(1) − (ș) ȡ Ș ˜(M)i,t−1(1)
2 Ș ˜
(M)it(0) − Ș ˜(M)i,t−1(0)
(0)
−
21 T
N i=1
T t=1
˜
2˜ Ș
Ș
(M)it(0) −
(M)i,t−1(0)
(18)
is MPI, where η ˜
(itM)(0) and η ˜(itM)(1) are the GLS residuals obtained from Model M under H0 and H
1, respectively. The residual η ˜
(itM)(0) is the same as the GLS residual dealt with in the last subsection, that is, η ˜(M)(0)= η ˜(M), whereas η ˜
(M)(1)= y − X(M)γ
(M)(1) , where
and H
1, respectively. The residual η ˜
(itM)(0) is the same as the GLS residual dealt with in the last subsection, that is, η ˜(M)(0)= η ˜(M), whereas η ˜
(M)(1)= y − X(M)γ
(M)(1) , where
, whereas η ˜
(M)(1)= y − X(M)γ
(M)(1) , where
Ȗ
(M)(1) = X(M) Ω
−(ș)
1 X
(M)−1 X
(M)Ω
−(ș)
1 y ,
with Ω(θ)=I
N⊗ C ( ρ (θ)) C' ( ρ (θ)) . Here C ( (θ)) ρ is the T × T lower triangular matrix with (s, t)
-th element being ρ
|s−t|(θ)for s 侒 t and 0 otherwise. The test based on S
(NTM)(θ) with fixed θ is called the point optimal invariant (POI) test [King (1987)] .
The following theorem gives the weak convergence of S
(NTM)
(θ) as T →∞ for each N, the proof of which is given in the Appendix.
Theorem 5. As T →∞ under ρ =1− c
N/ T for each N , the MPI test statistic S(NTM)( θ ) in (18) follows
(19)
where
Z
(A)i(ș) = Z
(ș) = (r ) − (1)
(ș) = (r ) +2 (r) (r)
(ș) =
(B)i
ș
N2 10
Y
i2dr ș
N 10
Y
idY
i, Z
(Ci )Z
(D)iș
N2 10
Y
i2dr 2 ( +1) ș
N(r) dr įN Y
i
1 0
r Y
iș
N+ 1
3į
NY
i2ș
N2į
N2
ș
+ (1) −
1(r) dr −
N,
0
r Y
iwith δ
N=1+θ
N+ θN2 .
It is seen that the expression for S
(NM)
(θ) in (19) is of a similar nature to Q(N
M)
in (12) and R
(N M)in
(16) . It is also noticed that the distribution of S(NM)( θ ) depends on θ that is the value under H1. Thus the MPI test based on S
(NM)( θ ) is not uniformly best, but we can modify S(NM)( θ ) so that the distribution of the modified statistic does not depend on θ as N →∞ . Then we can compute the limiting power of the test based on a modified statistic which yields the limiting power envelope of all the invariant tests for Model M. The following theorem gives such statistics and the power envelopes.
. Thus the MPI test based on S
(NM)( θ ) is not uniformly best, but we can modify S(NM)( θ ) so that the distribution of the modified statistic does not depend on θ as N →∞ . Then we can compute the limiting power of the test based on a modified statistic which yields the limiting power envelope of all the invariant tests for Model M. The following theorem gives such statistics and the power envelopes.
S
(M)NT(ș) ⇒ S(M)N(ș) = 1 (ș) + (ș)
N Z
(D)1N i=2
Z
(M)i, (M=A, B, C, D) ,
Theorem 6. The limiting powers of the tests based on the MPI statistics S
(NM)( θ ) in (19) at the 100 γ % level as N →∞ under θN= θ / Nκ and c
N= c / Nκ are given by
and c
N= c / Nκ are given by
P N
2 S
(M)N(ș) − < zȖ → Ɯ zȖ+0.707 c , (M=A, B) , șN
+0.707 c , (M=A, B) , șN
1
2 ș
N(20)
P 3 5 N S
(M)N(ș) +ș
N− + < zȖ → Ɯ zȖ+0.0745 c ,2 (M=C, D) , șN2
+0.0745 c ,2 (M=C, D) , șN2
1 6 1
45 ș
N2(21)
where κ =1/2 for Models A and B, and κ =1/4 for Models C and D.
The limiting powers of the modified tests give the power envelope of all the invariant tests.
Comparing Theorem 6 with Theorem 4 it is seen that the power functions of the GLSE-based tests coincide with the power envelopes. Thus the GLSE-based tests are asymptotically efficient, unlike the time series case. This is a merit of panel tests as N →∞ .
There are some other tests that are asymptotically efficient. Here we take up two such tests. Define
K
(M)NT= (0) (0) − (0)
N i=1
Ș ˜
(M)iT2 N
i=1 T
t=1
Ș ˜
(M)itȘ ˜
(M)i,t−12
, (22)
L
(M)NT= 1 (0) (0) − (0)
T
N i=1
T t=1
Ș ˜
(M)it2 N
i=1 T
t=1
Ș ˜
(Mit )Ș ˜
(M)i,t−12
. (23)
The test that rejects H
0for K
(NTM)small is locally best invariant (LBI) , although the test is inapplicable to Models C and D because K
(NTM)≡ 0 for M = C, D, whereas the test that rejects H
0for L
(NTM)small is LBI and unbiased (LBIU) for M = C,D [Tanaka (2017, Chap. 10)] . We have, as T →∞ for each N,
K
(M)NT⇒ K(M)N
1 N
N i=1
Y
i20
L
(M)NT⇒
=
L
(MN )= 1 N
N i=1
1
0
Y
i2dr ,
N i=1
1
0
Y
irY
i 21 dr , N
(M=A, B)
(1) , , , (M=C, D) ,
(M=A, B)
(r) , ,
( M = C, D )
(1)
(r) − , .
Since it can be shown that, for M=A, B,
=1
E (K(M)N ) −c
N+O (c
2N) , Var (K
(M)N )= 1 2−4 c
N+O (c
N2) , N
we have N ( K
(NM)−1) ⇒ N (− c, 2) by putting cN= c / N , which implies that the K(NM)-tests for M=A,
B are asymptotically efficient. It is evident that the L
(NM)-tests are asymptotically efficient for M=C, D.
-tests for M=A,
B are asymptotically efficient. It is evident that the L
(NM)-tests are asymptotically efficient for M=C, D.
Note that the LBI and LBIU tests in the time series case ( N =1) are asymptotically inefficient [Tanaka
(1996, Chap. 9)] . We also note in passing that, if the GLS residual in (23) is replaced by the OLS residual, the resulting statistic is essentially the Durbin-Watson statistic and the corresponding test is asymptotically inefficient.
3.4. Eff ect of Temporal or Cross-Sectional Dependence
Here we consider the situation where there exists temporal or cross-sectional dependence of the error term { ε
it} in (5) and examine the effect of such dependence on the test statistics obtained in previous subsections.
Let us first consider temporal dependence. For this purpose we assume İit
∞ k=0
ij
ikȗ
i,t−kij
iȗ
it,
∞ k=1
k |ijik| ∞
= = (L) < , { ȗit} ~ i.i.d. (0 , ı2) , (24)
) , (24)
where φ (L)=1+φi i1L+φ
i2L
2+· · · with L being the lag-operator. The distributional properties of the statistics T (ρ ˆ
(M)−1) in (12) and T ( ρ ˜(M)−1) in (16) are affected by this relaxation. In fact, it can be shown that, as T →∞ for each N,
N
i=1
ij (1)2i U
(Mi )+ (1− ) 1 + (1)
2 Ȝ
iO
pN
i=1
ij
2iV
(M)i,
N i=1
ij
2iW
(M)iN
i=1
ij
2iX
(Mi )N
i=1
∞ k=0
ij
2ikW
(M)iN
i=1
ij
2iX
(M)iT ȡ
(M)−1) ⇒
( ˆ
+ (1)
(1) Op
+ (1− ) + (1)
(1) 1
2 Ȝ
iO
p+ (1)
(1) Op
(M=A, B)
, ,
+ (1) Op
+ (1)
(1) Op
, (M=C, D) , T ȡ
(M)−1) ⇒
( ˜
where U
(iM)and V
(iM)are defined in (12) , and W
(iM)and X
(iM)are defined in (16) , whereas λ
i is the ratio of the short-run to long-run variances of {εit} given by λ
i=∑
∞k=0φ
ik2 /φ (1)2i . The above statistics depend on the short-run and long-run variances of the error term that characterize temporal dependence.
We next consider cross-sectional dependence, for which we assume that
İ
tİ
1t...
İ
NtN × 1 ~ Σ Σ = ı
ik= : i.i.d. (0 , ) , : N × N .
It then follows that
N
i=1
ı
iiU ˜
(M)iN
i=1
ı
iiV ˜
(M)i,
N
i=1
ı
iiW ˜
(M)iN
i=1
ı
iiX ˜
(M)iT ( ȡ
(M)ˆ −1) ⇒ .
+ (1) Op
+ (1) Op
+ (1) Op
+ (1) Op
T (˜ ȡ
(M)−1) ⇒
Here U˜
(iM), V˜
(iM), W ˜
(i
M)
, and X˜
(iM)replace U
(iM), V
(iM), W
(iM), and X
(iM), respectively, with Y (i r ) replaced by Y
˜(
i r ) , where
dY˜ (r)=−ci NY˜ (r)i dr + dW ˜
dr + dW ˜
(r)
i, and { W ˜
(
ir )} is the standard Brownian motion with Cov ˜ W (r)i , W ˜ (s) =k ı
ik
ı
ikı
iiı
kkmin (r, s) .
The test statistics depend on the covariances σ
ikof the error term that characterize cross-sectional dependence.
It is recognized from the above observations that, to use the asymptotic results obtained in previous subsections, we need to modify the statistics to make them independent of nuisance parameters. This remains to be done.
4. CONCLUDING REMARKS
Under a simple setting, we have presented a unified approach to deriving the limiting local powers of panel AR unit root tests, paying attention to the cross-sectional effect of N. For this purpose it is necessary to compute moments up to the second order of the limiting statistic in the time series direction.
We found it easier to use its m.g.f., unlike in the literature. It happened that the tests that were not powerful in the time series case become more powerful in the panel case. It was also found that the existence of a common intercept and/or a common trend does not affect the asymptotic behavior of the tests. This holds for not only the tests based on OLS and GLS residuals, but also power envelopes.
The present approach can be applied to unit root tests for other types of panel models such as panel moving average models or panel error components models. Some simple extensions are found in Tanaka
(2017, Chap. 10) . For these models the panel LBI or LBIU tests can be used and the corresponding statistics have a distributional structure similar to the panel AR unit root tests discussed in this paper.
Details are reported in Tanaka (2018) .
5. APPENDIX: PROOFS OF THEOREMS
Proof of Thereom 1: We first deal with Model D. Given the OLSEs α ˆ
iand β ˆ
iof α
iand β
i, respectively,
the OLS residual is
ˆ
Ș
it= yit− − Į ˆi ȕ ˆ
it
ȕ ˆ
it
=Ș
it−
Ts=1
s
2− t Ts=1s
Ts=1Ș
is+ tT −
Ts=1s
Ts=1s Ș
is
T
Ts=1s
2−
Ts=1s
2= Șit− 4 T − 6 t
T
2T s=1
Ș
is− 12 t
T
3− 6 + ( )
T
2T s=1
s Ș
isO
pT
−1.
The continuous mapping theorem (CMT) yields, as T →∞ with N fixed,
U
iT= 1 − = − − −
T ı
2T
t=2
Ș ˆ
i,t−1Ș ˆ
itȘ ˆ
i,t−11
2 T ı
2Ș ˆ
iT2Ș ˆ
2i1 Tt=2
Ș ˆ
itȘ ˆ
i,t−1 2= 1 + − − −
2 T ı
2Ș
iT2 T
T t=1
Ș
it6 T
2T t=1
t Ș
it2
4
T
T t=1
Ș
it6 T
2T t=1
t Ș
it 2T t=2
Ș
itȘ
i,t−1 2o
p− − + (1)
U
i= (1)+2 (r ) −6 (r )
⇒ 1 2 Yi
1
0
Y
idr
10
r Y
idr
2
4
10
Y
10
r Y
i 21
0
Y (r)i −( 4 − 6 r
1 (s)
0
Y
ids
r
10
s Y
ids dY
i,
V
iT= 1 T2ı
2
T
t=2
Ș ˆ
i,t2−1= 1 − − − −
T
2ı
2T t=2
Ș
i,t−14 T
6
( t− 1) 12 ( t− 1)
T
2T s=1
Ș
isT
36 T
2T s=1
s Ș
is 2V
i=
⇒
10
2
dr .
− 6 − 1
− (r) dr (r) dr
= )
(r )
(s )
−(12 −6)
Y (r)i −(4−6 r
1 (s)
0
Y
ids
) r 1
0
s Y (s)i ds
−( 12 − 6 )
Thus the relation (12) is proved for Model D by the CMT.
We next deal with Model B, for which the OLSEs α ˆ and β ˆ of α and β are given by ˆ
Į ȕ ˆ = I
N⊗i
T( ) iN ⊗d
T I
N ⊗i
T i
N ⊗d
T
−1