INVITED PAPER Special Section on Intelligent Transport Systems
Mobility Innovation “Another CASE”
Koji OGURI†a), Haruki KAWANAKA†,andShintaro ONO†,††,Members
SUMMARY The environment surrounding automotive technology is undergoing a major transformation. In particular, as technological in- novation advances in new areas called “CASE” such as Connected, Au- tonomous/Automated, Shared, and Electric, various research activities are underway. However, this is an approach from the standpoint of the automo- bile centered, and when considering the development of a new automobile society, it is necessary to consider from the standpoint of “human centered,”
who are users, too. Therefore, this paper proposes the possibility of tech- nological innovation in the area of “Another CASE” such as Comfortable, Accessible, Safety, and Enjoy/Exciting, and introduces the contents of some interesting researches.
key words: CASE, new health care, in-vehicle, state estimation, mobility
1. Introduction
At the Paris Motor Show in Paris, France, on the last day of September 2016, Daimler AG CEO and Mercedes- Benz Chairman Dr. Dieter Zetsche introduced Mercedes’s medium- to long-term strategies in 4 areas of Connected, Autonomous/Automated, Shared, and Electric. At this time the word of “CASE” was used for the first time in the world.
“Connected” means that a vehicle functions as an in- formation communication terminal, and various data such as vehicle conditions and surrounding road conditions are acquired by onboard sensors, and these are integrated and analyzed via an information network, thereby creating vari- ous new values for the vehicle.
“Autonomous” is the driverless, self-driving car that is the most competitive. In 2020, each company developed Level 3 self-driving vehicles, and aims to achieve Level 4 on expressways by 2025[1]. Autonomous driving is a trend not only in passenger cars but also in the truck industry.
The realization of fully automatic driving on expressways is attracting the most attention. The introduction of automatic driving in the truck industry is expected to greatly improve long working hours and labor shortages. Automatic driving is expected to improve safety, reduce the burden of driving, and reduce traffic congestion.
“Shared” specifically refers to car-sharing and ride- sharing. Car sharing is a system in which a car is not owned by an individual but is used by multiple people when needed
Manuscript received August 18, 2020.
Manuscript revised October 6, 2020.
†The authors are with Aichi Prefectual University, Nagakute- shi, 480-1198 Japan.
††The author is with The University of Tokyo, Tokyo, 153-8505 Japan.
a) E-mail: [email protected] DOI: 10.1587/transfun.2020TSI0001
Table 1 Another CASE.
Automobile Centered Human Centered
Connected Comfortable
Autonomous/Automated Accessible
Shared Safety
Electric Enjoy/Exciting
at different times. Ride sharing is a system in which multiple people use the same car at the same time. Global players include Uber and Lift in the U.S., DiDi in China, Grab in Singapore, and Ola in India.
“Electric” means electrification of automobiles. This is expected to be an effective trump card in addressing envi- ronmental issues such as global warming, exhaust emissions, and CO2. In addition, sales of new electric vehicles are rising in Europe, the United States, and China, and competition to take the lead in competition with other countries is intensi- fying by supporting the electric vehicle industry. Since then, the global automobile industry has been engaged technolog- ical competition in new fields under the keyword “CASE”.
This keyword is an expression from the viewpoint of automobile centered, and when considering the develop- ment of a new automobile society, it is necessary to con- sider “Technological innovation from the viewpoint of hu- man centered”. Therefore, this paper proposes the possibil- ity of technological innovation in new fields from the four viewpoints of “Comfortable,” “Accessible,” “Safety,” and
“Enjoy/Exciting” by focusing on human beings as “Another
‘CASE’ ”. This is explained in detail below.
2. Comfortable
“Comfortable” in this context may be considered to mean
“relax.”. This term refers to a state of physical and men- tal comfort. Until now, “motor vehicle” has been a tool for transportation and a machine for carrying people or things to their destination. Therefore, “driving” “braking” and “turn- ing” have been important factors required for automobiles.
However, in the new mobile society of the future, in addition to these functions, I believe that cars will represent a “com- fort” environment both physically and mentally. This paper looks at the health aspect when someone is in a car.
2.1 Disease Detection and Treatment
Health is of universal value to mankind. Current medicine tries to maintain health by identifying and treating diseases.
Copyright © 2021 The Institute of Electronics, Information and Communication Engineers
For this reason, many studies have been conducted on the development of various diagnostic devices for early detection of diseases, their therapeutic methods, and manufacturing drugs. In particular, inventions such as electrocardiograms, CT, MRI, and the others significantly contribute to disease diagnosis and inventors of such devices have been awarded the Nobel Prize. However, all of these medical devices are expensive and require measurement and diagnosis by specialized technicians and doctors. A person becomes sick and goes to the hospital, where he or she is examined for the first time and is provided a definite diagnosis. However, under the medical model of “detect and treat a disease” the goal is to cure a disease, not to maintain daily comfort.
2.2 New Healthcare
Medical examinations are widely performed to diagnose dis- eases based on the results of blood tests, electrocardiograms, and chest X-rays. However, it is not easy to perform such examinations, for example, examinations requiring special measuring equipment, or requiring a doctor, nurse, or clin- ical laboratory technician to perform them. Some of these examinations are performed about once a year. In contrast„
checking the physical condition on a daily basis through daily monitoring with a simple biomedical signal measuring de- vice such as a wearable sensor is referred to herein as New Healthcare.
New Healthcare requires daily exercise checks and the ability to quantify changes in the state of biomedical signals in daily life for routine health management. These include daily steps, exercise, and heart and breathing rates.
With the development of electronics and development of highly functional materials, sensors are becoming more sophisticated and smaller in size. Now, changes in blood pressure and oxygen concentration in the blood can also be monitored daily. A research on a method for estimating blood pressure without using a cuff is in an advanced stage and our group proposed [2]–[8] a method for estimating blood pressure values using photoplethysmographic (PPG) signals alone[9],[10], without using a cuff.
Figure 1 shows the geometrical characteristics of pulse waves and acceleration plethysmography (APG). The pulse wave is mainly composed of a percussion wave (PW) consist- ing of the blood ejection of the heart and a tidal wave (TW) reflected by the blood vessel wall. The pulse wave also in- cludes a dicrotic notch and dicrotic wave (DW) caused by closure of heart pulses. In many cases, the wave height or time interval of each component is affected by PW, TW, a pre-ejection wave, dicrotic notch and DW under the condi- tion of the arterial system. APG is a second derivative of the pulse wave, and it is said that the characteristics of the wave- form are related to cardiac output and peripheral vascular resistance.
The flow of systolic blood pressure (SBP) estimation using the Convolutional Neural Network (CNN) is shown in Fig. 2. VPG means velocity plethysmography, which is the first derivative of pulse wave. CNN is a common struc-
Fig. 1 Geometrical characteristics of a pulse wave and acceleration plethysmography.
Fig. 2 Blood pressure estimation by CNN.
Fig. 3 Result of blood pressure estimation.
ture for deep learning, and this neural network is trained to output SBP when inputting PPG, VPG, and APG signals.
Effective features can be automatically extracted from pulse wave signals, and SBP with those features can be estimated [9],[10]. Figure 3 shows the result of SBP estimation using this method. The horizontal axis represents the measured SBP, and the vertical axis represents the estimated result.
The correlation coefficient between the estimated SBP value and the measured SBP value was 0.63. The measured and estimated values are correlated to some extent,therefore, it is suggested that SBP can be estimated from PPG without using a cuff.
Such biomedical data are accumulated in the cloud and by regularly analyzing changes through big data analysis, it is possible to monitor changes in physical conditions and
estimate health conditions.
2.3 In-Vehicle Physical Condition Checkup
Now, what about the accuracy of biomedical signals mea- sured by wearable sensors, for example, a wristband heart rate monitor? These sensors are now available with a num- ber of products, including the Apple Watch, Fitbit, and so on. These sensors were initially considered inaccurate, error- prone, and unreliable but their accuracy has been gradually improving.
The reason for a problem in the accuracy of such wear- able sensor devices is that measurement errors such as body movement and sweating in daily life are easily included.
Also, in the data analysis, the biological signal is affected by the difference in the environment in which the subject is placed, therefore, accurate analysis may not be possible. For example, heart rate generally increases when the subject is in a state of tension temporarily, but heart rate also increases when the subject is not in a good physical condition, there- fore, it is difficult to make a distinction based on the heart rate alone.
To eliminate noise as much as possible and accurately measure biological signals in a hospital in response to the characteristics of the biological signal, it is always necessary to measure the biological signals by resting a subject. How- ever, with this method, it is possible to know the biological signal only at the time of inspection, making it difficult to monitor the biological signal for a long time. In contrast, the use of wearable sensors makes it possible to monitor signals over a long period of time, but there are problems such as body movement and signal noise that cannot be eliminated.
We propose an in-vehicle physical condition checkup.
In a vehicle, an occupant sits on a seat and has a fixed posture so that the influence of body movement can be eliminated to some extent when measuring a biological signal. In addi- tion, as the sensor is mounted on the vehicle, it is possible to measure a signal with high reliability by enabling the in- stallation position and supply of sufficient electric power, as compared with the wearable sensor. The onboard sen- sor can be installed at various places in a vehicle such as a steering wheel, a steering column, a seat, a seat belt, and a dashboard. The biomedical fields that can be measured from such an on-vehicle sensor includes heartbeat, electro- cardiogram, respiration, pulse, blood pressure fluctuation, body motion, face orientation, line of sight, eyes that open or close, and other biomedical information.
When an abnormality such as a disease affects the hu- man body, it is indicated through biological signals such as a rise in body temperature or blood pressure. However, under conditions such as drowsiness, fatigue, tension, and inat- tention, the biological signals are temporary, and it is very difficult to estimate the correct state of the driver[11]–[19].
In the medical field, there are cases where the state of a body is judged by measuring the change when certain it experiences external stress or load. For example, the car- diac stress test is used to examine cardiac function. This is
an electrocardiographic test in which changes in the elec- trocardiogram, arrhythmia, and blood pressure that are not apparent at rest are observed when the driver being examined is exercising, The results of these tests reveal the condition of the heart of the driver being examined.
Driving can be of considered as a situation affecting mental stress. For example, by monitoring changes in the driver’s biomedical signals according to different driving en- vironments, such as during normal driving and traffic con- gestion, it is possible to detect changes in physical conditions that cannot be measured at rest similar to the cardiac stress test by analyzing the differences. Furthermore, it is known that there is a diurnal fluctuation in biomedical signals, which is affected by the time of measurement even within a day.
In this regard, when using a car for commuting or regular work, it is possible to compare and examine changes in daily biomedical signals by driving a car in approximately the same time zone.
In our research, we derived the result that it is possible to predict the sleepiness of a driver at an early stage by analyzing the information of sleep of the driver and the bio- signals during driving[20],[21].
Table 2 shows the drowsiness level from facial expres- sions. Figure 4 shows changes in sleepiness over time and at a time when the driver reaches the critical drowsiness level.
Drowsiness tends to increase with the elapsed driving time due to accumulation of fatigue, and as shown in Fig. 4, the arousal level gradually decreases from level 1 to level 2 or 3.
In this research[20],[21], drowsiness level 3 is defined as a state of decreased alertness, and as shown in Fig. 4, the time from the start of driving to the arrival at drowsiness level 3 is called as the time to reach the critical drowsiness level and analyzed experimentally.
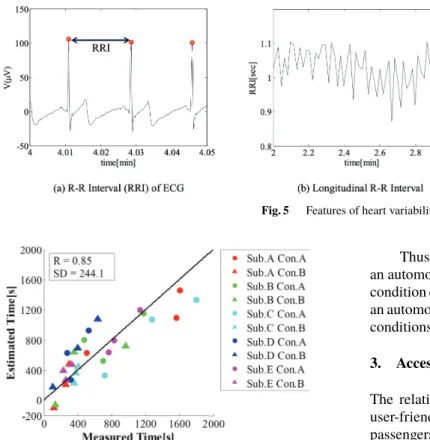
Figure 5 shows the features of heart rate variability used in this analysis. Figure 5(b) is a typical example of a time series of R-R Interval (RRI) extracted from electrocardio-
Table 2 Drowsiness level from facial expression.
Drowsiness Level Video image indicators
1. Not drowsy Moving eye-gaze quickly and frequently.
Constant eye blink cycle.
2. Slightly drowsy Slow eye-gaze movement. The mouth opens.
3. Moderately drowsy Blink eyes slowly. The mouth moves.
4. Significantly drowsy Subjects are likely to blink consciously.
Unnecessary physical movement.
5. Extremely drowsy Subjects’ hand lean backward and forward.
Close eyelids.
Fig. 4 Definition of a time when the driver reaches the critical drowsiness level.
Fig. 5 Features of heart variability.
Fig. 6 Prediction from both before driving and while driving information in the first minutes.
gram (Fig. 5(a)). Sympathetic Nerve Activity (SNA) can be obtained by transforming this data to a frequency sequence using Fast Fourier Transform. As shown in Fig. 5(c), Low Frequency (LF) is defined as the integrated value whose range is 0.04–0.15 Hz of obtained heart rate variability’s fre- quency band (a range of frequency sequence). In the same way, High Frequency (HF) is defined as the integrated value whose range is 0.15–0.45 Hz.
According to this method, a time when the driver reaches the critical drowsiness level can be predicted by analyzing the biomedical data of the driver before driving and the data of the driver for one minute after the start of driving. Figure 6 shows the experimental results. Condition A (Con. A) was defined when the sleep time on the day be- fore the experiment was the same as usual, and Condition B (Con. B) was defined when the sleep time was shorter than usual. When the drowsiness level was evaluated and the time to reach the critical drowsiness level was measured while operating a driving simulator a significant difference was observed in the time to reach the critical drowsiness level depending on the state before driving. The horizontal axis of Fig. 9 represents measurement results (measured reach time), and the vertical axis represents estimation results (predicted reach time). This was a correlation coefficient of 0.85 with standard deviation (SD) of 244.1 seconds. This means that the time until the drowsiness level of the driver becomes 3 in one minute after the start of the operation (driving) can be estimated with an error of about four minutes.
Thus, in the future, it is expected that the interior of an automobile will be used as a place for in-vehicle physical condition checkups, not only as a space for driving or moving an automobile, but also as a space for checking daily physical conditions.
3. Accessible
The relationship between a car and a person needs to be user-friendly. In other words, it is difficult for drivers and passengers to understand the state of a car if the function of the car is improved by the installation of the latest technol- ogy or if the driving operation is automated. For example, when a vehicle starts, stops, or turns to the right or left with- out the driver’s intention due to system intervention such as automatic driving, the driver may feel uncomfortable or experience fear.
The vehicle estimates the driver’s intention and is re- quired to operate in accordance with the driver’s and pas- senger’s intentions. Alternatively, it is important to inform the driver and the occupant of the movement of the vehicle.
Even now, it announces through sound when reversing and when turning right or left. This can be said to be part of the communication between the driver’s intention and the vehi- cle but as automation advances in the future, it is desirable to develop a new interface that is easier to understand in order to cope with these points[22],[23].
Also, the current infrastructure environment, such as traffic lights, intersections, white lines, and pedestrian cross- ings, is not necessarily suitable for the CASE era. These infrastructures also need to be more secure and easy to use [24]–[26].
4. Safety
The most important factor in considering mobility is safety.
At present, however, the number of deaths from traffic acci- dents and accidents around the world continues to increase.
The main cause is human error. If all cars become Level 5 Autonomous vehicles in the future, most traffic accidents will be eliminated and a safe society could be realized but it is not yet clear when such an era will be realized.
Various safety devices have been developed on the ve-
Fig. 7 Real image-type driving simulator.
hicle side, such as the Autonomous Emergency Braking Sys- tem, Lane Keeping Assist System, Erroneous Acceleration Control System, etc. but above all, it is important to improve the safety awareness of the driver and execute safe driving without depending on such devices.
To address these issues, various studies have been con- ducted on the analysis of safe driving behavior of drivers [27]–[31].
Our group has developed a system to evaluate hazard perception performance using a real image-type driving sim- ulator (Fig. 7)[32]. In this system, the hazardous portions within the view are determined in advance by referring to the line of sight information of multiple instructors in a driving school.
Experiments were performed with the protocol shown in Fig. 8. First, the subject gets used to the operation of the driving simulator, and drives for the first time. The gaze data of the driver is recorded during driving. After the first drive, instructions for safe driving are given while replaying the recorded gaze data of the driver. Figure 9 shows the teaching screen. In this example, attention to the intersection and the bicycle is checked, and the red color indicates more prior
Fig. 8 Experimental protocol to evaluate hazard perception performance.
Fig. 9 Replay teaching screen to display hazardous area and gaze of the first drive (e.g. Teaching intersection and bicycle).
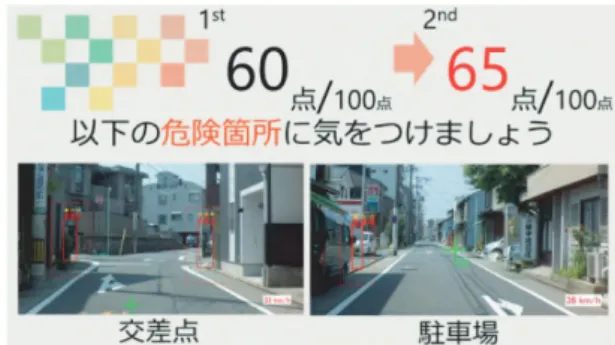
Fig. 10 Review screen to display the score and weak points (e.g. Teaching intersection and parking).
hazard. The “+” indicates the position of the gaze of the driver at that time. Next, the second drive is performed by using another course.
Since it is effective to provide clues for recollection in order to efficiently memorize information for elderly people with impaired episodic memory ability, the review screen as shown in Fig. 10 is displayed after the teaching screen.
In Fig. 10, the score of the first drive with 60 points and the second drive with 65 points is displayed. The score indicates how much the hazard could be confirmed in the scenario, and it has been scored by a original method[32]. In addition, on the review screen, hazards that are not good are taught. For example, as shown Fig. 10, an intersection and a parking area exit have been extracted as hazards that are weak points for the subject. By teaching the safe driving using this system, it was proved that the hazard perception ability was improved in the second drive from the first drive.
The experiment for the elderly especially showed that the safety consciousness in the automobile driving of the elderly driver was improved, and that the safe driving con- sciousness was improved on the drive simulator. Figure 11 shows the experimental results. The horizontal axis indi- cates the teaching pattern, and the vertical axis indicates the driving evaluation score. In order to pay attention to the
Fig. 11 Change in score before and after instruction.
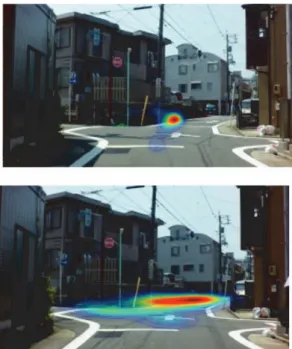
Fig. 12 Fixation map of gaze in the 1st drive (upper) and the 2nd drive (lower).
difference in teaching effect due to the difference in teaching method, the subjects were divided into 3 groups and inves- tigated. Group A (All) was taught using both the teaching screen (Fig. 9) and the review screen (Fig. 10). Group B (No Hazard) taught using both the teaching screen and the review screen, but the teaching screen did not display the hazard area, but only displayed gaze information and vehicle velocity. Group C (No review) taught only on the teach- ing screen, and did not provide a review screen after the teaching screen. In the case without reviewing, the result of the second score decreased, but it was shown that the result was significantly improved by teaching by replay. Figure 12 shows the fixation map of the driver’s gaze at the intersec- tion. In the second drive, the size of gaze became larger to pay attention to a wider area.
In this study, a driving simulator using real images was used (Fig. 7), and there are some reports on such driving simulators and train simulators[36]–[41]. A driving sim- ulator using real images gives more reality with lower cost than a driving simulator using conventional CG, and the real images are more effective for hazard perception test.
5. Enjoy/Exciting
Driving in a car creates a feeling of driving exhilaration, beautiful scenery and encounters with people, and gives peo- ple enjoy and excitement. In addition to this, here is another pleasure. Cars are increasingly used not only for transporta- tion but also for other purposes. Recently, for example, we can easily find hamburgers, pizza and other kitchen cars in events. It is common for quite a few business people not to have their own restaurants and just use kitchen cars to go around events in various places.
In the time of disaster, the number of people who park their cars in parking lots and evacuate by car is increasing.
In 2020, COVID-19 spreads around the world. As a result, the instances of remote working are increasing around the world. Various problems have been pointed out in the housing situation in Japan. The reason is that, it is difficult for two people to work remotely in one house. For example, it is difficult to have a video conference on important matters in a family home. Under these circumstances, Nissan Motor Co., Ltd. is advocating use of private cars for remote work under the catchphrase “one more room”[33].
As more cars become electric, cars are no longer just tools for only moving around these could be considered sim- ilar to another room in the garage. If you can connect to the internet, sometimes you can pull your car out of the garage and move to a scenic spot. It is necessary to further improve the functions of such vehicles as “one more room” in the future.
At the Consumer Electronics Show (CES) in Las Vegas in January 2018, Toyota announced the concept of the e- Palette[34]. In any case, the concept of “vehicle” as a space where you can enjoy another work room, study room, or hobby room, will be required in the future.
6. Conclusion
The environment surrounding automobile technology is un- dergoing a period of major change that is said to occur once every 100 years. In particular, various technological inno- vations are occurring in new areas called “CASE” such as Connected, Autonomous/Automated, Shared, and Electric.
However, from the standpoint of automobile use, and con- sidering the development of a new automobile society, it is necessary to consider from the standpoint of human re- quirements. Therefore, this paper proposes the possibility of technological innovation in the area of “Another CASE” such as Comfortable, Accessible, Safety, and Enjoy/Exciting.
For example, in an in-vehicle health checkup, health conditions are checked every time a car is driven and the accumulated data can be used as a new health management indicator. Also, in the event of a disaster, when you use your car as an evacuation site, you can live an evacuated life while checking your physical condition. In addition, this paper describes that safe driving is realized not only by avoiding accidents depending on the intervention of a system
such as a driver support system and an automatic driving function, but also by improving the hazard perception ability of a driver. Next, the effect of the hazard perception ability evaluation system by the real image type drive simulator was introduced. Mobility of the future will be able to evolve into a more attractive world based on the double “CASE” of human centered and automobile centered.
Acknowledgments
A part of this research was supported by the COI STREAM/JST “Nagoya University COI[35]: Center Of In- novation program” of the Ministry of Education, Culture, Sports, Science and Technology.
References
[1] SAE J 3016 Levels of Driving Automation, https://www.sae.org, accessed Sept. 25. 2020.
[2] H. Nishio, Md. S. Bhuiyan, H. Kawasaki and K. Oguri, “Estimating cuffless blood pressure using standardized features by pulse wave interval under variable measuring positions,” Int’l Conf. IEEE Uni- versal Village (UV), 2016.
[3] W.H. Lin, H. Wang, O.W. Samuel, and G. Li, “Using a new PPG indicator to increase the accuracy of PTT-based continuous cuff less blood pressure estimation,” Int’l Conf. IEEE Eng. Med. & Bio.
(EMBC), pp.738–741, 2017.
[4] F. Miao, X. Liu, and Y. Li, “A novel deep learning based approach for continuous blood pressure estimation,” Int’l Conf. IEEE Eng. Med.
& Bio. (EMBC), pp.1851–1854, 2017.
[5] S.N. Shukla, “Estimation of blood pressure from non-invasive data,”
Int’l Conf. IEEE Eng. Med. & Bio. (EMBC), pp.1772–1775, 2017.
[6] Y. Kishimoto, H. Kawasaki, and K. Oguri, “Cuffless blood pressure estimation by non-linear regression analysis with correction learn- ing,” Int’l Conf. Ubiquitous Healthcare (u-health care), pp.63–66, 2015.
[7] K. Takazawa and M. Fujita, “Clinical efficacy of the second derivative of aplethysmogram (accelerationplethysmogram),” J. Cardiol, vol.23 (suppl. XXXVII), pp.207–217, 1993.
[8] Y. Le Cun, F.-J. Huang, and L. Bottu, “Learning methods for generic object recognition with inclusion to pose and lighting,” Proc.
CVPR’04, IEEE Press, 2004.
[9] K. Atomi, H. Kawanaka, Md. S. Bhuiyan, and K. Oguri, “Cuffless blood pressure estimation based on data-oriented continuous health monitoring system,” Cput. Math. Methods in Medicine (CMMM), vol.2017, 2017.
[10] S. Shimazaki, Md. S. Bhuiyan, H. Kawanaka, and K. Oguri, “Fea- tures extraction for cuffless blood pressure estimation by autoencoder from photoplethysmography,” 40 Annual International Conference of the IEEE Engineering in Medicine and Biology Society (EMBC 2018), pp.2857–2860, 2018.
[11] M. Kutila, M. Jokela, G. Markkula, and M.R. Rue, “Driver distortion detec-tion with a camera vision system,” Proc. 14th International IEEE Conference on Image Processing, pp.VI201–204, 2007.
[12] Q. Ji, Z. Zhu, and P. Lan, “Real-time nonintrusive monitoring and prediction of driver fatigue,” IEEE Trans. Veh. Technol., vol.53, no.4, pp.1052–1068, 2004.
[13] P. Smith, M. Shah, and N. da Vitoria Lobo, “Determining driver visual attention with one camera,” IEEE Trans. Veh. Technol., vol.4, no.4, pp.205–218, 2003.
[14] L.M. Bergasa, J. Nuevo, M.A. Sotelo, R. Barea, and M.E. Lopez,
“Real-time system for monitoring driver vigilance,” IEEE Trans.
Intell. Transp. Syst., vol.7, no.1, pp.64–77, 2006.
[15] Y. Hirata, J. Nishiyama, and S. Kinoshita, “Detection and prediction
of drowsi-ness by reflexive eye movements,” Proc. 31st International IEEE Conference on Engineering in Medicine and Biology Society, pp.4015–4018, 2009.
[16] A. Giusti, C. Zocchi, and A. Rovetta, “A noninvasive system for evaluating driver vigilance level examining both physiological and mechanical data,” IEEE Trans. Intell. Transp. Syst., vol.10, no.1, pp.127–134, 2009.
[17] I. Damousis and D. Tzovaras, “Fuzzy fusion of eyelid activity in- dicators for hypovigilance-related accident prediction,” IEEE Trans.
Intell. Transp. Syst., vol.9, no.3, pp.491–500, 2008.
[18] P. Caffier, U. Erdmann, and P. Ullsperger, “Experimental evaluation of eye-blink parameters as a drowsiness measure,” Eur. J. Appl.
Physiol., vol.89, no.3-4, pp.319–325, 2003.
[19] S.K. Lal and A. Craig, “Reproducibility of the spectral components of the elec-troencephalogram during driver fatigue,” Int. J. Psychophys- iol., vol.55, no.2, pp.137–143, 2005.
[20] Y. Hayata, Md. S. Bhuiyan, H. Kawanaka, and K. Oguri, “Pre- diction of the time when a driver reaches critical drowsiness level based on driver monitoring before and while driving,” Proc. 16th International IEEE Annual Conference on Intelligent Transportation Systems (ITSC 2013), pp.106–111, 2013.
[21] Y. Hayata, Y. Iribe, Md. S. Bhuyan, H. Kawanaka, and K. Oguri,
“Determining relationship of different driver states and driving based on Gaussian mixture model,” Proc. 21st ITS World Congress (ITSWC 2014), 13130, pp.1–10, 2014.
[22] S.M. Petermeijer, D.A. Abbink, M. Mulder, and J.C. de Winter, “The effect of haptic support systems on driver performance: A literature survey,” IEEE Trans. Haptics, vol.8, no.4, pp.467–479, 2015.
[23] M. Marcano, S. Diaz, J. Pérez, and E. Irigoyen, “A review of shared control for automated vehicles: Theory and applications,” IEEE Trans. Human–Mach. Syst., vol.50, no.6, pp.475–491, 2020.
[24] S. Ranka, A. Rangarajan, L. Elefteriadou, S. Srinivasan, E. Poasada, D. Hoffman, R. Ponnulari, J. Dilmore, and T. Byron, “A vision of smart traffic infrastructure for traditional, connected, and au- tonomous vehicles,” International Conference on Connected and Au- tonomous Driving, pp.1–8, 2020.
[25] H. Lengyel, T. Tettamanti, and Z. Szalay, “Conflicts of automated driving with conventional traffic infrastructure,” IEEE Access, vol.8, pp.163280–163297, 2020.
[26] Y. Liu, M. Tight, Q. Sun, and R. Kang, “A systematic review: Road infrastructure requirement for connected and autonomous vehicles (CAVs),” J. Physics: Conference Series, vol.1187, no.4, pp.1–13, 2019.
[27] J. Crick and F.P. McKenna, “Hazard acceptance: Can it be trained?,”
Behavioral Research in Road Safety, vol.2, pp.100–107, 1991.
[28] K. Renge, “Diver’s hazard and risk perception, confidence in safe driving, and choice of speed,” IATSS Research, vol.22, no.2, pp.103–
110, 1998.
[29] R.B. Isler, N.J. Starkey, and A.R. Williamson, “Video-based road commentary training improvements hazard acceptance of young drivers in a dual task,” Accident Analysis & Prevention, vol.41, no.3, pp.445–452, 2009.
[30] D.S. Wooling, “Fixation maps: Quantifying eyemovement traces,”
Proc. Symposium on Eye Tracking Research & Applications, pp.31–
36, 2002.
[31] K.K. Ball, B.L. Beard, D.L. Roenker, R.L. Miller, and D.S. Griggs,
“Age and visual search: Expanding the useful field of view,” J. Opt.
Soc. Am., A., vol.5, no.12, pp.2210–2219, 1988.
[32] K. Torii, H. Kawanaka, and K. Oguri, “Verification of the effective- ness of the replay teaching method for elderly driver’s performance estimation simulator,” Trans. Electronics, Information and Systems (IEEJ), vol.139, no.12, pp.1400–1406, 2019 (in Japanese).
[33] One more room, http://www.nissan.co.jp/SOCIAL/CAMP/ONEMO REROOM/, accessed Sept. 25. 2020.
[34] e-Palette, https://global.toyota/jp/newsroom/corporate/20508200.
html, accessed Sept. 25. 2020.
[35] Nagoya University COI, http://www.coi.nagoya-u.ac.jp, accessed
Sept. 25. 2020.
[36] S. Ono, K. Ogawara, M. Kagesawa, H. Kawasaki, M. Onuki, K.
Honda, and K. Ikeuchi, “Development of photo-realistic and interac- tive driving view generator by synthesizing real image and artificial geometry model,” International Journal of ITS Research, vol.3, no.1, pp.19–27, 2005.
[37] R. Sato, S. Ono, H. Kawasaki, and K. Ikeuchi, “Photo-realistic driv- ing simulator using eigen texture and real-time restoration techniques by GPU,” International Journal of ITS Research, vol.6, no.2, pp.87–
95, 2008.
[38] Traim Simulators, ONGAKUKAN Co., Ltd., https://www.ongakuka n.co.jp/en/business/train_simulator/, accessed Sept. 25. 2020.
[39] Real Video Drive Player, TOYO Corporation, https://www.toyo.co.
jp/mecha/products/detail/toyo-iwane-rvdp.html, accessed Sept. 25.
2020.
[40] M. Kokubun, H. Konishi, K. Higuchi, T. Kurahashi, Y. Umemura, and H. Nishi, “Assessment of drivers’ risk perception using a simu- lator,” R&D Review of Toyota CRDL, vol.39, no.2, pp.9–15, 2004.
[41] M. Gerber, R. Schroeter, and J. Vehns, “A video-based automated driving simulator for automotive UI prototyping, UX and behaviour research,” International Conference on Automotive User Interfaces and Interactive Vehicular Applications, pp.14–23, 2019.
Koji Oguri received Dr. degree in Electri- cal and Information Engineering from Nagoya Institute of Technology in 1990. 1990–1994, assistant professor, Nagoya Institute of Technol- ogy, 1994–1998, associate professor, Aichi Pre- fectural University, 1998– professor, Aichi Pre- fectural University, 2012– Director, Institute of Information Science and Technology Aichi Pre- fectural University, 2012– Research Fellow, In- stitute of Industrial Science The University To- kyo, and 2013– Visiting professor, Institute of Innovation of Future Society Nagoya University. His specialty is biomedi- cal engineering and intelligent information processing. He is a member of IEEE, IEICE, IPSJ, and JAMA.
Haruki Kawanaka received the M.Sc. and Ph.D. in Engineering from the Nagoya Institute of Technology, Japan, in 2001 and 2005. From April 2005 to October 2005, he was a Post- doctoral Research Fellow at Chubu University, Japan. In November 2005, he joined the Fac- ulty of Information Science in Aichi Prefectural University as a Research Associate, becoming an Associate Professor in 2014. His research inter- ests are in Computer Vision and Pattern Recog- nition. He is a member of IEICE, IPSJ, IIEEJ, ITE, and IEEE.
Shintaro Ono is a project associate profes- sor of Institute of Industrial Science, The Univer- sity of Tokyo, Japan since 2013, and a visiting researcher of Aichi Prefectural University since 2017. He received Dr. degree in information science and technology from The Univ. of To- kyo in 2006. During 2017–2020, he worked as a senior researcher in Honda Research Institute Japan. His research interest includes sensing and visualization technology for advanced mobility and infrastructure. He is a member of IEICE, IPSJ, IEEJ, JSAE, and IEEE.