AN APPLICATION OF QUEUING THEORY
IN MISAKI FISHING PORT PLANNING
MASAJI SHIBA Tokyo University (Received December 4, 1959)
1. INTRODUCTION
The aim of this paper is to decide an appropriate size(Iength)of the wharf at Misaki fishing port by using the queuing theory.
These days, Japanese fishing vessels have been greately expanded both in number and tonnage. So, as a result almost all the fishing ports are suffering from limittedness of the wharf size. Misaki is one typical case of such fishing ports. Therefore, Fisheries Agency of the Japanese
f
~f
~
;;::
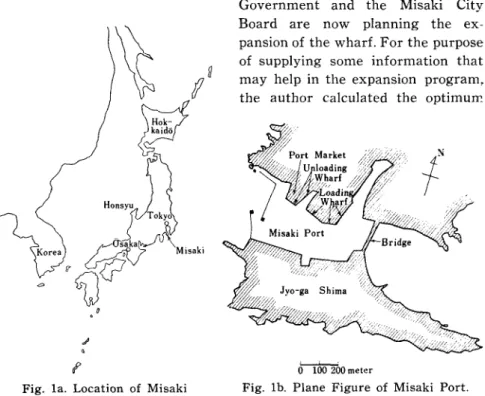
Fig. la. Location of Misaki
Government and the Misaki City Board are now planning the ex-pansion of the wharf. For the purpose of supplying some information that may help in the expansion program, the author calculated the optimuIr.
'---"--'
o 100 200 meter
size of the wharf, in view of minimizing both the cost of users and owner of the wharf.
2. SITUATION OF PORT···1
Fig. 1. shows the map of Misaki, including a sketch of the Misaki wharf. In the port, vessels land the fish at the unloading wharf first and without delay shift to the loading wharf to make preparations for the next voyage, and then leave the port.
At Misaki port, the unloading and loading (ice, food for crew etc.) are carried out at different wharfs. As the limittedness of the port is chiefly on the unloading wharf, the author has devoted his attention in this paper only to the unloading wharf.
3. SITUATION OF PORT··· 2
Misaki is one of the largest fishing ports in Japan, the annual landing is 64,079 ton and the value was
$
14,574,000 for 1958. Fish landed at Misaki is mainly of two species, tuna and skip-jack, and these are land-ed from tuna long line vessel and skip-Jack pole and line vessel respectively.Fig. 2 illustrates the seasonal variation of the total landing. Fig. 3a and Fig. 3b show the seasonal vari-ation of tuna and skip-jack landings and vessels respectively. As far as the limittedness of the wharf is concerned, it is enough to consider only the most characteristic condi-tion. Considering the following reasons, it is apparent that the
""
; 5'"
"
o-=
84Jan. Mar. May. Jul. S~pt. Nov. most characteristic condition occurs Month
from December to April. Fig 2. Seasonal Variation of Total
( i) Tuna is the dominant Landings in Misaki Port.
species landed, consisting of 85% of total landed, and especially the bulk of it is landed from December to April.
(ii) Skip-jack is landed only from May to July and in this season Tuna is very few.
c5 o f-"g4
'"
'"
]3
t:: .~ 2 . " C j 1Jan. Mar. May. Jul. Sept. Nov. Month
Fig 3a. Seasonal Variation of Tuna Landings in Misaki Port. 80 -;; en 70 ;:J > 60 '0 ....
'"
508"
z 40 ,x C x ' \ \ ~4 I \ I \ I \ .":1
; 3 I \ en , \"
I \ 0 I ,f2
I x,/,,--1 ·
\"'0!'~C
•
bIl C ;01 c " Landing'"
..J.
-.
.-.-
...
-
.
Jan. Mar. May. Jul. Sept. Nov. Month
Fig 3b. Seasonal Variation of Skip-jack Landings in Misaki Port. 200 -;;
'"
en'"
> 100 '0...
'"
.<> E"
Z 0less wharf space and shorter landing time than the tuna long line vessel. 4. DISTRIBUTION OF VESSELS ARRIVING FOR UNLOADING.
Fig. 4 shows the frequency distribution of the number of ves-sels arriving for unloading in a day. Dotted line of the figure shows Poisson distrbution with the same mean as the actual distribution. So the distribution of the arrival is assumed to be Poisson distribu-tion with mean 2.56.
1] =
t
1] 30o
'0 20 >-eActual x---x Poisson 1 2 3 4 5 6 Number of Vessels in a DayFig 4. Frequency Distribution of Vessels Arriving for Unloading
5. DISTRIBUTION OF UNLOADING TIME
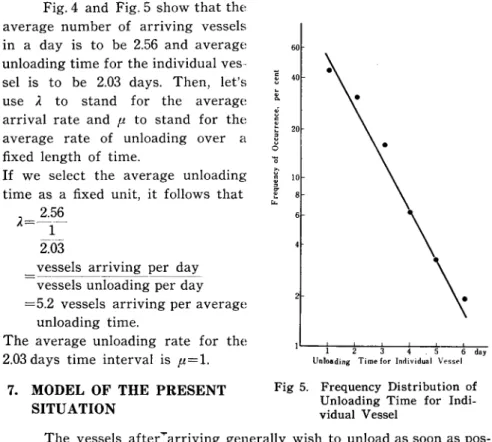
. Fig. 5 shows the frequency distribution of the unloading time for
individual vessel, which is plotted on the semi-logarithm section paper. Each points approximately fall on a straight line, so distribution of unloading time is assumed to be negative exponential with mean 2.03.
6. DEFINITION OF A AND p
Fig. 4 and Fig. 5 show that the average number of arriving vessels in a day is to be 2.56 and average unloading time for the individual ves-sel is to be 2.03 days. Then, let's use A to stand for the average arrival rate and p to stand for the average rate of unloading over a fixed length of time.
If we select the average unloading time as a fixed unit, it follows that
A=~5~
1
2.03
vessels arnvmg per day vessels unloading per day =5.2 vessels arriving per average
unloading time.
The average unloading rate for the 2.03 days time interval is p=1.
7. MODEL OF THE PRESENT SITUATION 60
·
40·
·
:!t!
20 Cl "0 ~ " 10·
·
0 e-t.. 2\
\
2 3 4 5 6 dayUnloading Time for Individual Vessel
Fig 5. Frequency Distribution of Unloading Time for Indi-vidual Vessel
The vessels after=-arriving generally wish to unload as soon as pos-sible, however, the wharf is frequently filled with unloading vessels. In spite of there being no~space!in the wharf, the new commers attach to the moored unloading vessels side
by side and unload beyond the moored vessels.
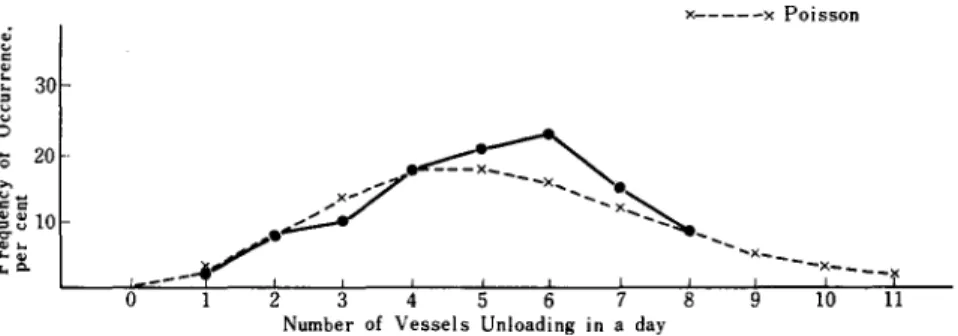
This situation, diagramed as in Fig. 6, can be applied to the gen-eral single-station queuing model (birth and death process). (see refer-ences (1) p 403) According to this
Wharf
model, the probability of exactly n moored vessels is given by a Poisson distribution, with mean AI fl. The solid line of Fig. 7 shows the actual
. - - . Actual x---x Poisson ,; .., c
'"
~ 30e
Cl-
0 20 .---o
2 3 4 5 6 7 8 9 10 11Number of Vessels Unloading in a day
Fig. 7. Frequency Distribution of the Number of Vessels Landing in a Day.
frequency distribution of the number of vessels landing in a day, and dotted line shows the Poisson distribution with Alfl=5.2.
As the theoretical distribution fits closely to the actual distribution, our model and value of AI fl seem to be reasonable.
Note. on the unloading time
If the lots of vessels arriving in the port causes a fast or slow landing, the value of
A./p.
would take a some-what different value. Fig. 8 shows the relation between number of vessels arrlvmg in a month and average unloading time of those Vessels. As the satisfactory empicical relation between them can not be found be-cause of the wide dispersion of points, remarkable effect of crowdedness of the port on the unloading is not to be seen. And the frequency distributions of the unloading day for individual vessel are also approximatly same negative exponential distribution as in Fig. 5 throughout a year.bIl C ~ 60 ... <: ~ 40 '"
'"
:> _ 20 o ...'"
..,
8"
Z•
•
•
•
•
•
• •
•
•
• •
1.6 1.8 2.0 2.2 2.4 day Average Unloading Time Fig. 8. Crowdedness of the Wharfin Relation to the Unload-ing Time.
8. HYPOTHESIS FOR THE CALCULATION
The landing over the moored vessels is quite undesirable and in-convenient and in addition, on windy days the damages of vessels often occur by the collision of one to the other.
In order to avoid this situation, Misaki Authorities expect to ex-pand the wharf to such an extent that it would be ready for mooring all the vessels even in the crowded season. Therefore, the author, in this paper, has attempted to calculate the optimum length of the wharf on the hypothesis that: the vessels have to moore directly to the wharf. If the wharf is filled, comming vessels have to wait untill an empty wharf occur.
9. CALCULATION OF THE WAITING TIME
To find the average waiting time
Tw
(in average unloading time unit of 2.03 days), the author used eq. 1 for the case of multichannel servicing facilities (see references (l) p 413)Po
T W =-P.S-C-SI-)-[l--
(AI
ps)j2-01
p.)8 . .... ·eq. 1 1where
PO=-'_l
(AI'-;;Y;-. (Alp)-'
~
- -
-+-~--
---n~O nl s/(l-J.lps)
s: refers to the number of the wharf units which enable just one vessel to moore in for unloading.
Table 1 and Fig. 9 illu-strates the results of calcula-tions of T w made for six,
se-ven, eight, nine and ten wharf units.
10. COST OF OWNERS OF VESSELS The days spent waiting for the empty wharf reduce the possible days of operation of vessels in a year. According
Table 1. Waiting Time Necessary for Corresponding Wharf Unit.
Tw
Number of
-Whar_~ uni~sl ~~:~;itU~loa~~ng
1 _ _ Day _6 0.445 0.903
7 0.150 0.305
8 0.050 0.102
9 0.020 0.041
to the Statistical Table of Ministry of Agriculture and Forestly of Japan
in 1958 (2), the annual total cost of
the tuna long line vessels (170-180 ton) is $ 92,922.
The cost of fishing, (supple-menting new gear for damaged ones, oil, bait and shares of crew) $ 68,436 are directly connected with the operation and the other costs are charged to the owners of the vessels,
~ E f: day 1.0 0.8 .. 0.6 :: ;; 0.4 0.2 6 7 8 9 10 Number of Wharf Units whether their vessels are operating
Fig. 9. Waiting Time of Vessels
or not. corresponded to the Number
So the annual and daily idle of Wharf Units.
cost of the vessels ($ 29,486 and $ 80.8 respectively) can be calculated by subtracting the cost of fishing implement, oil bait and shares of crew from total cost. Table 2 illustrats the cost of owners of vessels (or cost of users of the wharf) corresponding to individual wharf unit.
Table 2. Calculation of Wharf Users' Cost Number of' Waiting time Cost due to the waiting
harf unit' (day) : vessels (Cost of users w I : of the wharf) ($) - - - ' - - - -6 0.903 73.0 7 0_305 24.6 8 0,102 8.2 9 0.041 3.3 10 0,014 1.1
11. COST OF OWNER OF THE WHARF
2.56 vessels arrive in a day and the individual vessel requires 2.03
days landing time. Then, there would be required 2.03 x 2.56=5.2 wharf units. If the number of wharf units is less than 5.2, waiting line would become longer and longer. If there are six wharf units, 0.8 (=6-5.2) wharf units would become idle in a day, In the case of seven wharf
units, 1.8 would become idle and in the same way, we can calculate the number of idle wharf units on the occasion of eight, nine and ten wharf units.
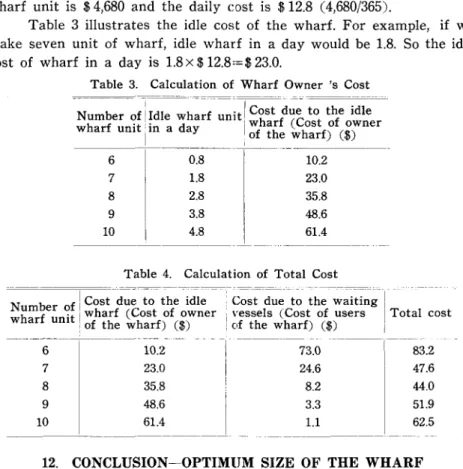
In Misaki port, the average tonnage of arrival vessels was 173 tons in 1958; so that the length of one wharf unit is estimated approximately at forty meteres including some allowance for mooring. According to Misaki City Authorities, the construction cost of the wharf is $ 1,170 per meter. So one wharf unit costs $ 1,170 x 40 m=$ 46,800. As the Authori-ties expect to clear off the debt within ten years, the annual cost of one wharf unit is $ 4,680 and the daily cost is $ 12.8 (4,680/365).
Table 3 illustrates the idle cost of the wharf. For example, if we make seven unit of wharf, idle wharf in a day would be 1.8. So the idle cost of wharf in a day is 1.8 x $12.8'=$ 23.0.
Table 3. Calculation of Wharf Owner's Cost
! . ·~==c I~--'_ .~~ = = = . =
Number of! Idle wharf unit I Cost due to the Idle
wharf unit: in a day I wharf (Cost of owner
I , of the wharf) ($) 6 0.8 10.2 7 1.8 23.0 8 2.8 35.8 9 3.8 48.6 10 4.8
1_
61.4 .. ---~----.~-Table 4. Calculation of Total Cost f I Cost
d:~o t~~~id~~=-(~~;;ue
to the waitingNumber <? I wharf (Cost of owner i vessels (Cost of users Total cost
wharf Unit ~ of the wharf) ($) • of the wharf) ($)
- - - -- - - -_.---- - - -6 10.2 73.0 83.2 7 23.0 24.6 47.6 8 35.8 8.2 44.0 9 48.6 3.3 51.9 10 61.4 1.1 62.5 ----~---~---~- _. --~---~--- ~
12. CONCLUSION-OPTIMUM SIZE OF THE WHARF
(owner of the wharf) and waiting ves-sels (user of the wharf). From Table 4 and Fig. 10, optimum wharf unit is eight, therefore optimum size of wharf is 40x8=320 meters.
As the present size of wharf at
$
90
80
Misaki port is 180 meters, expansion -;;
of wharf should be 140 meters.
~
6013. ACKNOWLEDGEMENTS 50
40
•
6 7 8 9 10
Number of Wharf Units The auther wishes to express his
appreciations to Pro£. Y. HIY AMA and
Prof. A. T AKAGI for their valuable
comments and Mr. M. KA TO for his
encouragement throughout this study. Fig. 10. Total Cost
correspond-ed to the Number of Wharf Units
14. REFERENCES
1) Churchman, Ackoff, Arnoff; " Introduction to Operations Re-search" Wiley 1957
2) Ministry of Agriculture and Forestry of Japan "Survey of Fishery Management in 1958"