Asymmetric Dependence of Hedge Fund Strategies
to the Market
著者名(英)
Midori Munechika
journal or
publication title
The economic review of Toyo University
volume
37
number
2
page range
237-258
year
2012-03
URL
http://id.nii.ac.jp/1060/00001749/
Creative Commons : 表示 - 非営利 - 改変禁止
東洋大学「経済論集」
37巻2号 2012年3月
Asymmetric Dependence of Hedge Fund Strategies to the Market
Midori Munechika
Abstract
The hedge fund industry is thc nlost foca|part ot1 the universe of altemative investments. A|though it is rec()gnized that their low corre|ations to market rcturns are attractivc l>atures. a nコ aj or source of risk ibr hedge hmds is s. till market risk, ThiS StUdy eXamineS the beta eXpoSures Ot’hedge{Ulld Stl・ategieS by using monthly hedge t’Und indeX retUmS data Oゴthe DOW Jones Credit Suissc Hedge Fund庁oln January |994 to Ju|y 20n. Thビresu]ts based on plecewise linear regression indicate that an asymmelric dependence〔}ftheir returns t【)the equity markct returns is pronoしtnced in certain strategies such as Event Driven. Mallaged Futurcs. and Emergillg Markets. This nonlinearity in dependence is onen ofaf()rm where retums arc more strongly corre|ated in down-markets than in up-markets. Howevcr, the sub-period analysis suggests that there is apossibility ofcha|1ging the nonlinear natures of lledge t’und retums in the periods of bull and bear markets. Especially、 beta asymmetrics ofthe strategies such as Event[)riven, Long/Short Equity、 Managed Futures、 and Multi-Strategy are reversed廿om the prior period to the financial crisisof2007-2009. The estimatcs prescnい1(}t only timing skill ot’hedge fUnd managers to pro、.ide investors downsidc protection but also their liquidity reaction related to their sellot}’s. during Periods of market-wide liquidity deteriorati〔m.Contents
1234p)6
Introduction Statistical Properties of Hcdge Fund Index Retums Risk-Return Decomposition tbr Separating Alpha from Beta NOnlincaritieS Timc-varying Beta Exposures in Bul|Verg. us Bear Stock Markets Concluding Remarks1.Introduction
プ One ofthe tastest-gro“・ing sectors ofasset management since the 1990 s has becn aiternative investments. Today alternative investments popularly mean lnvestments in non-traditional classes ofassets such as private equity、 hedge IUnds、 real estate, and commodities. The scope ofthe term L’alternative inve g. tments ”haswidened over the Iast decade and a broad series of assets and investment strategies has been involved. It is not easy to define clearly what is considered“non-traditional assets”and what is labeled“altemative assets” as a separate asset class. The te㎜‘’hedge血nd”generally describes any pooled investment vehicle that is privately organized, and administered by investment managers, Anson(2006)defines“altemative assets”as a subset of an existing asset class, in which different investment strategies are taken, not separate asset classes. For example, most hedge fUnd strategies use the purchase and sale of either equity or debt securities which belong in traditional classes of assets and their ability to create attractive risk-retum pro創es is derived from the equity or debt markets. Therefbre, hedge fUnds are characterized by their dynamic trading strategies not by location choice (Le., aSSet ClaSSeS). The hedge fUnd industry is the most vibrant part of the universe of alternative investments. It has remarkably increased both in terms of assets under management and number of fhnds over the last two decades. During the financial crisis of2007-2009, however, the hedge fVnd industry experienced net outHows and a large number of hedge fUnds were liquidated. Nonetheless hedge fUnds still continue to generate attractive uncorrelated returns to the markets. Today hedge fUnds are joining the mainstream and have become a perrnanent and significant feature of financial markets. Although it is recognized that their low correlations are attractive features fbr lnvestors, a m司or source of risk f()r hedge nmds is still market risk. Market risk is the risk of loss(or gain)arising f恒m unexpected changes in market prices such as security or commodity prices, or market rates such as interest or exchange rates. Using leverage and reducing hedging strategies can not only escalate market risk but also result in non-hnear risk exposures to the markets. This in turn, poses the issue of how to capture complicated characteristics of risk f()r hedge fUnds. A large number of studies have investigated the unique risk-retum profiles of hedge fUnds, often arguing that their retums tend to indicate an asymmetric sensitivity to the market. For instance, Mitchell and Pulvino(200D, Agarwal and Naik(2004), and Chan, Getmansky. Hass, and Lo(2005), as well as a large number of recent studies have Ibund that hedge fund retums related to market retums in a nonlinear way. The implications of such nonlinearity are important in risk management involving hedge fUnds and evaluating systemic risk in the hedge fUnd industry. The purpose of this study is to consider the nonlinear way in risk exposures of the hedge fUnd strategies to the equlty market by perfbrming the piecewise linear(i.e., spline)regression. This article updates and extends Munechika(2009)by using the piecewise linear regression model based on Mitchell and Pulvino (2001).This article is organized as fbllows. Section 2 describes the hedge fUnd data and reports the summary statistics. Section 3 explores an angle on perfbmance evaluation of hedge fimd strategies by decomposition
Asymmetric Dependence ofHedge Fund Strategies to the Market ofrisk-retum pro創e. Section 4 outlines our regression model using a linear spline with one knot and reports the estimated results. Section 5 carries out the sub-period analysis for the hedge fund strategies and considers its implications on the financial crisis of 2007-2009. Finally, Section 6 offers concluding remarks.
2.St飢istical Properties of Hedge Fund Index Returns
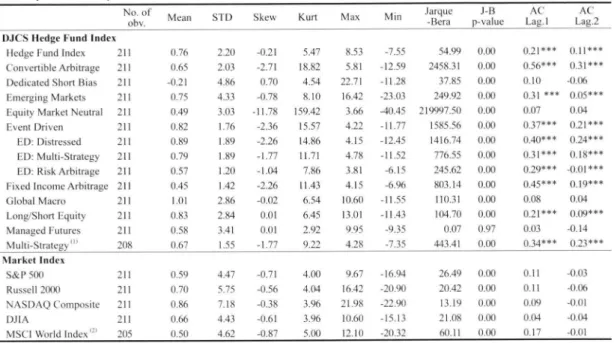
The data used in this study are the Dow Jones Credit Suisse Hedge Fund lndexes which are asset- weighted indexes calculated and rebalanced on a monthly basis, and reflect performance net of all hedge fund component perR)rmance fees and expenses. Credit Suisse Hedge lndex LLC and CME Group Index Services LLC compiles the indexes built from the Credit Suisse Hedge Fund Database, which tracks approximately 8.000fUnds and consist only of血nds with a minimum of$50 million under management, a one-year track record, and current audited financial statements. The Dow Jones Credit Suisse Hedge Fund lndex(herea丘er, known as“DJCS Hedge Fund Index” jis the broad index encompassing 451funds(as ofJune 201Dacross ten style-based sectors, which seeks to be representative of the entire hedge fimd industry launched on January 1,1994.The ibllowing ten indexes are included in the broad index:Convertible Arbitrage, Dedicated Short Bias, Emerging Markets, Equity Market-Neutra1, Event-Driven, Fixed-Income Arbitrage, Global Macro, Long-Short Equity, Managed Futures, and Multi Strategy. The asset-weighted index accounts lbr the size of fUnds by giving relatively more weight to the perfbmlances of larger hedge fUnds than those of small fUnds. This database accounts fbr survivorship bias in hedge fUnds(Billio, Getmansky, Lo and Pelizzon,2010)、 The period studied is from January l 994 to July 2011so, the data set includes the Mexican peso crisis of l994-1995, the Asian crisis of 1997, the Russian-, and the LTCM crises of 1998, the IT bubble burst of2000 and the financial crlsis of 2007-2009 a丘er the Quant Meltdown ofAugust 2007. Table l reports summary statistics fbr the monthly returns ofthe DJCS Hedge Fund Index with ten strategies including three sub-strategies, and fbr comparison, statistics fbr the market indexes are presented. The monthly total retum on the S&P 500, Russel12000, NSDAQ Composite, Dow Jones Industrial Average (DJIA)and MSCl World Index are included lbr stock market index-retums. Ten sectors correspond to every m司or investment style of hedge fund manager. Roughly speaking, hedge fUnd strategies can be divided into two styles:directional and non-dlrectional strategies. Dedicated Short Bias, Emerging Markets, Global Macro, and Managed Futures are grouped into directional strategies. Non-directiona1([e., mispricing) strategies are Convertible Arbitrage, Equity Market Neutra1, Event Driven(which is subdivided into three categories:Distressed, Multi-Strategy, and Risk Arbitrage), Fixed Income Arbitrage, and Long/Short Equity. The perfbrmance statistics suggest the f()110wing points. First, the historical monthly retum characteristics (i.e., mean)varied widely across hedge fUnd investment styles from-0.21%to l.01%while the risk levelsTable l:Descriptive Statistics of Hedge Fund Index Returns January 1994 to July 2011
No. of
obv.
Mean
STD
Skew KurtMax
MinJarqUC -Bera J-B P-value
AC
Lag」AC
Lag2
DJCS Hedge Fund lndex Hedge「und lndex Convertible Arbitrage Dedicated Short Bias Emerging Marketg. Equity Market Neutral Event Driven ED:Distressed ED:Multi-Strategy E・ID:Risk Arbitrage Fixcd Income Arbitrage Global Macro Long/Shc)rt Equity Managed Futures Multi-Strategy川llllllllll11181111111111111022222222222222
O,76 0.65 -0.21 0,75 0,49 0,82 0,89 0,79 0.57 0.45 1.01 0.83 0.58 0.67036336990264152083078824884522443111112231
.O.21 -2.71 0.70 -O.78 -11.78 .2.36 .2.26 -1.77 -1.04 -2,26 -0,02 0,01 0,01 .L77 5.47 18,82 4.54 8.lo l59.42 15,57 14,86 11.71 7,86 11.43 6.54 6.45 2.92 9.22 8,53 5.81 22,71 16.42 3.66 4.22 4.15 4.78 3.81 4.15 10.60 13.Ol 9.95 428 一7.55 -12.59 .IL28 .23.03 -40.45 -11.77 -12.45 -11.52 -6,15 -6.96 -11.55 -11.43 -9.35 -7.35 54.99 2458,31 37.85 249.92 21999750 1585.56 1416.74 776,55 245.62 803,14 110,31 104,70 0.07 443.4| OO nO nO nO nO nO nO nO nO nO nO nO X7 O00000000ハUOOOOOO
0.21*** 0,56*** 0.10 0.31 *** 0.07 0.37*** 0,40*** 0,31*** 0.29*** 0.45*** 0.08 0.21*** O.03 0,34*** o.11*** O.31*** -0.06 0.05*** o.(}・l O.21*** O.24*** O.18*** -o,〔}1*** 0.19*** o.04 0,〔F)*** -O.14 0.23*** Nlarket Index S&P500 Russcll2(X)O NASDAQ(10mposite I)JIA MSCI World Indexe) 211 211 211 211 205 0.59 0.70 0.86 0.66 0.50 4.47 5.75 7.18 4.43 4、62 一〇.71 .0.56 -0、38 -0.61 -0.87 4,00 4.〔}il 396 396 5.oo 9.67 16.42 21.98 10.60 12.lO 一16.94 -2〔[90 -22,90 -15.13 -2(B2 26,49 20,42 13.19 2LO8 60.U 0.00 0.00 0.00 0,00 0.00 0.11 0.ll O.〔}9 0.〔U O.17 一〇.03 -O.06 -O.()] 一([.(ト‡ -o.Ol Source:Author’scalculations, based on data fTom Credit Suisse, Yahoo!Financc and msci.com.. Nolcs:(1)Data from April 1994.(2)Data from July 1994,(3)*,**and***denote significance at the 10%. |cvels. respectively. 5%、and lo/o measured by standard deviations are considerably lower than those ofthe stock market index retums, exccpt for two d▲rectional strategies such as Dedicated Short Bias, Emerging Markets. Second, most hedge fund indexes and the stock market indexes indicate that the retums are not normally distributed. The skewness and kurtosis estimates and the Jarque-Bera test statistics are useful for testing f()r normality in return distributions. The normal distribution has a skewness ofzero and a kurtosis ofthree. The skewness and the kurtosis are the standardized third moments and f()urth moments. Kurtosis with a value of more than three is referred to as‘excess’kurtosis. Positive excess kurtosis implies more weight in both tails o t’ th e distribution than in the normal distribution, which indicates a‘ fat tailed’distribution. This d▲stribution means that large negative and positive returns are much more likely than would be the case under a norrnal distribution R)r these indices. Negative skewness and positive excess kurtosis are unattractive fξatures t’or risk_averse investors. Non-directional strategies such as Convertible Arbitrage, Equity Market Neutral, Event Driven, ED Distressed, ED Multi-Strategy, ED Risk Arbitrage, Fixed Income Arbitrage, and Multi-Strategy have negative skewness and high excess kurtosis, whose properties indicate tail-risk exposure. Dedicated Short Bias(directional)and Long/Short Equity(non-directionaD have positive skewness and relative small excessAsymmetric Dependence ofHedge Fund Strategies to the Market kurtosis. Directional strategies such as Emerging Markets and Global Macro have slight negative skewness and excess kurtosis, More precisely, it is possible to detect whether the return distributions are normally distributed by implementing the Jarque-Bera normality test. As is evidenced by their significant JB-test statistics, it is appropriate to conclude that most hedge fund index returns and an stock market index returns are not normally distributed. The statistical properties ofnon-normally distributed hedge fund index returns pose diflficult problems on measuring risk. Traditional risk management based on the mean-variance approach only takes two parameters、 mean retum and retum variance(and/or standard deviation)into account to specify the risk-return profile of the investor’s portfolio. Ifthe returns are normally distributed, the first two moments of the distributions are enough to characterize their risk-retum profile. However, in the case of non-normally ロ ’ り distributed retums, skewness and kurtosls mlght play significant roles in investors rlsk percepuon. Third, the hedge fUnd index retums exhibit substantial serial correlations compared to those of the stock market indexes. The estimated autocorrelation coefficients fbr lag l and 2 are also reported in Table 1. Ten indexes among fburteen hedge fUnd indexes indicate statistically significant positive autocorrelation at the first lag.where as all stock market lndexes do not exhibit statistically significant evidence of autocorrelation. Significant serial correlation in monthly returns leads toしtnderestimation ofthe standard deviation ofretしlms. It is possible to consider several potential soしlrces tk)r serial correlation in the context of hedge fund retums: time-varyillg expected rcturns, tjme-varying leverage, incentive允es with high water marks. illiquidity expose, and smoothed returns. Getmansky, Lo, and Makarov(2004)point out that the most plausible explanations are illiquidity expose and smoothed returns、 Using the fhst-order return autocorrelations as aproxy f()r liquidity measure, the hedge fund strategies can be distinguished between liquid and illiquid strategies(Billio, Getmansky, Lo and Pelizzon,2010). The liquid and illiquid strategies are identif]ed with first-order autocorrelations less than O30 and equaいo or greater than O.30, respectively. For example, Dedicated Short Bias, Equity Market Neutral, Global Macro, Long/Short Equity and Managed Futures are the liquid hedge fund strategies, while Convenible Arbitrage, Emergillg Markets, Event Driven strategies, Fixed Incomc Arbitrage. and Multi-Strategy are the illiquid strategies. To sum up, the monthly retum distr{butions of hedge fimd indexes show significant degree of skewed, fat トリ ‘ tailed、 as well as positive autocorrelated distributions. These statistical properties imply tail risk.Static methods such as traditional mean-variance analysis cannot capture the risks inherent in dynamic trading strategies of hedge funds. lt is clear that a new set ordynamic risk analytics specifically targeted fbr hedge fUnd strategies is required.
3.Risk-Return Decomposition for Separating Alpha from Beta
Hedge funds can create unique risk-return profiles that traditional long-only strategies cannot. These unique profiles are where hedge funds come into the picture. Traditional investment managers, such as fbr mutual fUnds, typically employ a iong-only buy-and-hold-type strategy on traditional asset classes. They eam risk premiums fbr investing in the[arge-cap and smal1-cap growth equity markets and high-yield bond market, dependent ofbroad market trends. Unlike mutual fUnds, hedge fund managers can use more dynamic trading strategies, which imply more complex risk exposures fbr generating additional and complementary sources of risk-premia. For instance, hedge funds can take pos垣ons in a variety of markets such as fbreign exchange and commodities in addition to equities and debt markets. They can also invest in derivatives(swaps, options, f山ures and so on)as well as in structured financial products like CDOs. Moreover, they tend to leverage their funds to amplify returns by using margin loans from banks, or off-balance-sheet derivatives and use short selling. Hedge funds’risk and return exposures are generally def]ned by their dynamic investment strategies.Dynamic investment strategies imply dynamic risk exposures. Modern portfblio theory has much say
about the risk and return ofstatic investment such as mutual funds-the market beta is suffic▲ent in this case. However, it cannot cope with perfbrmance evaluation of hedge fund’s portfolios. It is important to distinguish between their returns that come輪m the market and the value-added of hedge fUnd managers. A way ofdistinguishing between them originated from the Capital Asset Pricing Model: (D E(R,)=R,+β、[E(R、v)-R/], where E(R,)is the expected return on a portfblio of assets, R/is the risk-free rate. E(ノ~,vf)is the expected return on the market portfolio,β. is the sensitivity of the portfblio retum relative to the excess market retum Beta represents the amount of market risk of the portfolio, i.e., undiversifiable risk. The CAPM states an equilibrium condition in which the expected retum on a portfolio of assets is a positive linear function ofthe expected retum on the market portfblio. Equation(1)can be rewritten as (2) E(1~i)-Rノ・=β∫[E(ノ~,sf)-R〆.] The above is the CAPM in“risk-premium fbrm”because the value on the left-hand side ofthe equation is the excess retum, that is, the portfblio’s expected return over the risk-free rate. Following the CAPM type-based model, risk-return decomposition approach is useful f()r assessing a hedge fund portfolio’s risk exposure and actual perf()rmance relative to a benchmark index. Figure 1川ustrates risk- return decomposition。 A portfolio’s total return is measured by the mean return f()r a given period. Total risk fbr the portfolio is defined as the standard deviation of the portfblio retum Total retum is divided into the risk-free retum(i.e., the risk free rate such as T.B.), and the total excess retum. The total excess retumAsymmetric Dependence of Hedge Fund Strategies to the Market Figure 1:Risk and Return Decomposition
Total Return
(Tbtal Risk)Total Excess Return
(Total Excess Risk)
Benchmark Return
(Benchmark Risk)
Risk-free Return
Active Return
(Active Risk) Source:Author’scompilation from EX田BIT l9.7 in Focardi&Fabozzi(2004). p.581. is called risk-premium, that is, portfolio’s total return over the risk廿ee rate, The risk associated with the total excess retum is called total excess risk, Jn assessing a portfolio’s risk exposure and actual per允㎜ance relative to a benchmark index, total excess risk is divided into benchmark risk and active risk. Benchmark カ risk is the rjsk associated with the benchmark portfblio, Active risk is the risk that arises from the manager s investment strategies to generate an active return that will outperf()rm the benchmark, which is also called tracking error. The active return is the difference between the actual portfblio retum fbr a given period and the benchmark index retum fbr the same period. The average active return over a given time period is referred to as alpha. Alpha is the perfbmlance measurement ofaportfblio independent ofthe market, that is, the excess retum(i.e. the difference between portfbho retum and risk-free rate)over the benchmark such as the S&P 500, Anson(2006)classifies the investment strategies by their attribution to active risk and active return. Figure 2depicts risk-return profile ofportf(〕1io strategies classified by alpha and beta exposure. The X axis measures active risk and the Y axis measures active return. Active retum implies alpha, which is measured by the excess retllrn over benchmark(or market)retum based on a broad market index. Active risk captures the departure廿om the market(or beta)risk. Both axes correspond to the degree ofthe market risk-premium of individual investment strategies. ’ Beta drivers are economic drivers that generate market risk-premium while dete㎜ining a IVnd s overall exposure to the financial markets. The per衣)rmances of beta drivers exclusively arise from the broad stock markets and are linear compare to a financial market index. For example, when the financial markets are up, beta drivers are up, and when the financial markets are down their perf()rmance declines correspondingly.Figure 2:Investment Strategies:Separating Alpha Drivers from Beta Drivers @. . ・ ・ . . . . ・ … . .◆㊨ . ・ ・ . . . . ・ . . . . . ・ ・ . ・ . . . ・ . . . ・シ ◆ シ▼シ シ ・ ・ ・ ・ ・ ・ … . . . .る■ . ・ . … . ・ ・ ・ ・ ・ ・ ・ ・ ・ ・ ・ … . Active Rpt.urn Alpha Drivers BetaDrivers ・ ’ ・ . . ・ . ・ ・ 1 1 1i ‘i li Ii li l’ ↓ ↓ .… ...・・..・・・・… s ‘ , 1川19 1 0nly l 1 : …1 ’IYaditiOnal i: mvestments i i Alternat.ive : lnvestments: Abs〔エlut‘ム 1モeturTl9. Markイ・t Spg【n〔・nl .ali《,$1 Investment strategles (tr,11C(ムnt「llt{Ld S’ortfo]iイ)s … … N〈)nlinear : Ret.urns Enhanced [ndesx Active P8s,sive i Risk : へ ・ s . s . . . . . . . . . . . . . . . ・ . . . . . . . ・ . ・ . ・ . ・ . ■ ・ . ・ ■ . … . . ・ . . . . . , ●一一一一一一一一一 Beta l)riv〔・rs Alpha Drivei層s -一一一一一一一一一一一一一一一一一レ レ Source:Author s compilation based on EXHIBIT 2.4 ill Anson(2006}. p.22. Beta drivers are not designed to outperform the financial markets but provide efncient exposure to the markets. At the zero point on each axis are beta drivers, which represent the level of market return and market risk(or beta risk). Beta risk is defined as the risk associated w▲th the benchmark portf()lio. Alpha drivers are defined by trading strategies or economic exposure that expect to outperfbrm the market. These strategies intend to beat the market. Alpha drivers generate active retum(excess return over a broad 伽ancial index)without regard to benchmarks and identified by their high tracking error to a benchmark. Alpha risk measures a tUnd’s deviation from beta risk, which call be estimated by an underweight or overweight to a benchmark. The strategic core fbr traditional jnvestnlent styles is a long-only buy-and-hold type strategy on traditional asset classes. ln Figure 2, a passive equity fUnd, an enhanced index fund, and a long-only active equity fUnd are classified into this category.1 Returns to these index funds are driven purely by the lnarket. First, return and risk of passive equity index fUnds correspond to the zero point, the point of intersection of the X and Y axes. The passive equity fUnd is ref>rred to as the indexed portfblio or the tracking portfolio. An indexing strategy attempts to design a portiblio to track the perfbrmance oftotal retしlm ofabenchmark index such as the S&P 500. The indexing strategy does not attempt to beat the market The retums to an index fund are derived purely by the market, the expected alpha is zero and the risk profile matches the benchmark index. Second, the enhanced index fUnd is located slightly above the passive equity index funds. Managers will construct a portfolio with a risk profile close to that of the benchmark index but intentionally not idelltical to 1 For active and passive portfolio management. see more detaiいn Focardi and Fabozzi(2004), chapter l9.
Asymmetric Dependence ofHedge Fund Strategies to the Market lt by taking small amounts of risk and offering a little extra return. The performance ot’ the enhanced index fund has greater tracking error relative to an indexing strategy. Third, managers of long only active equity fund take a buy-and-hold strategy, in which a portfbho of stocks based on some criterion is purchased and held to the end ofsome investment horizon. The goal is to seek capital appreciation by using fundamental analysis. In dynamic trading strategies、 hedge funds can seek alpha outside the market, that is, independently ofbeta. The traditional investment strategies can also find active return(輻e., alpha)but only when it is attached to beta. This is where alternative assets are most useful regardless ofmarket trends. There are four strategies ot’ alpha drivers expectjng to outperforrn the market:absolute retum strategies, market segmentation、 concentrated port止bli()s、 and nonlinear return distributions. The first strategy is absolute return strategies, in which fUnd managers pursue absolute returns that theoretically do not depend on the perfbrmance ofbroad markets and their goals is to value added regardless of size, market direction, or benchmark restrictions and to have a low correlation with the broad financial market indexes. Traditional long-only managers are unable to short stocks and bonds while hedge fUnd managers often short-sell them. They can extract the maximum vaiLte ofthe▲r financial market insights from both the)ong and short strategies. Structural ine缶ciellcies in the markets are thc source ofreturn premiums for this strategy. Consequently, the risk factors that derivc their return are different from market risk. For example, long/short equity hedge funds fall int《)this catcgory. The second strategy is market segmentation. There arc certain markets that lnvestors often deselect themsclves from them due to the level of credit risk as well as by the specialized know]edge required to understand. For exanlple, some institutional investors are prohibited from investing in below-investment grade bonds and avold the collateralized debt market because of the default risk and the liqujdity risk pertaining to the lower rated tranches of securities in this market. In fixed income, hedge funds have been maj or investors oボ川iquid structured credit instruments, such as collateralized debt obligations(CDOs)and collateralized loan obligations(CLOs). Another example of market segmentatjon is commodities. Investing in commodities requires a specit]c knowledge fbr investors to understand the market so, many investors eschew the commodities market since they do not ha、・e the tilne to understand it. As a result, market segmentation provides opportunities to eam high-return premiums fbr certain investors. Distressed debt in、・estors fall into this category. Distressed sectlrity funds are exposed to liquidity crisis ill addition to credit risk due to hold illiquid assets. Thc third strategy is concentratcd portfblios. ln the modern portfolio theory, portfblio diversification is a way to minimize the risk ot’ port folios. Wel1-dix・ersified portfolios can f烈de away a specific risk but cannot
market risk. There fo re, they also minimize the probability of outperforming the benchmark return. In contrast, portfolios constructed from a very few concentrated positions might offer a greater opportunltles f()rexcess retum, and thus have considerable tracking error to the benchmark. This type of strategy includes investment in corporate governance funds and private equity. The fourth strategy is nonlinear return distributions. Non-linear return functions exhibit option-like payoffs with a“kinked”distribution. These payof「structures are closely related to the hedge fund strategies such as merger(or risk)arbitrage, event driven, fixed income arbitrage, and managed fUtures. Event driven and merger arbitrage funds are exposed to the event risk ofa deal failure. The combination ofa linear beta driver and this type of retum distribution are particularly usefU1.
4.Nonlinearities
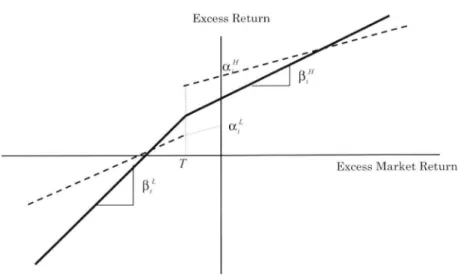
Ahedge fund’s risk and retum exposure are characterized by an investment strategy. Returns stemming from beta drivers are by nature linear to the performance ofthe financial market. Hedge fUnd strategies as an altemative investment vehicle are located in the upper-right part in active risk and retum dimensions(Figure 2)and their return distributions are not normally distributed(Table 1). The aim of hedge血nd strategies is to seek alpha outside the market、 Consequently, many hedge fund index retums often are not linearly related to the market risk、 In this section, beta exposures of hedge fUnd indexes to the market index, S&P 500, are evaluated. For comparison purpose, two performance mode)s are used:asingle index model based on the CAPM and the piecewise linear regression modeL All estimates are computed by using Newey and West standard errors to a(ljust tk)r any autocorrelation in the retums. T()begin our empirical testing, we estimate the single index model that includes a constant,α’,and an error te㎜,ε」: (3) R、-R.ノ.=α,+β、(R、,-R.ブ)+ε” where Rゴis the monthly hedge fUnd index retum to theゴth strategy, R/is the monthly risk-free rate, RM is the monthly retum on the stock market index. Here, we use the monthly retum of the 3-month treasury bond as th・・i・k丘ee・et・m R.,, th・S&P 500 i・d・x a・R。・21fα、 i・ze・・, th・CAPM i・expect・d t・b・h・ld・D・p・rt・・e 廿om the linear relation ofthe CAPM are generally called Jansen’s alpha, which is meant to capture the fund manager’s skill in achieving superior retums relative to the passive portfblio strategy. This gauges the risk一 2 We confirmed that the monthly returns on all hedge fund indices and the S&P 500 index. and the 3-month TB are stationary based on conducting the unit root tests(i.e.、 the DF test, the ADF test, and the Phillip-Perron test)with and without trend at l o/o significance leveLAsymmetric Dependence ofHedge Fund Strategies to the Market a(加sted va[ue added by active fund management.3 To characterize the systematic risk exposures of hedge funds, the CAPM-type model can be used since it separates the retum of hedge funds into two parts:systematic and idiosyncratic. Beta coefficient fii. can be seen as systematic risk exposure to the market, alpha coef6cientα、 is the excess retum generated by the hedge fUnd strategy, and the error temlε∫ represents the portion ofthe index retum not related to the market, that is, idiosyncratic risk. Next, we estirnate the piecewise hnear regression model: (4) ノ~i-R.ノ=(1一δτ)[αiL+β,L・(R nf一ノ~/)]+δτ[α∫H+)6,it .(ノ~M一ノ~ノ)]+si, whereαiL and)(3、L are the intercept and the slope coefficients when the excess market retum is less than the threshold level T, andαだandβ!ノare the intercept and the slope coeMcients when the excess market return is greater than the threshold levelτ.δi『 奄刀@a dummy variable: 1,RAf>τ, (5) δT= 0,ノ~,Ll≦τ. Figure 3 provides a graphical description of the model specified by equation(4)assuming a negative threshold. The horizontal axis is the excess monthly return of the S&P 500 index and the vertical axis is the excess monthly retum of a hedge fund strategy. However、 such a regression model would neglect the continuity of the function just by dividing two linear pieces. The estimates would apPear more like the broken lines than the continuous function as shown in the solid line. Restricted regression is required to gain the desired effect. To insure continuity, the fbllewing restriction is imposed on the mode1:4 (6) α,ゐ+)Btl-・7「=αζ+β∫”・τ. Since R.v=(1一δτ)・R.v+δア・R〃, the standard linear model(3)in which fUnd〆s market betas are identical in up and down markets is a special case ofthe piecewise linear specification(4), the case whcreβ,L=fβii’1. Table 2 reports the results of the linear, and piecewise linear regressions, in which the thresho[d level of excess market return(in excess of the risk-free rate)is zero. Overall according to the evidence of the piecewlse regression illustrates, most hedge fUnd strategies indicate a nonlinear risk-return relation as manifested through significant betas. In particular, beta asymmetries(i.e., the indexes whose down-market betas are much greater than their up-market betas(among the indexes that both betas are statistically significant at 5%1evel))are quite profound fbr Emerging Markets, a family of Event Driven including ED Distressed, ED Multi-strategy and ED Risk Arbitrage. Their payo ffs are akin to writing a European put 3 See Feibe1(2003), p.195. 4 The piecewise linear regression model can be formulated as a]inear spline function with one knot. For more detail discussion about the spline function、 see Ruppert(2004). p.405406. and Greene(2000)、 p.322-325.
Figure 3:Piecewise Linear Regression Model Excess Return C ’ , ’ , ’’
α”“一“
C ’ β三 ’,/
1. O〔, ’ @’ f τ Excess Market Retu ’ ’ @ ’ @’ f β∴ ’ ’ ’ Source:Author’s compilation based on Figure 2 ill Mitchell and Pulvino(200D. p.2143. Table 2:Linear and Pieeewise Linear Regressions of Hedge Fund Index Return to S&P500 January l994 to July 2011 α t(α) β uβ) 1 `(U-R“ i%) α t(α) β1 {(β1) βH t(βII) 、 `dj-R← i%) DJCS Hedge FUIId lndcx 古弁wn.43 3,092 ・ w . O27 6.85 3(1.76 ・ . ヂ sD.72 3.65 035ウ .・ 556 ・O.18 2.16 31.51 Convenible Arbitrage ・n.35 L722 . ● n.17 2.37 12.81 . ・O59 2.ll 023 L54 0.09 1.(ト↓ 13.29 Dedica〔ed Short Bias .(⊃.19 一〇.74 ・ , .諱D82 一9.50 5フ.02 O.02 O.04 O.77.・.
.4.82 プ..
潤D89 一9,77 56.93
Emerging Marke’s O.34 LO23 ◆ , .
O.52 7.65 28.Ol ・ 7k{〕5 2.46 0.69’㎏ヂ 4.56 之An.29 255 29.34 Equity Markct Neulral 0.18 0,769 o.18 0.77 7.28 ・看“撃c.43 3.44 0.25 》 1.84 ヂウ牛O.11 3.05 7.27 Event Driven ★★吟 O.49 3,781 ●■吟k1.25 6.40 38.75 .画’ O.89 4.95 0.34右.、 4.18 牛≠ O.12 2.18 41.59 ED:Distressed ウ十★
O56
3,823 …O.26 5.86 36.87 〉ウ. P.{}6 5.61 0.38,’■ 4.47 ウO.10 1.89 41.02 ED:Mult卜Strategy ”、O.46 3,295 ・ カウ O.24 656 32.01 令■‘oD.84, 4.12 0.33 . . ・ 3.90 *, O」3 2.06 33.60 ED:Risk Arbitrage 一 ヂ・冑 O.28 3,331 ・ . ウ O.13 5.19 23.69 ・ . ・ O.41 3.46 0.17 ・ ウ ・ 343 ぴ・・ O.09 2.66 24.09 Fixed Income Arbitmge 0.16 0.96 ・潤D|3 1.74 lLl7 ・ヲ O.62 2.46 0.25 . L7{} 一〇.02 一〇.24 15.44 Global Macro ■w& O.71 3,445 ..O.16 2.56 5.54 び ウ ・ O.92 3.29 0.21. 亭 ・ 2.65 0.09 0.63 5.42 Long/Shon Equity 女士★ O.45 2.8 , ・ 台 O.41 8.88 41.56 ’,k1.64 2.54 0.46. , ’ 6.35 ケ右令 O.35 4.35 4L54Managed Futures .O.35 1,676 .O.07 一〇.93 028 .0.36 一1.04 一〇.24事・
一258 0.16 1」7 2.51 Mu|ti-StrategylD ★★≠ O.38 2.83 ・・.iハ.12 2.57 12.37 ウウ● O.ω 4.03 oJ 8ウ. 2.〔17 0.06 1.19 B.17 Source;Author’scalculatiQns, based on data froln Credit Suisse and Yahoo!Finance. Notes;(1)Data from April 1994.(2)Results oiコ the piecewise regressions are presented for a threshold excess market retum of O percenし(3)The statistical significance is determined by using heteroscedasticity and autocorrelation-consistent standard errors. (4)*、**. and***denote significance at the 10%.5%and l%levels, respectively, (5)Parameters significantly ditf>rent from zero at thc 5%leve|are shown i:1 bold type. option(Figure 4(a)and(b)), which means that returns of these strategies are more strongly correlated in down markets than in flat and up Inarkets. These strategies exhiblting asymmetric dependence between the market and hedge fund returns belong to the strategy(i.e., nonlinear return distribution)whose return generates from alpha drivers. Emerging Markets hedge funds invest in currencies, debt instruments, equities and other instruments
Asymmetric Dependence of Hedge Fund Strategies to the Market in emerging markets, and thus, they primarily take positions in all types of securities that are quoted on emerging markets. They rely on the direction of market movement in order to make pro丘ts. Market risk, currency risk, country risk, and liquidity risk are clearly high with Emerging Markets. Event Driven strategies fbcus on events such as mergers, takeovers, and reorganizations. Fund managers are required to have special knowledge of a broad range ofcorporate events and shift their portfolios during different parts of the business cycle in the investment process. They seek to profit from potential mispricing of securities related to a firm-specific or market event, such as mergers, bankruptcies, restructuring, and so on, Sources of return come廿om future valuation of the colnpany’s debt or equity instruments and are less dependent on overall stock market gains. The risk arises from the non-realization of such events and is more likely to occur during down-market conditions. Event Driven fUnds invest in various asset classes including ×山OO山 5 0 一5 ・10 一15 Figure 4:Selected Strategies of Hedge Fund Return versus Market Return (a)ED:Distressed LOESS Fit(degree=1、span=0.3000) .20 ・15 -10 .5 0 S&P EXR 5 10 (b}ED:Risk Arbitrage LOESS Fit(degree=イ、span=0.3000) : 茎1 ’2 t6 -8 .20 -15 -10 -5 0 5 10 S&P E×R (c)Managed Futures LOESS Fit(degree=1、span=0.3000) 10 5 益 tL O Σ 一5 一10 一20 -15 -10 -5 0 S&P E×R 5 10 り Source:Auth〈)r s conipilations.
derivatives.5 Risk(or Merger)arbitrage血nds trade securities ofcompanies involved in a merge or acquisition. Typically, they buy the stock ofacompany being acquired at a discoun“o the takeover price, and sell short the stock of the acquirer at the current price with a goal ofextracting a small profit when the deal closes. The strategy is event driven rather than market driven, Risk arbitrage funds are exposed to significant event risk due to the firm-speci丘c positions they take. A large proportion ofdeals go through during up-market condition, and they make profits, which are unrelated to the degree of up-market condition. Individual deal risks are idiosyncratic and can be diversi丘ed away. They are therefbre less exposed to market risk under normal market conditions. However, the dea[s often fail during down-market conditions, and the fUnds lncur large losses. The systemic risk that many deals could be cancelled all at once emerges when the market declines sharply. As a result, Risk Arbitrage shows no correlation with the market during up-market conditions, but large positive correlation during down-market conditions. This correlation implies that the payoff of Risk Arbitrage has option-like features similar to a profit from writing(selhng)aEuropean put option(Figure 4(b)). Distressed strategy invests in the securities of firms in financial distress(i.e., reorganization and/or bankruptcy), ranging廿om senior debt to common stock. ln depreciating markets, the probability of firms emerging廿om financial distress is higher. Therefbre, their down-market betas increase dramatically during market downtums while up-market betas increase moderately. Similar to Risk Arbitrage, a strong nonlinear risk-retum trade-off is shown in Distressed/Restructuring(Figure 4(a)). Two unique strategies that contrast sharply with these strategies are Dedicated Short Bias and Managed Futures. Dedicated Short Bias exhibits negative exposures to both up-beta and down-beta(Table 2), and Managed Futures shows almost uncorrelated to the upside market and negatively correlated to the downside market(Figure 4(c)). Dedicated Short Bias takes more short positions than long positions, which places it into the group of directional strategies, It seeks prof]ts by taking a short position from a decline in the value of stocks anticipated to earn a lower price in the fUture. Thus, the result depends purely on fUnd managers’keen anticipation based on the security selection and timing skills of the manager. The strategy stems from Long/ Short Equity, where Dedicated Short Bias is more biased to short position than long position. Long/Short Equity belongs to the group ofnon-directional strategies・ Their fUnds rely on a strategy 5 1nvestment strategies with derivatives are designed to create asymmetric, non-normal return distributions. For example, strategies with purchasing put options reduces the risk of losses, while leaving the potential for retums、 in exchange for a lower average return due to the cost of the put options. Conversely, written call options have the opposite ef民cL
Asymmetric Dependence of Hedge Fund Strategies to the Market combining of long positions in undervalued stocks with short positions in overvalued stocks, known as the long/short strategy.6 The purposes of selling stocks short are to hedge a portfblio’s market exposure(and/or sector exposure), to make profits廿om stock price declines, and to capture relative value. The traditional long-only buy-and-hold type strategy has only one source ofretum, which is the appreciation ofthe purchased stock, A source of retum in long/short strategies is the spread in performance between the long position and the short position. The spread makes profits when the stocks on the long side appreciate in value while the shorted stocks depreciate in value. The short position represents a bet on an overvalued stock that should decrease in value in the near future, which in tum can be served as hedging the market risk ofthe long side. Therefbre, the payoff arises from relative miss-pricings ofsecurlties rather than the movement ofthe market as a whole. Managed Future funds are operated by commodities-trading advisors using a trend fbllowing strategy, which aims to derive the maximum benefit from large, directional moves in a variety of asset markets. Managed Futures presellts the asymmetric sensitivity to contrast with the strategies such as a family ofEvent Driven since the coefficients are ofopposite g. ig n, with an up-market beta ofO。16and a down-market beta of -0.24.The payoft’ of Managed Futures has option-1ike properties similar to a profit from buying a European put option(Figure 4(c)). Itseems to provide S&P 500 downside protection with little exposure on the upside. lnvestment in Managed Futures call yield greater diversification benefits than investment in traditional assets classes. The a(ljusted R-squared of Managed Futures is the lowest among the hedge fUnd indexes, which almost implies it may not be correlated to the U. S. stock market. Global Macro fUnds, which fhll into the group ofdirectional strategy, exploit any opportunity that they can り ’ find in the market. They tend to invest globally, wherever they see value in markets. Managers mvestment approaches rely on market-timing skills, aggressive and purely market directional bets with no particular hedging policy, They switch from one investment opportunity to another, fbm one asset class to the next. Managers use leverage and derivatives extensively. They fbcus on identif>ing extreme price movements and thus、 their profits arise廿01n correctly anticipating and their risks are often able to be very volatile・ Agawal and Naik(2004)infer various possible sources ofthis nonlinearity shown in hedge fUnd strategies such as the use of options, or option-like dynamic trading strategies or strategies that lose money during market downturns. In addition, regardless of trading strategies, many hedge fund managers cou|d create a similar payoff structure by using leverage or other dynamic trading in order to increase their Sharp ratios or as a response to their incentive-fξe contracts・ 6 The original Altted Winslow Jones hedge fund model was mainly based on this strategy. More specialized strategies. such as arbitrage and relative value are formed on the basis of long/short strategies. Lhabitant(2002)PP・9-10・
5.Time-varying Beta Exposures in Bull Versus Bear Stock Markets
Beta exposures of hedge funds can vary over time since they o ften employ dynamic trading strategies. To consider how the asymmetric sensitivity of the hedge fund industry to the market can be changed in the periods of bull and bear markets, the sample period is di、・ided into 5 sub-periods:January 1991-March 2000(bull), April 2000-March 2003(bear), Apri12003-July 2007(bul1), August 2007-February 2009(bear) and March 2009-July 2011(bull). We chose the period from January 1994 to March 2000(i.e., the end of the Internet Bubble)with the setbacks from the Mexican, Asian and Russian crises as well as the LTCM bankruptcy as the bull nlarket. The bear market lasted廿om April 2000 to March 2003, and the strong bull market was during the period from April 2003 to July 2007. The period f「om August 2007 to February 2009 was regarded as the tinancial crisis of 2007-2009(the bear market)triggered by the Quant Meltdow川n August 2007. The last period was廿om March 2009 to July 201L Table 3 reports the results of hedge t’und strategies fbr the respective periods. 1t reveals that ill the hedge t”und industry as a whole the asymmetric sensitivity to the market was pro f{)und when the market was a bull environment, whereas it declined sharply in a bear environment(the DJCS Hedge Fund Index). For example, the strongest asymmctric sensitivities were shown in the first sub-period(1994/1-2000/3). ln the second sub- period(2000/4-2003/3), the magnitude of the asymmetric sensitivity dramatically declined. Subs. equently, in the third sub-period(2003/4-2007/7)it strongly increased again. The degree of asymmetric sensitivity increased consistent with bull market conditions. Surprisingly, in the period after the Quant Meltdown{n August 2007, the degree ofasymmetric sensitivity to the market dramatically decreased, and moreover, during tlle period between August 2007 and February 2009 upside-beta,0.37, was greater than downside-beta、0.27. Why did the degree and direction of asymmetric dependence to the market change in the period of the financial crisis of2007-2009?The stylized fiact is the sharp decline in hedge fUnds’stock holdings during the crisis. Figure 5 plots hedge funds’stock hold▲ngs as the廿action of U.S. market capitalization. A pre-crisis period(2004QI to 2007Q2)associated with the bull market recorded the growth ofthe hedge fUnd industry, aggregate intlows to hedge funds、 scaled by aggregate asset under management(AUM)in the previous quarter, increased 2.87%and hedge funds increased their aggregate equity porttbljo by 6」3%per quarter (Table 4). However, two notable events(the Quant Meltdown and the fall of Lehman Brothers)decreased funds’equity portfolio drastically. The shaded areas denote the quarters around these two events. During the financial crisis of 2007-2009 hedge fUnds decreased their equity holdings-3.06%per quarters. More specifically、 they reduced their equity holdings by 9.87%in the third quarter and 2.74%in the fburth quarter of 2007 and 16.70%in the third quarter and l4,26%in the tburth quarter of 2008(Table 4). Aggregate net flows as a fraction ot’AUM correspond negatively to the selloffquarters of hedge fund equity holdings(Figure 6).Asymmetric Dependence of Hedge Fund Strategies to the Market Table 3:Sub-period Analysis January 1994 to July 2011 Period α t(α) β| t(β1) β}{ uβH) Adj-R『 i%)
DJCS Hedge Fund Index Jan 94-Mar 2000
BuU
★★P.30239
ψ★富O.606.83 0.12 O.55 27.OI
Apr 2000-Mar O3 Bear 0.45
L67
古★右O.16 3.72 0.06 0.63】452
AprO3-』ulO7 Bull ★w★O.72 3.61 右吉★O.45 3.79 ×彙占
O」9 3.59 44,6|
Aug O7-Fcb O9 Bear 一〇23 一〇.35 勇★O.27 2.08
037
L2628.78
Mar O9-ju日1 Bull 0.39 1.30 w★冑O.32 3.80 ★w∀O.23 2.82
6L57
Convertiblc Arbitrage Jan 94-Mar 2000 Bull ★★O.89 2.01 021
1.40 一〇.06 一〇.40 5.78
Apr 200〔}-Mar O3 Bear 宇O.73 185 0.00 0.08 0.05 O.87 一4.99
Apr O3一川07 Bull
024
f)97 0.26158
0.09L44
8.92Aug O7-Feb O9 Bear 一〇.45 一〇.43 0.37 1.09 0.42 1.20 13.77
MarO9-」11111 Bull .P.17 L85 士★O.34 2.70 宇O.18 L76
28.26
Dedicatcd Short Bias Jan 94-Mar 2000 Bull 一〇.16 一〇.21 w★★|L20 一5.17 ★★士
黶Z.73 一4.22 55.52 Apr 2000-Mar O3 Bear 一〇.95 一1.32 ★古☆ 潤D91 一7.69 w★|0.69 一2.60 63.29 AprO3-」ulO7 Bull .0.29 一〇.49 ★w右黷P.62 一526 去オ★|LO2 一5.32 62.70 AugO7・-FebO9 ~ Bcar 0.92
092
肉 噺 n.35 一3.02 士★★ |2.00 一6.89 42.92 MarO9-Jul ll Bul1 ・|088 一1.99 ・ヂオ [0.97 一1399 ★汝吉 n.79 一7.94 78.44Emerging Markets ♪’n94-Mar2000 Bull
122
1.Ol ★★★P.16 3.29
025
0.942350
Apr 2000--Mar O3 Bear 1.12 1.54 曽★w
潤D53 4.91 0.24 1.37 39.89
AprO3-JulO7
Bull ×w×P.40 3.92 ,O.68 1.88 ★★O.26 2.5224.90
Au907-Feb O9 Bcar 0.38 〔}.32 弁宵
O56
2.46 0.28054
39.90
MarO9-.Jul l1 Bull 0.48 |.29 呼. ウ
O.38 3.|2 士古★O.39 5.97
52.65
Equity Market Neutral Jan 94-Mar 2000 Bl川 心★O.40
2.07 ♪★O.09
256
♪×&O.16 4.Ol23.35
Apr 2000-Mar O3 Bcar 舌≠O.54 2.39 0.03 0.82 0.03 0.6| 一〇.26
AprO3-Ju|〔}7 Bull ★w占O.60
458
・ ☆ ★n.17
322
一〇.05 一L51 5.28 Aug O7-Feb O9 一 Bear 一〇98 一〔}.44 ㊨O.42 2.07 0.46 0.58 一5.14 MarO9-Jul ll Blll1 一〇21 一〇42 . w n.30255
士wn.24 2.60 47.03Evellt Dri、・CI1 jan 94-Mal・2000 Bull w★肯k51 3.74 ★析wn.62 3.17 一〇.02 一〇.16 49.37
Apr 200〔}-Mar O3 Bear ★★wn.73
4.17 古舟O.17 2.55 0.03 0.65 19.26
AprO3-Jul O7 Bし川 女★+O.82 5.38 ★★宵n.28 2.80 ★来wn.22 3.68
36.18
Aug O7-Feb O9 Bcar 一〇50 一〇.98 A 止
O.22 2.13 0.35 1.68 28.84
Mar O9-JII口1 Bllll 0.70 |.42 ・★ w
n.44 4.82 ≠
O20
1.765429
ED:Distressed Jal194-Mar 2000 Bu|1 x 衰 ★
P.73 4.07 ル★頁O.70 3.89 一〇.01 一〇.11 51.66
Apr 2000-Mar O3 Bcar w★★P.08 3.23 占吟O.22 2.43 0.00 〔}、(X) 14.89
AprO3-Jul O7 Bull ★竃+O.83 5.59 念w亡O.21 3.0| ×女丼n.23 4.65 41.4|
Aug O7-Feb O9 Bear 一〇.73 一1.36 w古O.23 2.19 0.28 1.43
32.70
Mar O9-Jlll 11 Bull 肯肯O.98
236
♪古★O.40 4.55 0.11 1.3946.84
ED:MuhトStrategy Jan 94-Mar2000 Bull ★★wP.39 3.11 ♪★O.56
2.58 一〇.02 一〇.18 33.42 Apr 2000-MarO3 Bear 渋×wn.58 3.39 古★O.14 2.61 0.05
1」8 19.47
Apr O3-」ul〔〕7 Bull ・≠★O.84 4.58 女★O.34 2.19 寧O.21 2.43 25.91
Aug O7-Feb O9 一 Bcar
一〇.38 一〇.38 .O.22 2.06 0.40 1.77
23.40
MarO9-Jul l1 Bull 0.52
096
☆ ★★O.47 4.78 ホ
O26
1.86 55.97ED:Risk Arbltrage Jan 94-Mar 2000 Bu|1 ★★*O.88 3.40 吟古O.29 2.30 0.00 〔〕.06 22.43
Apr 2000-Mar O3 Bcar 0.28
099
らO.09 L73 0.040.97 6,161
AprO3-Jul O7 Bull ★肯★O.28 3.05 ★ ≠
O.23 2.59 士★古O.15 3.73
29.62
Aug O7-Feb O9 一 Bear
024
0.46 ・O.14 1.85 0.27 0.8624.53
Mar O9-Ju日1 Bull 一〇.12 一〇.35 0.ll
L28
大★≠O.17 2.89 44.31Fixed Incollle Arbitrage Jan 94-Mar 2000 Bull ∧士O.73 2.63 ★★六Z.17 3.48 一〇.ll 一〇.80 4,307
Apr 2000-Mar O3 Bear ★w★O.78 3.78 0.07 1.64 一〇.17 一L49 20.01
AprO3--Jul O7 Bl川 0、ll 0.66 0.07 0.49 下O.08 |.70 2.63
Aug O7-Feb O9 Bear 一〇.19 一〇.16 0.44 1.40 0.41 o.99 30.75
MarO9-Jul 11 Bしlll \ 金O.82
2.|6 0.lO
096
・O.12 L99 15.76Global Macro Jall 94-Mar 2000 Bull 十P.38
1.87 ★★古n.65 3.91 0.09 O.26 12.15 Apr 2000-Mar O3 Bear 士丁吉
k25
2.73 o.(u 0.76 一〇.08 一〇.90 一4.80AprO3-JulO7
Bull ★wn.66 2.43 0.|5 1.00 0.13 1.40 8.|2 Aug O7-Feb O9 Bear 1.07 |.10 021 L23 一〔}.20 一〇.35 一1.48 MarO9--jul ll Bし川 0.11 〔〕.31 一〇.Ol 一〇.06 0.16 L51 7,957 Long/Short Equity Jan 94-Mar 2000 B1川 |.26 1.67 ★止wn.71 5.11 0.34 |.49 36.18Apr 2000-Mar O3 Bear 0.05 o.12 ★ ★ ’