NUE Journal of International Educational Cooperation, Volume 12, 91-98, 2018
Study Note
Improving Mathematics Education in Teacher Training Colleges (TTCs)
in Papua New Guinea (PNG); An Analysis of the Comparison of TTC
Lecturers and Students Response to a Sample Test Question Item in
Geometry Shapes
David Kunum GOMAY
Naruto University of Education
1. Introduction and Study Background.
Teacher Training Colleges (TTCs) are Post-Secondary Education providing training for prospective teachers to be absorbed into the teaching force within the Department of Education in PNG after three (3) years of training. To be competent, refl ective, innovative and qualifi ed teacher, the training institutions provide knowledge and skills encompassing all areas of academic courses prescribed in the National Course Content Guidelines provided by Teacher Education Division (TED) under the Ministry of Education. Apart from the fourteen (14) TTCs that are currently in operation, the National Government intends to establish some more within the next few years to increase to twenty (20) TTCs.
Apule et al (2016), found that both teachers college students and primary school students did
Further, Gomay et al (2017) also found that students still lacked the ability and the skill to use instruments like protractors eff ectively. Thus, this report serves to identify if the perceptions that TTC mathematics lecturers have is also persistent to that is possessed by students of TTC. So this study contains a comparative analysis of a sample test item administered to 100 TTC students who are in their fi rst year of study in Enga Teachers College and questionnaires to 11 TTC mathematics lecturers of three (3) colleges including; Enga Teachers College, Holy Trinity Teachers College, and Melanesia Nazarene Teachers Colleges in the Highlands of Papua New Guinea.
The data collected was both through qualitative and quantitative methods. Further this study is part of the program sponsored by JICA under the long term training scholarship on
Abstract
The purpose of the study was to fi nd out and compare if the conceptual and procedural knowledge possessed by students is consistent to that of the lecturers utilizing both quantitate and qualitative data collection methods. This study is based on a sample mathematics test question item taken from 5th grade angles of triangles and was administered to fi rst year students enrolled in one of the 14 TTCs as well as questionnaires to mathematics lecturers in three TTCs in the Highlands of Papua New Guinea. The fi ndings exposed similarity in the limitations of both conceptual and procedural understanding of angle summation of triangles and also exposed common areas of misconceptions by both lecturers and students. Hence, the study proposes ways in which these needy areas are critically addressed to raise standards and improve mathematics education in TTCs in PNG.
as a guide for TED, PTTCs, curriculum planners and educators about the impacts of the current practice in mathematics education including the general misconceptions of teaching and learning of mathematics in PTTCs so that appropriate actions can be taken to improve practice in relation to teaching and learning of mathematics.
2. Participants
The sample includes a total of 100 students of which 55% male and 45% female with ages ranging from 18 30 with average age of 21. The sample group of year 1 students were selected because of the research question items which includes topics in geometric shape. In TTCs, the topic Space and Measurement is taught to Year 1 students thus it was appropriate to choose that group. However,
selection of experiment class containing 48 students and control class containing 52 students was done randomly without any criteria.
Figure 2.1 above shows the composition of students in age in years from 18 30 years who are enrolled in the TTC in 2018. The average age of male students is 22 and female students is 21 while the overall average age is 21 years old. One of the reasons for the big range of ages from 18 30 with 15% of students (both M and F) in the ages 24 years and above may be that students have delayed their schooling age time or have enrolled into TTC through the informal education system because they have left formal schooling some years ago.
Also, 11 TTC mathematics lecturers participated in this survey. Figure 2.2 below shows the TTC mathematics lecturers personal data by gender.
Figure 2.1 TTC Year 1 Students Age in Gender Group (Source: made of data collected by the author) 4 23 26 18 9 14 5 2 22 33 20 13 4 2 2 2 0 5 10 15 20 25 30 35 40 <=19 20 21 22 23 24 25 >=26 Total Response s (%) Age (Years)
Year 1 TTC Students by Age in Gender Group
M F
Figure 2.2: TTC Mathematics Lecturers Data (Source: made of data collected by the author) 55 9 9 27 18 9 45 18 0 0 0 18 27 18 0 0 27 9 27 9 0 0 18 9 0 9 0 9 0 9 9 9 0 10 20 30 40 50 60 70 80 90
BEd MA Mx Mx/Sc Mx/Oth Oth <=5 6~10 11~15 16~20 >20 <=5 6~10 11~15 16~20 >20
Qualification Major Course of Study No of Yrs Tch Mx in TTC Total Yrs in Teachnig job.
T
o
tal Responses
(%)
TTC Mathematics Lecturers Personal data by Gender
According to fi gure 2.2 above, we can see that 64% of the TTC mathematics lecturers are male and 36% are female. On the overall, 82% of the lecturers have Bachelor s degree qualifi cation while 18% have a Masters qualifi cation. 28% studied mathematics as their major course of study while equally the same number studied both mathematics and science. 18% studied mathematics and other subject while 9% of TTC mathematics lecturers have not studied mathematics as their major course of study.
Currently, 63% of the TTC mathematics lecturers have less or equal to 5 years experience in teaching mathematics at TTCs while 27% have been teaching mathematics for 6 10 years. Less than 10% have been teaching mathematics for more than 15 years in TTCs. Regarding total years in teaching as a career, 27% have less than or equal to 5 years teaching experience while equal number have teaching experience of 6 10 years so as those with 11 15 years experience in teaching. 18% have been teaching for 16 years and above.
3. Instruments
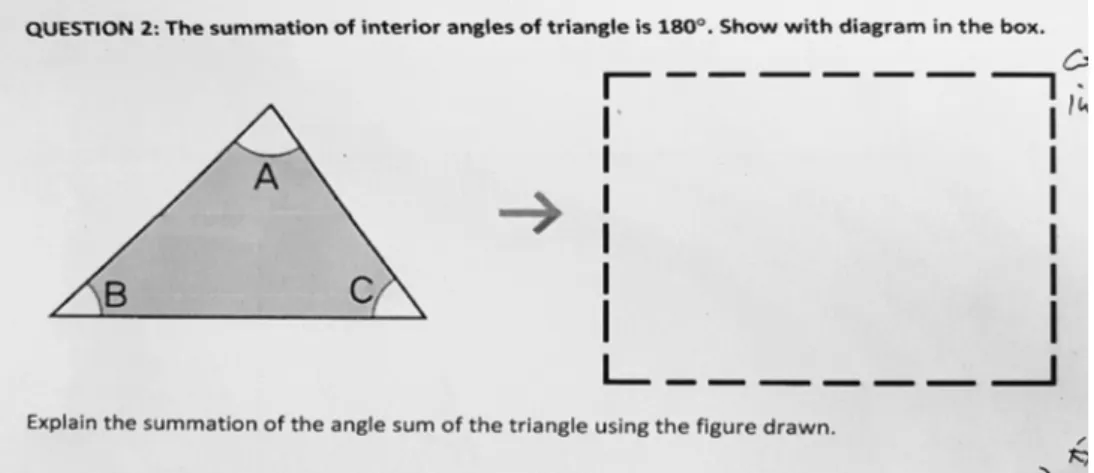
The main source of data collection was through pre-posttest question items for TTC students which includes open response question item in geometric shapes. Also questionnaires were distributed to TTC mathematics lecturers consist of a series of question items on their personal view of mathematics education as well as open response question items in geometric shapes. The question required both TTC students and lecturers to draw a diagram to show angle summation of triangle of 180° from a given triangle shape with each angles labelled A,B and C. Then, explain using the fi gure drawn, the formation of angle in relation to the summation of the three angles (A,B,C) inside the triangle shape. The study engaged both quantitative and qualitative methods of data collection. The open-ended aspect of the question item intopen-ended to extract both students and lecturers understanding of the process of knowledge creation from abstract concept to representation and explanation.
4. Results
4.1 Overall Results
Figure 4.1 below shows the overall results of the performance of both TTC students and maths lecturers on the sample question item.
According to the overall performance on the question item, 64% of the lecturers were able to correctly explain angle summation of a triangle whereas only 16% of students were able to correctly explain the angle summation of triangle. Almost equal
and lecturers respectively showed with diagram the summation of angle sum of triangle of 180°.
4.2 Qualitative Analysis
As per the research design, the question item required the respondents to write using words to explain and justify the mathematical concept represented in diagram or picture form. The data was analyzed qualitatively using an open coding to code each respondents case independently. These independent cases were then combined through checking the Figure 3.1: Question Item on summation of angle sum of triangle.
well as the representation using diagrams and the strategies. Subsequently, four (4) main categories were identifi ed in which three (3) of them were as an evidence of both lecturers and students misconception while the fourth category was as an evidence of correct reasoning for angle summation of triangle. (i) Misconception 1 (M1): Assumption based on
viewing of the fi gure as equilateral or isosceles triangle based on shape prototype.
Misconception 1 (M1) was due to both TTC students and mathematics lecturers view of triangle fi gure based on shape prototype. The appearance of the drawn shape appears as if it s an equilateral triangle, therefore, the sample population assumed
that each of the three angles (A, B and C) are 60°,60°,60° each. This exposes limitation of both lecturers and students conceptual understanding to a complete end result (answer based) instead of reasoning or providing a generalization as is the nature of mathematics (making generalizations). The other reason for asserting numbers to the angles A,B and C may be infl uenced by the algebraic process of substitution. It is assumed that to provide a number to proof the angle sum of triangle of 180° is sound because letters do not add-up whereas numbers do. Further, others viewed it as a isosceles triangle, thus, 45°.45°.90° was asserted to angles A,B and C. The sample students and lecturer s responses were used as evidence of M1.
Figure 4.1: Overall performance of both Lecturers and students. (Source: made of data collected by the author)
36 64 39 16 0 20 40 60 80 100
Correct Representation Correct Reasoning
Rate of
Correctness
(%)
Responses
Maths Lect. Year 1 Students
(a) Students
Figure 4.2: Sample evidence of Misconception (M1) – Year 1 students. (Source: made of data collected by the author)
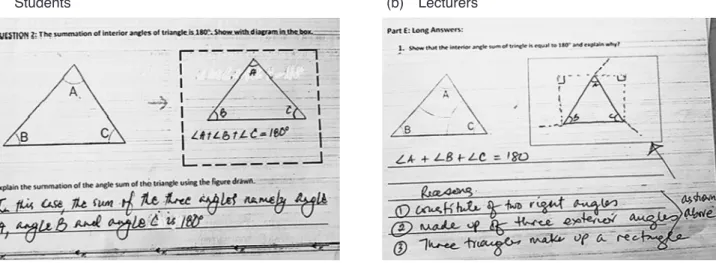
(ii) Misconception 2(M2): Representational Error. The second misconception (M2) was identifi ed to be both students and lecturers viewing angle sum as the abstract conceptual representation of ∠A+∠B+∠C=180°. It is mathematically correct, however, it does not show how the three angles (A,
B, C) can add up 180° by showing through the use of diagram. Their knowledge about angle summation is only limited to abstract concepts. The sample students and lecturers response were used as evidence of M2 as shown in fi gure 4.3 below.
(a) Students
Figure 4.3: Sample evidence of M2. (Source: made of data collected by the author)
(b) Lecturers
(iii) Misconception 3(M3): Incorrect Reasoning.
The third misconception (M3) was identifi ed as incorrect reasoning basing on both mathematics lecturers and year 1 students responses. M3 includes use of ill-conceived reasoning about angle summation and incorrect diagram or representation. Figure 4.4 shows both TTC lecturers and students response as an evidence of M3. Incorrect representation by students and a blank in the space provided to show the angle summation of triangle of 180° by
lecturers indicates a gap or an incomplete conceptual understanding of the process of showing with clarity the angle summation of triangle. The respondents could not fully understand what the question required them to do. The similar kind of response by students and lecturers signify that whatever knowledge the lecturers possess is passed on to students during their lesson instructions, or they have a same source somewhere in which this knowledge is acquired.
(a) Students
Figure 4.4: sample evidence of M3 (Source: made of data collected by the author)
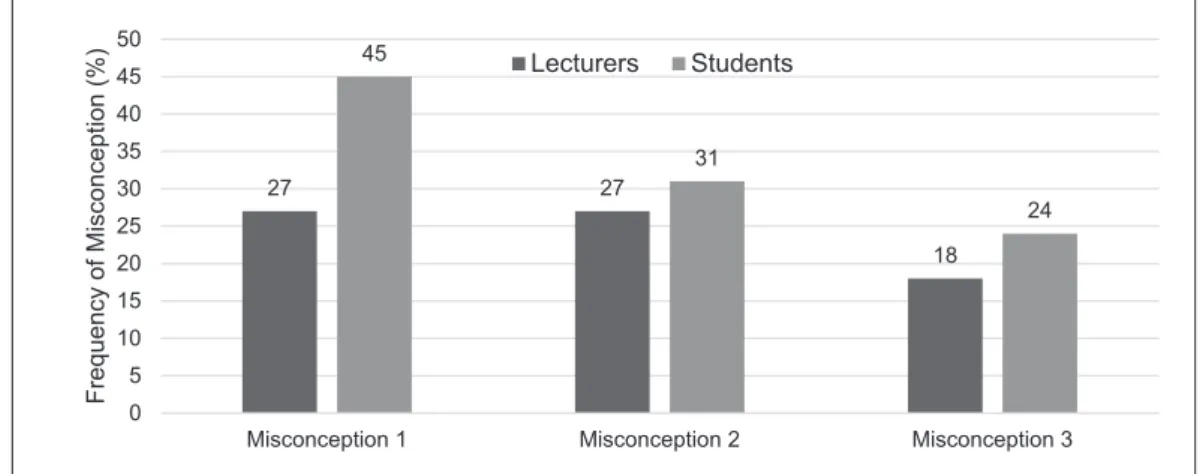
The sample evidence was used to compute the misconceptions for the sample respondents. Figure
4.5 shows frequent of respondents possessing the diff erent misconceptions.
According to the displayed information in fi gure 4.5, we can see that M1 was persistent in both TTC math lecturers as well as students with the highest of 45% among students and 27% among lecturers. The tendency to assume triangle-type by simply looking at the drawn triangle shape is observed among both TTC mathematics lecturers and students alike. For instance; a mathematics lecturer stated that
∴
° °
°. Students also exposed the same understanding. The conceptual knowledge exposed is correct for an equilateral triangle, or right isosceles triangle of 45°, 45°, 90°. However, the misconception is the assertion of numerical value to angle size of triangle based on assumption by simply observing the drawn shape without proper mathematical description of the nature of the triangle shape.
As it can be seen from the graph in fi gure 4.5, M2 was persistent in both the TTC mathematics lecturers as well as the year 1 students. 31% of TTC students possess M2 compare to 27% of TTC mathematics lecturers. It is a common practice for teachers in PNG to deliver mathematics lesson through short cuts placing more emphasis on rules rather than elaboration on the process. As exposed in M2, the same trend is applied at TTC by math lecturers in teaching mathematics concepts. The lecturers resort to easy way and rules with less or no emphasis on in-depth understanding of the process of
conceptual development in geometry concepts. The common knowledge that the sum of all the interior angles of a triangle equals 180° is correct, but how do we know that, and how can it be proven that the sum of all angles of a triangle is 180 degrees still remains a challenge for TTC lecturers and students alike.
5. Discussions and Implications
The sample population (lecturers and students) overall performance was very poor exposing limited understanding of angle summation of triangle in geometry. The most ordinary expectation is for lecturers to perform better than students because of their exposure and years of teaching. This can be observed in their rate of correctness of 64% for reasoning. On the other hand, lecturers performed poorly than students on representation with accuracy rate of 36%. This shows that lecturers place more emphasis on content than on elaboration on the process and linking abstract mathematical concepts through appropriate representation through the use of diagrams. Further, it is also due to the fact that in a PNG classroom context, the ultimatum is the answer and not the reason and process, thus, it is evident of both TTC lecturers and TTC students possessing similar incorrect and incomplete conceptual understanding.
For some reasons mathematics lecturers did well in justifi cation of angle summation of triangle of 180° using the given triangle with angles A, B and C because
27 27 18 45 31 24 0 5 10 15 20 25 30 35 40 45 50
Misconception 1 Misconception 2 Misconception 3
Frequency of
Misconception
(%) Lecturers Students
Figure 4.5: Frequency of misconceptions (Source: made of data collected by the author)
of the factual common knowledge of angle summation of triangle. This also refl ects the numbers of years teaching in TTCs, with experience and exposure you become better in planning, preparation and teaching meaningful lessons. 64% of mathematics lecturers have fi ve or less years of teaching mathematics in TTCs, thus, their content knowledge is adequate to explain the angle summation base on common knowledge but their experience is limited when it comes to representation of the abstract concepts.
Students on the other hand performed better in representation with accuracy rate of 39%, while performing poorly in reasoning with rate of correctness of 16%. This implies that students may have exposure to similar experience in high or secondary school which gave them the advantage to demonstrate with diagram the angle summation but cannot adequately explain the reason of angle summation of triangle relating to angle on a straight line. Students still lacked the ability to connect knowledge about three angles in a triangle with angle on a straight line.
Further qualitative analysis identifi ed three types of misconceptions for angle summation of triangle. The most common was
, mostly viewing the given triangle and as equilateral or isosceles triangle by mere assumption. Both lecturers and students expose limitation of knowledge about generalization to being specifi c and detail by asserting numbers to justify angle summation of 180°. For example; both lecturers and students expressed that
° ° °
°. It was supposed to be a generalized statement about angle summation of triangle.
Misconception 2 (M2) also exposes the limitation of both students and lecturers knowledge about variety of ways to show the representation of angle summation of triangle. They possess the common abstract knowledge of angle summation of triangle of 180° but lack the skill and ability to show through representation of the concept.
Misconception 3 (M3) was due to incorrect reasoning for angle summation of triangle. This misconception was noted among the respondents of both TTC mathematics lecturers (24%) and year 1 students (18%) respectively. These exposes lack of
as partial or gap in understanding of angle sum of triangle of 180° is equivalent to angle on the straight line. They lack understanding that when angles A,B and C are placed together they are supplementary ‒ the three angles add up to 180 of angle on a straight line.
6. General Conclusion
The primary purpose of this study was to identify appropriate materials, methods and skill to enhance quality in teaching and learning of geometry topics in TTCs. This will in turn address misconceptions and errors or naïve beliefs about geometric concepts possessed by students and serve as a measuring stick for staff upskilling and continuous professional development to raise standards in mathematics in TTCs.
The results from fi ndings show that majority of students and mathematics lecturers of TTCs fell short of demonstrating appropriate and relevant conceptual and procedural knowledge in geometry. TTCs are post-secondary institutions that train students to be teachers in primary schools in PNG. The knowledge and skill acquired in TTC is necessarily essential for students (trainee teachers) to construct lessons that are rich and meaningful to primary school students in PNG.
From the three diff erent misconceptions identifi ed through the quantitative analysis, it is obvious that incorrect, gaps, or partial idea about geometry is persistent to both lecturers and students. In light of the fi ndings, it is evident that the conceptual understanding that students possessed was consistent to what the lecturers exposed. This implies that what the teacher does in the classroom aff ects the students conceptual understanding of mathematical concepts.
Thus, to conclude, it is recommended that the TTC mathematics lecturers be well trained and skilled to construct and model mathematics lessons on what to teach and how to teach with the aim of making TTC students become competent in interpreting the contents in Primary school mathematics text books and syllabus materials. Also to avoid misconceptions and provide a meaningful learning experience in geometry, structured lessons must be developed with improved methods of delivery using variety
fi nally, emphasis must be placed on both conceptual and procedural knowledge by TTC lecturers so that TTC students will be guided well to understand geometry concepts clearly and teach mathematics well to raise standards in mathematics in primary schools.
References
Apule,A. Anda, Ishizaka, H., Ozawa, H. (2016). Papua New Guinea Sample Mathematics Test Report Analysis of Grade 6,7 & 8, and Teachers College students performance on sample Mathematics Test for Papua New Guinea (PNG), Volume 10, NUE Journal of International Education Cooperation. Chamberlin, M., T, Candelaria, M. S, (2017). Learning
from Teaching Teachers: A lesson experiment in Area and Volume with prospective Teachers, Mathematics Education Research Group of
Australasia, Inc. Volume 20.1, p86-111, 2018.
Gomay, D., K, Ishizaka, H., Sakai, T., (2017), Analysis of Grade 4 Mathematics Trial Lesson: Teacher Interpretation and Teaching of the New Mathematics Text Book, Volume 11, NUE Journal of International education Cooperation.
Kaleva, W., T, (1998), Secondary Teacher Beliefs and Practices About Mathematics in Papua New Guinea Context, University of Goroka, PNG.
Kekeya, J., L, (2014), Curriculum Development and Implementation in Papua New Guinea, Contemporary PNG Studies: DWU Research Journal, Volume 21, November 2014.
PNG NDOE (2008), State of Papua new Guinea Education, Port Moresby, PNG.
Rena, R., (2011), Challenges for Quality Primary Education in Papua new Guinea ‒ A Case Study. Hindawi Publishing Cooperation, Education Research International, Volume 2011.