< 論文>
Japanese long-term care insurance and the time allocation of female family caregivers
Misuzu Azuma*
Department of Economics Chiba Keizai University, Japan Abstract
This paper examines how the introduction of the long-term care insurance (LTCI) in 2000 in Japan has changed the time allocation of female family caregivers. Drawing a sample from the Survey on Time Use and Leisure Activities, this paper estimates the association between the introduction of the LTCI and caregivers’ time allocation on caregiving, personal care, leisure, household work as well as market work. I find that the effects of the introduction of the LTCI on the time-allocation of caregivers depend on their employment status. In particular, the introduction of the LTCI has had little impact on the time allocation of caregivers who work for non-regular jobs while it has increased time spent on market work for caregivers who work for regular jobs and time spent on leisure for caregivers who are out of labor force.
Keywords
Japanese long-term care insurance; Long-term care; Time allocation
* I would like to thank Hiroshi Fujiu for helpful comments. All errors are my own.
Address: Department of Economics, Chiba Keizai University, 3-59-5 Todoroki, Inage, Chiba 263-0021, Japan. Email address: mazuma@cku.ac.jp.
1. Introduction
The demand for long-term care in Japan has been increasing because of a rapid population aging. Family members, especially female family members, have been playing a great role in providing elder care in Japan.
To socialize the burden of caregiving, Japan has introduced the long-term care insurance (LTCI) in 2000. Has the introduction of the LTCI decreased the burden of female family caregivers, thereby increased time spent on leisure and personal care for themselves? To answer this question, it would be important to examine how the introduction of the LTCI has changed their time allocation.
Most existing studies focus on the effect of the introduction of the LTCI on market work decisions of caregivers. For example, Shimizutani, Suzuki, and Noguchi (2008) show that the introduction of the LTCI increases the labor force participation and hours of work among female caregivers.1 The notable exception is Kuroda (2016), who examines the effect of the introduction of the LTCI on caregivers' time allocation on caregiving, leisure, personal care, and household work as well as market work. The sample in Kuroda (2016) is limited to regular workers; little is known about the effect of the introduction of the LTCI on the time-use of caregivers who work for non-regular jobs and who are out of labor force. According to the Statistics Bureau (2007), 567,700 people quit or changed their jobs to provide care between 2002 and 2007; 82 percent of them are women. Some of family caregivers might have opted to work for non-regular jobs instead
1 Fu, Noguchi, Kawamura, Takahashi, and Tamiya (2017) also examine the effect of the introduction of the LTCI on labor force participation of caregivers as well as the effect of the major amendment of the LTCI in 2006 on labor force participation of caregivers.
of regular jobs to cope with providing elder care.
The purpose of this paper is to examine how the introduction of the LTCI in 2000 changes the time allocation of female family caregivers.
To this end, the paper draws a sample of women regardless of their employment status from the waves of 1996, 2001, and 2006 of the Survey on Time Use and Leisure Activities (STULA). By employing the Tobit model, the paper estimates the association between the introduction of the LTCI and caregivers' time allocation on caregiving, personal care, leisure, household work as well as market work.
This study finds that the effect of the introduction of the LTCI on the time allocation of caregivers depends on their employment status. Among regular workers, caregivers are less likely to spend their time on market work compared to non-caregivers before the introduction of the LTCI.
After the introduction of the LTCI, caregivers spend more time on market work and less time on leisure compared to non-caregivers. Time spent on caregiving has not significantly changed after the introduction of the LTCI.
Among non-regular workers, caregivers are less likely to spend their time on market work and leisure and more likely to spend their time on household work compared to non-caregivers before the introduction of the LTCI. These patters remain the same after the introduction of the LTCI. Time spent on caregiving has not significantly changed after the introduction of the LTCI, either.
Among those who are out of labor force, caregivers are less likely to spend their time on leisure and more likely to spend their time on household work compared to non-caregivers before the introduction of the LTCI. After the introduction, caregivers significantly increase their time
spent on leisure compared to non-caregivers and time spent on caregiving has significantly decreased.
These findings suggest that the introduction of the LTCI has had little impact on the time allocation of caregivers who work for non-regular jobs while it has increased time spent on market work for caregivers who work for regular jobs and time spent on leisure for caregivers who are out of labor force.
The paper is organized as follows. Section 2 describes a sample drawn from the STULA. Section 3 presents empirical specifications and discusses the results. This is followed by a concluding section.
2. Sample from the STULA
This section describes a sample drawn from a restricted version (tokumei data) of the STULA, which is provided by National Statics Center based on the Statistics Act. The STULA randomly draws households from the nationwide every five years and asks each household member of the household aged 10 and over to record his or her time-use of two consecutive days.
This paper draws a sample from the waves of 1996, 2001, and 2006, which covers the year in which the LTCI has been introduced. The waves of 1991 and before are not used because these waves provide no information on whether a respondent works for a regular job or a non-regular job.
To have a comparable sample with Kuroda (2016), this paper restricts the sample to women who are in their 30s through 50s.
For estimation, I use the information on the time-use of “ordinary day.” As mentioned above, each respondent records her time-use on two consecutive days. The respondent is asked to choose which type of a day
it is among seven categories: (1) private trip, (2) excursion, (3) ceremonial occasions, (4) work-related trip or training, (5) medical treatment, (6) holiday, and (7) other. The category (7) applies to all of the types of days that don't fall upon (1) through (6) categories. I define the type of day as ordinary day if the respondent chooses the category (7). When the time- use of the first day and the one of the second day are recorded on ordinary day, I take an average of the time-use of two days for each activity.
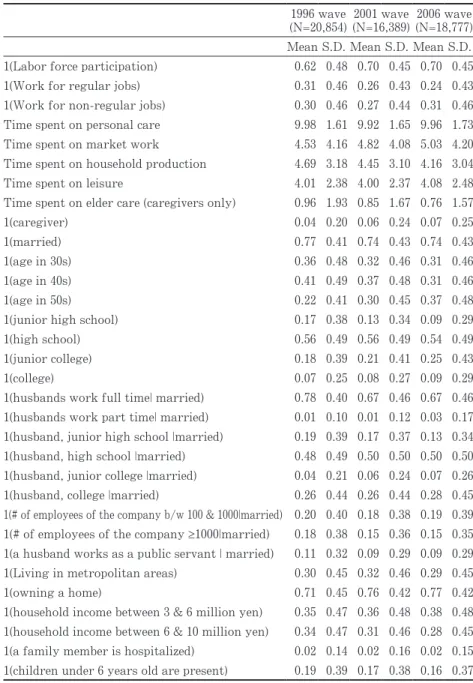
Table 1 reports descriptive statistics for the sample. The second and third columns of Table 1 report mean and standard deviation of variables used in the estimations for 20,854 women drawn from the 1996 wave; the fourth and fifth columns for 16,389 women from the 2001 wave; the sixth and seventh columns for 18,777 women from the 2006 wave.
Over the ten years of the sample period, the number of caregivers has gradually increased. The frequency of women who work for regular jobs has declined; the one for non-regular jobs has declined from 1996 to 2001 while it has increased from 2001 to 2006. As for time-use, time spent on personal care and leisure has remained constant over the sample period.
Time spent on market work has increased while time spent on household production has decreased.
Regular workers are those who report they are regular employees.
Non-regular workers are those who report they are part-time workers, temporary workers, or other types of employees.
Personal care is defined as time spent on sleep, having meals, and taking care of oneself. Market work is defined as time spent on market work and commuting. Leisure is defined as time spent on watching television, listening to the radio, reading newspapers and magazines, rest, learning, hobby, sports, volunteering, and socializing. Household production is
defined as time spent on household work, caregiving for a family member, child rearing, and shopping.
3. Empirical specifications and estimation results
This section presents the empirical specifications and discusses the results.
First, I examine the relationship between the introduction of the LTCI and the market work decisions of caregivers. Next, I examine the relationship between the introduction of the LTCI and the time allocation of caregivers.
3.1 The relationship between the introduction of the LTCI and the market work decisions of caregivers
First, I examine the relationship between the introduction of the LTCI and the market work decisions of caregivers. The regression is specified as follows:
Yit = α1+α2 Cit+α3 It+α4 Cit×It+Zit α5+eit.
The dependent variable Yit is an indicator for three types of market work decisions for a respondent i in year t (1996, 2001 or 2006): (i) whether a respondent participates in the labor market, (ii) whether a respondent works for a regular job, and (iii) whether a respondent works for a non- regular job. The equation is estimated by the OLS, probit, and logit models.
The explanatory variable Cit is an indicator for whether a respondent i is a caregiver for her family member in year t. A respondent is defined as a caregiver if she reports that she cares for a family member. The explanatory variable It is an indicator for the sample period in which the LTCI has been implemented. Zit is a vector of demographic characteristics of the respondent i in year t and information on her household.
Specifically, demographic characteristics include marital status, age, and years of schooling of the respondent. The information on the husband of the respondent includes an indicator for whether he works for full time or part-time, years of schooling, and the number of employees of the company that he works for.2 The information on the household includes whether the respondent lives in the metropolitan area, the household income, an indicator for whether a family member is hospitalized, and an indicator for whether children who are under six years old are present in the household.
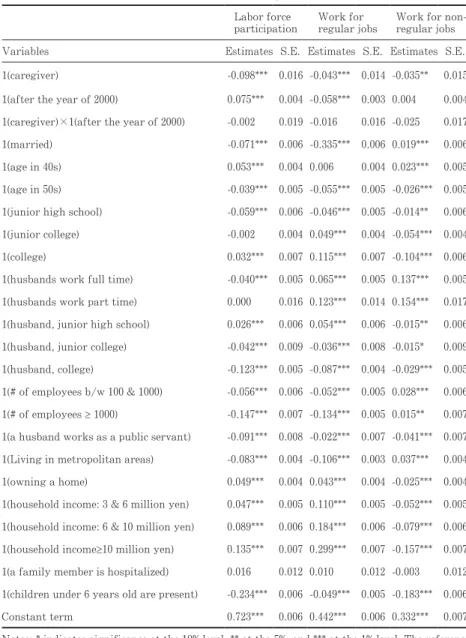
Table 2 reports the OLS estimates for the relationship between the introduction of the LTCI and the market work decisions of caregivers.
The results for the probit and logit models are unchanged. Before the introduction of the LTCI, caregivers are significantly less likely to participate in the labor market by almost 10 percentage points compared to non-caregivers. In particular, caregivers are less likely to work for regular jobs by 4 percentage points compared to non-caregivers. Caregivers are also less likely to work for non-regular jobs by 3.5 percentage points compared to non-caregivers. These patterns remain the same after the introduction of the LTCI in 2000.
3.2 The relationship between the introduction of the LTCI and the time allocation of caregivers
Next, I examine the relationship between the introduction of the LTCI and the time allocation of caregivers. The regression is specified as follows:
2 Regarding the information on the respondent’s husband, Tables 2-5 report estimates for the interaction term between 1(married) and the information on the husband.
Tit=α1+α2 Cit+α3 It+α4 Cit×It+Zit α5+eit.
The dependent variable Tit is time spent on the following activities by a respondent i in year t (1996, 2001 or 2006): (i) personal care, (ii) market work, (iii) household production, (iv) leisure, and (v) caregiving for her family member. The equation is estimated for each activity by the Tobit model. Other variables in the equation are the same as those in the equation in section 3.1.
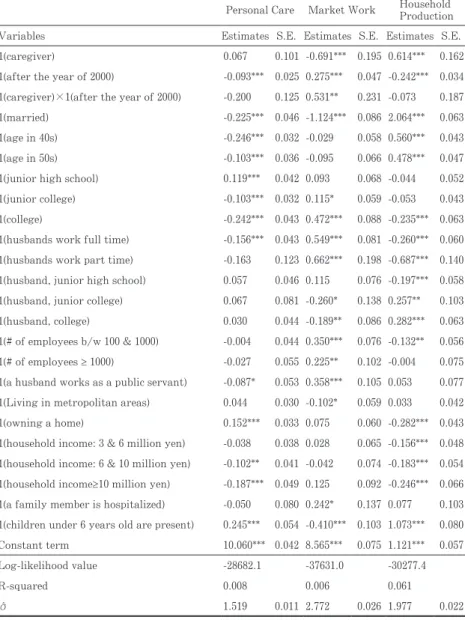
Table 3 reports the Tobit estimates for the relationship between the introduction of the LTCI and the time allocation of caregivers for regular workers, Table 4 for non-regular workers, and Table 5 for those who are out of labor force. As for the estimates for time spent on caregiving, the sample is restricted to caregivers.
Among regular workers, caregivers are less likely to spend their time on market work by 41 minutes (per day) compared to non-caregivers before the introduction of the LTCI.3 This gap gets smaller as caregivers spend more time on market work by 31 minutes compared to non-caregivers after the introduction of the LTCI. There is no significant difference in time spent on leisure between caregivers and non-caregivers before the introduction of the LTCI. After the introduction of the LTCI, caregivers are less likely to spend their time on leisure by 21 minutes compared to non-caregivers. Time spent on caregiving has not significantly changed after the introduction of the LTCI. Therefore, caregivers who work for regular jobs spend more time on market work by sacrificing their time spent on leisure. This is consistent with the finding shown by Kuroda (2016).
Among non-regular workers, caregivers are less likely to spend their
3 The partial effects in section 3.2 are evaluated at the sample mean.
time on market work by 23 minutes (per day) and leisure by 24 minutes and more likely to spend their time on household production by 37 minutes compared to non-caregivers before the introduction of the LTCI. These patterns remain the same after the introduction of the LTCI. Time spent on caregiving has not significantly changed after the introduction of the LTCI, either.
Among those who are out of labor force, caregivers are less likely to spend their time on leisure by 1.3 hours (per day) and more likely to spend their time on household production by 1.4 hours compared to non- caregivers before the introduction of the LTCI. After the introduction of the LTCI, caregivers increase their time spent on leisure by 29 minutes compared to non-caregivers. Time spent on caregiving after the introduction of the LTCI decreases by 28 minutes compared to the time spent on caregiving before the introduction of the LTCI.
These findings suggest that the introduction of the LTCI has had little impact on the time-use of caregivers who work for non-regular jobs while it has a small positive impact on time spent on market work for caregivers who work for regular jobs and time spent on leisure for caregivers who are out of labor force.
4. Conclusion
This paper examines how the introduction of the LTCI in 2000 changes the time allocation of female family caregivers. Drawing a sample of women regardless of their employment status from the waves of 1996, 2001, and 2006 of the STULA, the paper estimates the association between the introduction of the LTCI and caregivers' time allocation on caregiving, personal care, leisure, household production as well as market work. I
find that the effects of the introduction of the LTCI on the time allocation of caregivers depend on their employment status. In particular, the introduction of the LTCI has had little impact on the time allocation of caregivers who work for non-regular jobs. After the introduction of the LTCI, caregivers who work for regular jobs spend more time on market work while they spend less time on leisure. As for caregivers who are out of labor force, they spend more time on leisure while they spend less time on caregiving after the introduction of the LTCI. Findings from this study imply that, compared to caregivers who work for regular jobs, caregivers who work for non-regular jobs may have less support at their workplace and be unable to change their hours of work flexibly.
This study does not address the possibility that being a caregiver is endogenous to her time allocation decision.4 Moreover, the sample in this study is based on the employment status of respondents, which causes sample selection bias. Addressing the endogeneity bias and the selection bias with a model that links caregiving, employment status and time allocation is left for future research.
4 Among existing studies that address the endogeneity between caregiving and market work decisions of caregivers with the IV approach, see, for example, Ettner (1996) and Heitmueller (2007).
References
Ettner, S. L. 1996. The Opportunity costs of elder care. Journal of Human Resources 31(1), 189-205.
Fu, R., Noguchi, H., Kawamura, A., Takahashi, H., and Tamiya, N. 2017.
Spillover effect of Japanese long-term care insurance as an employment promotion policy for family caregivers. Journal of Health Economics 56, 103-112.
Heitmueller, Axel. 2007. The chicken or the egg? Endogeneity in labour market participation of informal carers in England. Journal of Health Economics 26(3), 536-559.
Kuroda, S. 2016. Work-life conflict in the intermediate age bracket: trends in working hours and time spent caring for elderly family members.
Japan Labor Review 13(1), 55-72.
Shimizutani, S., Suzuki, W., and Noguchi, H. The socialization of at-home elderly care and female labor market participation: micro-level evidence from Japan. Japan and World Economy 20(1), 82-96.
Statics Bureau, Ministry of Internal Affairs and Communications, 2007.
Employment Status Survey.
Table 1: Descriptive statistics (note: A unit of time spent on each activity is an hour.) 1996 wave
(N=20,854)
2001 wave (N=16,389)
2006 wave (N=18,777) Mean S.D. Mean S.D. Mean S.D.
1(Labor force participation) 0.62 0.48 0.70 0.45 0.70 0.45
1(Work for regular jobs) 0.31 0.46 0.26 0.43 0.24 0.43
1(Work for non-regular jobs) 0.30 0.46 0.27 0.44 0.31 0.46 Time spent on personal care 9.98 1.61 9.92 1.65 9.96 1.73 Time spent on market work 4.53 4.16 4.82 4.08 5.03 4.20 Time spent on household production 4.69 3.18 4.45 3.10 4.16 3.04
Time spent on leisure 4.01 2.38 4.00 2.37 4.08 2.48
Time spent on elder care (caregivers only) 0.96 1.93 0.85 1.67 0.76 1.57
1(caregiver) 0.04 0.20 0.06 0.24 0.07 0.25
1(married) 0.77 0.41 0.74 0.43 0.74 0.43
1(age in 30s) 0.36 0.48 0.32 0.46 0.31 0.46
1(age in 40s) 0.41 0.49 0.37 0.48 0.31 0.46
1(age in 50s) 0.22 0.41 0.30 0.45 0.37 0.48
1(junior high school) 0.17 0.38 0.13 0.34 0.09 0.29
1(high school) 0.56 0.49 0.56 0.49 0.54 0.49
1(junior college) 0.18 0.39 0.21 0.41 0.25 0.43
1(college) 0.07 0.25 0.08 0.27 0.09 0.29
1(husbands work full time| married) 0.78 0.40 0.67 0.46 0.67 0.46 1(husbands work part time| married) 0.01 0.10 0.01 0.12 0.03 0.17 1(husband, junior high school |married) 0.19 0.39 0.17 0.37 0.13 0.34 1(husband, high school |married) 0.48 0.49 0.50 0.50 0.50 0.50 1(husband, junior college |married) 0.04 0.21 0.06 0.24 0.07 0.26 1(husband, college |married) 0.26 0.44 0.26 0.44 0.28 0.45 1(# of employees of the company b/w 100 & 1000|married) 0.20 0.40 0.18 0.38 0.19 0.39 1(# of employees of the company ≥1000|married) 0.18 0.38 0.15 0.36 0.15 0.35 1(a husband works as a public servant | married) 0.11 0.32 0.09 0.29 0.09 0.29 1(Living in metropolitan areas) 0.30 0.45 0.32 0.46 0.29 0.45
1(owning a home) 0.71 0.45 0.76 0.42 0.77 0.42
1(household income between 3 & 6 million yen) 0.35 0.47 0.36 0.48 0.38 0.48 1(household income between 6 & 10 million yen) 0.34 0.47 0.31 0.46 0.28 0.45 1(a family member is hospitalized) 0.02 0.14 0.02 0.16 0.02 0.15 1(children under 6 years old are present) 0.19 0.39 0.17 0.38 0.16 0.37
Table 2: OLS estimates for the relationship between the introduction of the LTCI and market work decisions of caregivers (N=56,020)
Labor force participation
Work for regular jobs
Work for non- regular jobs
Variables Estimates S.E. Estimates S.E. Estimates S.E.
1(caregiver) -0.098*** 0.016 -0.043*** 0.014 -0.035** 0.015
1(after the year of 2000) 0.075*** 0.004 -0.058*** 0.003 0.004 0.004 1(caregiver)×1(after the year of 2000) -0.002 0.019 -0.016 0.016 -0.025 0.017
1(married) -0.071*** 0.006 -0.335*** 0.006 0.019*** 0.006
1(age in 40s) 0.053*** 0.004 0.006 0.004 0.023*** 0.005
1(age in 50s) -0.039*** 0.005 -0.055*** 0.005 -0.026*** 0.005
1(junior high school) -0.059*** 0.006 -0.046*** 0.005 -0.014** 0.006
1(junior college) -0.002 0.004 0.049*** 0.004 -0.054*** 0.004
1(college) 0.032*** 0.007 0.115*** 0.007 -0.104*** 0.006
1(husbands work full time) -0.040*** 0.005 0.065*** 0.005 0.137*** 0.005 1(husbands work part time) 0.000 0.016 0.123*** 0.014 0.154*** 0.017 1(husband, junior high school) 0.026*** 0.006 0.054*** 0.006 -0.015** 0.006 1(husband, junior college) -0.042*** 0.009 -0.036*** 0.008 -0.015* 0.009 1(husband, college) -0.123*** 0.005 -0.087*** 0.004 -0.029*** 0.005 1(# of employees b/w 100 & 1000) -0.056*** 0.006 -0.052*** 0.005 0.028*** 0.006 1(# of employees ≥ 1000) -0.147*** 0.007 -0.134*** 0.005 0.015** 0.007 1(a husband works as a public servant) -0.091*** 0.008 -0.022*** 0.007 -0.041*** 0.007 1(Living in metropolitan areas) -0.083*** 0.004 -0.106*** 0.003 0.037*** 0.004
1(owning a home) 0.049*** 0.004 0.043*** 0.004 -0.025*** 0.004
1(household income: 3 & 6 million yen) 0.047*** 0.005 0.110*** 0.005 -0.052*** 0.005 1(household income: 6 & 10 million yen) 0.089*** 0.006 0.184*** 0.006 -0.079*** 0.006 1(household income≥10 million yen) 0.135*** 0.007 0.299*** 0.007 -0.157*** 0.007 1(a family member is hospitalized) 0.016 0.012 0.010 0.012 -0.003 0.012 1(children under 6 years old are present) -0.234*** 0.006 -0.049*** 0.005 -0.183*** 0.006
Constant term 0.723*** 0.006 0.442*** 0.006 0.332*** 0.007
Notes: * indicates significance at the 10% level, ** at the 5%, and *** at the 1% level. The reference groups are 1(age in 30s), 1(high school), 1(husband out of labor force), 1(husband, high school), 1(# of employees that a husband work for<100), and 1(household income<3 million yen).
Table 3: Tobit estimates for the relationship between the introduction of the LTCI and time-use among regular workers (N=15,609)
Personal Care Market Work Household Production
Variables Estimates S.E. Estimates S.E. Estimates S.E.
1(caregiver) 0.067 0.101 -0.691*** 0.195 0.614*** 0.162
1(after the year of 2000) -0.093*** 0.025 0.275*** 0.047 -0.242*** 0.034 1(caregiver)×1(after the year of 2000) -0.200 0.125 0.531** 0.231 -0.073 0.187
1(married) -0.225*** 0.046 -1.124*** 0.086 2.064*** 0.063
1(age in 40s) -0.246*** 0.032 -0.029 0.058 0.560*** 0.043
1(age in 50s) -0.103*** 0.036 -0.095 0.066 0.478*** 0.047
1(junior high school) 0.119*** 0.042 0.093 0.068 -0.044 0.052
1(junior college) -0.103*** 0.032 0.115* 0.059 -0.053 0.043
1(college) -0.242*** 0.043 0.472*** 0.088 -0.235*** 0.063
1(husbands work full time) -0.156*** 0.043 0.549*** 0.081 -0.260*** 0.060 1(husbands work part time) -0.163 0.123 0.662*** 0.198 -0.687*** 0.140 1(husband, junior high school) 0.057 0.046 0.115 0.076 -0.197*** 0.058 1(husband, junior college) 0.067 0.081 -0.260* 0.138 0.257** 0.103
1(husband, college) 0.030 0.044 -0.189** 0.086 0.282*** 0.063
1(# of employees b/w 100 & 1000) -0.004 0.044 0.350*** 0.076 -0.132** 0.056 1(# of employees ≥ 1000) -0.027 0.055 0.225** 0.102 -0.004 0.075 1(a husband works as a public servant) -0.087* 0.053 0.358*** 0.105 0.053 0.077 1(Living in metropolitan areas) 0.044 0.030 -0.102* 0.059 0.033 0.042
1(owning a home) 0.152*** 0.033 0.075 0.060 -0.282*** 0.043
1(household income: 3 & 6 million yen) -0.038 0.038 0.028 0.065 -0.156*** 0.048 1(household income: 6 & 10 million yen) -0.102** 0.041 -0.042 0.074 -0.183*** 0.054 1(household income≥10 million yen) -0.187*** 0.049 0.125 0.092 -0.246*** 0.066 1(a family member is hospitalized) -0.050 0.080 0.242* 0.137 0.077 0.103 1(children under 6 years old are present) 0.245*** 0.054 -0.410*** 0.103 1.073*** 0.080
Constant term 10.060*** 0.042 8.565*** 0.075 1.121*** 0.057
Log-likelihood value -28682.1 -37631.0 -30277.4
R-squared 0.008 0.006 0.061
σ̂ 1.519 0.011 2.772 0.026 1.977 0.022
Notes: * indicates significance at the 10% level, ** at the 5%, and *** at the 1% level. The reference groups are 1(age in 30s), 1(high school), 1(husband out of labor force), 1(husband, high school), 1(# of employees that a husband work for<100), and 1(household income<3 million yen).
Table 3 (continued): Tobit estimates for the relationship between the introduction of the LTCI and time-use among regular workers (N=15,609)
Leisure Caregiving (N=747) (Caregivers only)
Variables Estimates S.E. Estimates S.E.
1(caregiver) 0.098 0.123 N.A. N.A.
1(after the year of 2000) 0.045 0.031 -0.427 0.316
1(caregiver)×1(after the year of 2000) -0.362** 0.147 N.A. N.A.
1(married) -0.409*** 0.055 0.303 0.444
1(age in 40s) -0.075*** 0.039 1.202*** 0.441
1(age in 50s) -0.060 0.044 1.411*** 0.436
1(junior high school) -0.105** 0.048 -0.428 0.446
1(junior college) -0.023 0.039 0.260 0.333
1(college) -0.130** 0.056 0.744 0.457
1(husbands work full time) -0.104** 0.051 -0.385 0.445
1(husbands work part time) 0.125 0.148 -15.804 -
1(husband, junior high school) 0.046 0.053 -0.265 0.513
1(husband, junior college) -0.133 0.085 1.467* 0.762
1(husband, college) -0.142*** 0.054 0.777 0.476
1(# of employees b/w 100 & 1000) -0.139*** 0.051 0.381 0.566
1(# of employees ≥ 1000) -0.147** 0.063 -0.546 0.633
1(a husband works as a public servant) -0.247*** 0.064 -0.912 0.618 1(Living in metropolitan areas) -0.044 0.038 0.492 0.337
1(owning a home) -0.017 0.040 0.335 0.430
1(household income: 3 & 6 million yen) 0.059 0.046 0.194 0.428 1(household income: 6 & 10 million yen) 0.150*** 0.051 0.175 0.470 1(household income≥10 million yen) 0.156*** 0.060 -0.027 0.551 1(a family member is hospitalized) -0.264*** 0.087 -0.092 0.380 1(children under 6 years old are present) -0.900 0.062 0.527 0.751
Constant term 3.395*** 0.051 -3.531*** 0.639
Log-likelihood value -31220.3 -664.8
R-squared 0.013 0.028
σ ̂ 1.845 0.017 2.787 0.256
Notes: * indicates significance at the 10% level, ** at the 5%, and *** at the 1% level.
The reference groups are 1(age in 30s), 1(high school), 1(husband out of labor force), 1(husband, high school), 1(# of employees that a husband work for<100), and 1(household income<3 million yen).
Table 4: Tobit estimates for the relationship between the introduction of the LTCI and time-use among non-regular workers (N=16,751)
Personal Care Market Work Household Production
Variables Estimates S.E. Estimates S.E. Estimates S.E.
1(caregiver) -0.023 0.100 -0.395* 0.211 0.634*** 0.173
1(after the year of 2000) -0.104*** 0.025 0.257*** 0.048 -0.235*** 0.035 1(caregiver)×1(after the year of 2000) -0.113 0.122 -0.009 0.253 0.102 0.204
1(married) -0.373*** 0.048 -1.519*** 0.090 2.242*** 0.067
1(age in 40s) -0.289*** 0.032 0.164*** 0.058 0.221*** 0.044
1(age in 50s) -0.103*** 0.037 0.073 0.067 0.023 0.049
1(junior high school) 0.155*** 0.040 0.144** 0.069 -0.185*** 0.050
1(junior college) -0.065* 0.033 -0.061 0.063 0.008 0.046
1(college) -0.064 0.059 -0.272** 0.129 -0.042 0.087
1(husbands work full time) -0.062 0.038 0.248*** 0.072 -0.026 0.054 1(husbands work part time) 0.230** 0.096 0.437** 0.174 -0.487*** 0.127 1(husband, junior high school) 0.057 0.040 0.225*** 0.070 -0.235*** 0.053 1(husband, junior college) -0.055 0.057 -0.265** 0.114 0.142* 0.081 1(husband, college) -0.085** 0.035 -0.323*** 0.070 0.388*** 0.052 1(# of employees b/w 100 & 1000) -0.030 0.036 -0.258*** 0.067 0.126** 0.050 1(# of employees ≥ 1000) -0.077* 0.039 -0.444*** 0.072 0.272*** 0.055 1(a husband works as a public servant) -0.018 0.053 -0.555*** 0.099 0.304*** 0.073 1(Living in metropolitan areas) -0.046* 0.026 -0.380*** 0.049 0.277 0.036 1(owning a home) 0.135*** 0.029 0.090^{*} 0.054 -0.176*** 0.040 1(household income: 3 & 6 million yen) -0.079** 0.040 0.097 0.070 -0.227*** 0.054 1(household income: 6 & 10 million yen) -0.166*** 0.045 0.133* 0.079 -0.168*** 0.061 1(household income≥10 million yen) -0.241*** 0.057 0.097 0.108 -0.095 0.079 1(a family member is hospitalized) 0.074 0.090 -0.338 0.180 0.267* 0.139 1(children under 6 years old are present) 0.302*** 0.049 -0.787*** 0.099 1.003*** 0.077
Constant term 10.400*** 0.045 7.139*** 0.079 1.999*** 0.059
Log-likelihood value -31260.4 -40236.0 -35481.8
R-squared 0.010 0.014 0.052
σ ̂ 1.563 0.012 2.864 0.020 2.117 0.016
Notes: * indicates significance at the 10% level, ** at the 5%, and *** at the 1% level. The reference groups are 1(age in 30s), 1(high school), 1(husband out of labor force), 1(husband, high school), 1(# of employees that a husband work for<100), and 1(household income<3 million yen).
Table 4 (continued): Tobit estimates for the relationship between the introduction of the LTCI and time-use among non-regular workers (N=16,751)
Leisure Caregiving (N=826) (Caregivers only)
Variables Estimates S.E. Estimates S.E.
1(caregiver) -0.424*** 0.128 N.A.
1(after the year of 2000) 0.069** 0.033 0.114 0.294
1(caregiver)×1(after the year of 2000) 0.108 0.153 N.A.
1(married) -0.243*** 0.061 0.126 0.438
1(age in 40s) 0.033 0.041 0.149 0.413
1(age in 50s) 0.164*** 0.047 0.471 0.423
1(junior high school) -0.058 0.050 0.050 0.307
1(junior college) 0.038 0.043 0.043 0.337
1(college) 0.185** 0.084 0.451 0.660
1(husbands work full time) -0.063 0.048 -0.577 0.396
1(husbands work part time) -0.080 0.131 0.007 0.659
1(husband, junior high school) -0.037 0.050 -0.076 0.362
1(husband, junior college) 0.121 0.079 -0.690 0.590
1(husband, college) -0.006 0.046 -0.602 0.416
1(# of employees b/w 100 & 1000) 0.096** 0.046 0.974*** 0.354 1(# of employees ≥ 1000) 0.146*** 0.050 1.152*** 0.443 1(a husband works as a public servant) 0.122* 0.066 1.686*** 0.623 1(Living in metropolitan areas) 0.140*** 0.034 0.218 0.285
1(owning a home) -0.111*** 0.038 -0.410 0.346
1(household income: 3 & 6 million yen) 0.143*** 0.050 -0.332 0.352 1(household income: 6 & 10 million yen) 0.115** 0.055 -0.440 0.394 1(household income≥10 million yen) 0.143** 0.071 -0.465 0.532 1(a family member is hospitalized) -0.235** 0.111 -0.122 0.378 1(children under 6 years old are present) -0.668*** 0.063 -0.401 0.711
Constant term 3.652*** 0.057 -1.272** 0.512
Log-likelihood value -35031.9 -925.5
R-squared 0.004 0.013
σ ̂ 1.995 0.015 2.863 0.270
Notes: * indicates significance at the 10% level, ** at the 5%, and *** at the 1% level.
The reference groups are 1(age in 30s), 1(high school), 1(husband out of labor force), 1(husband, high school), 1(# of employees that a husband work for<100), and 1(household income<3 million yen).
Table 5: Tobit estimates for the relationship between the introduction of the LTCI and time-use among those who are out of labor force (N=18,161)
Personal Care Household Production
Variables Estimates S.E. Estimates S.E.
1(caregiver) -0.189** 0.087 1.434*** 0.153
1(after the year of 2000) 0.043 0.026 -0.248*** 0.041
1(caregiver)×1(after the year of 2000) -0.148 0.105 -0.246 0.182
1(married) -0.840*** 0.055 2.640*** 0.086
1(age in 40s) -0.142*** 0.035 -0.231*** 0.057
1(age in 50s) -0.038 0.040 -0.398*** 0.064
1(junior high school) 0.305*** 0.047 -0.199*** 0.067
1(junior college) -0.095*** 0.032 0.229*** 0.052
1(college) -0.186*** 0.047 0.406*** 0.080
1(husbands work full time) -0.088** 0.038 0.061 0.060 1(husbands work part time) -0.013 0.113 -0.474** 0.189 1(husband, junior high school) 0.034 0.048 -0.158** 0.072
1(husband, junior college) 0.067 0.056 0.101 0.089
1(husband, college) -0.013 0.033 0.217*** 0.054
1(# of employees b/w 100 & 1000) -0.040 0.038 0.014 0.060
1(# of employees ≥ 1000) -0.029 0.039 0.024 0.062
1(a husband works as a public servant) -0.037 0.046 0.147** 0.074 1(Living in metropolitan areas) 0.029 0.026 0.128*** 0.041
1(owning a home) 0.093*** 0.029 -0.021 0.046
1(household income: 3 & 6 million yen) -0.184*** 0.045 0.019 0.069 1(household income: 6 & 10 million yen) -0.316*** 0.049 -0.014 0.075 1(household income≥10 million yen) -0.473*** 0.057 -0.048 0.090 1(a family member is hospitalized) 0.028 0.097 0.329** 0.159 1(children under 6 years old are present) 0.214*** 0.036 1.356*** 0.060
Constant term 11.242*** 0.055 4.424*** 0.084
Log-likelihood value -35360.0 -43279.0
R-squared 0.018 0.050
σ ̂ 1.695 0.014 2.659 0.015
Notes: * indicates significance at the 10% level, ** at the 5%, and *** at the 1% level.
The reference groups are 1(age in 30s), 1(high school), 1(husband out of labor force), 1(husband, high school), 1(# of employees that a husband work for<100), and 1(household income<3 million yen).
Table 5 (continued): Tobit estimates for the relationship between the introduction of the LTCI and time-use among those who are out of labor force (N=18,161)
Leisure Caregiving (N=1,272) (Caregivers only)
Variables Estimates S.E. Estimates S.E.
1(caregiver) -1.330*** 0.132 N.A.
1(after the year of 2000) 0.187*** 0.038 -0.479** 0.223 1(caregiver)×1(after the year of 2000) 0.483*** 0.157 N.A.
1(married) -1.596*** 0.081 -1.408*** 0.366
1(age in 40s) 0.411*** 0.052 0.598* 0.338
1(age in 50s) 0.529*** 0.060 0.794** 0.352
1(junior high school) -0.019 0.065 -0.149 0.298
1(junior college) -0.176*** 0.047 0.061 0.258
1(college) -0.266*** 0.071 1.048** 0.457
1(husbands work full time) 0.033 0.055 0.580** 0.292
1(husbands work part time) 0.509*** 0.173 -0.269 0.672
1(husband, junior high school) 0.152** 0.067 0.168 0.344
1(husband, junior college) -0.154** 0.078 -0.021 0.467
1(husband, college) -0.205*** 0.049 0.140 0.271
1(# of employees b/w 100 & 1000) 0.081 0.054 -0.191 0.311
1(# of employees ≥ 1000) 0.039 0.056 -0.376 0.333
1(a husband works as a public servant) -0.064 0.067 -0.134 0.375 1(Living in metropolitan areas) -0.069* 0.038 -0.370* 0.213
1(owning a home) -0.114*** 0.042 0.137 0.287
1(household income: 3 & 6 million yen) 0.136** 0.064 0.181 0.295 1(household income: 6 & 10 million yen) 0.232*** 0.070 -0.226 0.314 1(household income≥10 million yen) 0.376*** 0.084 0.035 0.387 1(a family member is hospitalized) -0.385*** 0.138 0.119 0.285 1(children under 6 years old are present) -1.429*** 0.052 -0.870* 0.454
Constant term 6.861*** 0.081 0.928** 0.446
Log-likelihood value -41738.3 -2251.3
R-squared 0.038 0.014
σ ̂ 2.445 0.013 3.116 0.126
Notes: * indicates significance at the 10% level, ** at the 5%, and *** at the 1% level.
The reference groups are 1(age in 30s), 1(high school), 1(husband out of labor force), 1(husband, high school), 1(# of employees that a husband work for<100), and 1(household income<3 million yen).