第
341
号 強震ネットワーク 強震データ Vol. 27(平成21
年 No. 1)(CD-ROM版).2010年3
月発行 第342
号 強震ネットワーク 強震データ Vol. 28(平成21
年 No. 2)(CD-ROM版).2010年3
月発行第
343
号 阿寺断層系における深層ボーリング調査の概要と岩石物性試験結果(付録CD-ROM) 15pp.2010
年3
月発行 第344
号 地すべり地形分布図 第46
集 「札幌・苫小牧」19葉(5万分の1)
.2010年7
月発行第
345
号 地すべり地形分布図 第47
集「夕張岳」16葉(5万分の1)
.2010年8
月発行第
346
号 長岡における積雪観測資料(31)(2006/07 , 2007/08 , 2008/09 冬期)47pp.2010年9
月発行 第347
号 地すべり地形分布図 第48
集「羽幌・留萌」17
葉(5万分の1).2010
年11
月発行第
348
号 平成18
年度 大都市大震災軽減化特別プロジェクト実大3
層RC
建物実験報告書(付録DVD) 68pp.2010
年8
月発行 第349
号 防災科学技術研究所による深層掘削調査の概要と岩石物性試験結果(足尾・新宮・牛伏寺)(付録CD-ROM)
12pp.2010
年8
月発行第
350
号 アジア防災科学技術情報基盤(DRH-Asia)コンテンツ集 266pp.2010年12
月発行 第351
号 新庄における気象と降積雪の観測(2009/10年冬期) 31pp.2010年12
月発行第
352
号 平成18
年度 大都市大震災軽減化特別プロジェクトⅡ 木造建物実験 -震動台活用による構造物の耐震性向上研究-
(付録
CD-ROM)120pp.2011
年1
月発行第
353
号 地形・地盤分類および常時微動のH/V
スペクトル比を用いた地震動のスペクトル増幅率の推定 242pp.2011
年1
月発行第
354
号 地震動予測地図作成ツールの開発(付録DVD) 155pp.2011
年5
月発行第
355
号 ARTSにより計測した浅間山の火口内温度分布(2007年4
月から2010
年3
月) 28pp.2011年1
月発行 第356
号 長岡における積雪観測資料(32)(2009/10 冬期) 29pp.2011年2
月発行第
357
号 浅間山鬼押出火山観測井コア試料の岩相と層序(付録DVD) 32pp.2011
年2
月発行 第358
号 強震ネットワーク 強震データ Vol. 29(平成22
年 No. 1)(CD-ROM版).2011年2
月発行 第359
号 強震ネットワーク 強震データ Vol. 30(平成22
年 No. 2)(CD-ROM版).2011年2
月発行 第360
号 K-NET・KiK-net強震データ(1996-2010)(DVD
版 6枚組).2011年3
月発行第
361
号 統合化地下構造データベースの構築 <地下構造データベース構築ワーキンググループ報告書> 平成23
年3
月238pp.2011
年3
月発行第
362
号 地すべり地形分布図 第49
集「旭川」16
葉(5万分の1)
.2011年11
月発行 第363
号 長岡における積雪観測資料(33)(2010/11 冬期) 29pp.2012年2
月発行 第364
号 新庄における気象と降積雪の観測(2010/11年冬期) 45pp.2012年2
月発行 第365
号 地すべり地形分布図 第50
集「名寄」16
葉(5万分の1).2012
年3
月発行予定 第366
号 浅間山高峰火山観測井コア試料の岩相と層序 30pp.2012年2
月発行 第296
号 日向灘の地震を想定した地震動予測地図作成手法の検討(CD-ROM
).2006
年3
月発行第
297
号 地すべり地形分布図第30
集「徳島・剣山」23
葉(5
万分の1
).2006
年9
月発行 第298
号 神奈川県西部山北南高感度地震観測井の掘削および坑内検層32pp
.2006
年10
月発行 第299
号 地すべり地形分布図第31
集「高知・窪川」17
葉(5
万分の1
).2007
年3
月発行 第300
号 強震ネットワーク 強震データVol. 21
(平成18
年No. 1
)(CD-ROM
).2007
年3
月発行 第301
号 強震ネットワーク 強震データVol. 22
(平成18
年No. 2
)(CD-ROM
).2007
年3
月発行 第302
号 長岡における積雪観測資料(30)
(2005. 11
~2006. 3
)37pp
.2007
年3
月発行第
303
号2003
年十勝沖地震の観測記録を用いた強震動予測手法の検証(CD-ROM
版).2007
年3
月発行 第304
号 アジア・太平洋国際地震・火山観測網構築計画に関する事前調査96pp
.2007
年3
月発行 第305
号 新庄における気象と降積雪の観測(2005/06
年冬期) 45pp
.2007
年3
月発行第
306
号 地震荷重を受ける減肉配管の破壊過程解明に関する研究報告書78pp
.2007
年3
月発行第
307
号 根尾谷断層水鳥地区における深層ボーリング調査と地殻応力測定(付録CD-ROM
)33pp
.2007
年8
月発行 第308
号 地すべり地形分布図第32
集「松山・宇和島」26
葉(5
万分の1
).2007
年9
月発行第
309
号 地すべり地形分布図第33
集「大分」18
葉(5
万分の1
).2007
年11
月発行第
310
号Geological and Logging Data of the NIED wells, Japan -Active fault, Seismogenic zone, Hingeline
-29pp
.2008
年3
月発行第
311
号 新庄における気象と降積雪の観測(2006/07
年冬期)
35pp
.2007
年11
月発行 第312
号 地すべり地形分布図第34
集「延岡・宮崎」19
葉(5
万分の1
).2008
年3
月発行第
313
号 微動探査観測ツールの開発その1
-常時微動解析ツール-(付録CD-ROM
)133pp
.2008
年3
月発行 第314
号 距離減衰式による地震動予測ツールの開発(付録CD-ROM
)66pp
.2008
年3
月発行第
315
号 地すべり地形分布図第35
集「八代」18
葉(5
万分の1
).2008
年3
月発行 第316
号 地すべり地形分布図第36
集「熊本」15
葉(5
万分の1
).2008
年3
月発行第
317
号2004
年新潟県中越地震による斜面変動分布図(付録CD-ROM
)37pp
.2008
年3
月発行 第318
号 強震ネットワーク 強震データVol. 23
(平成19
年No. 1
)(CD-ROM
版).2008
年3
月発行 第319
号 強震ネットワーク 強震データVol. 24
(平成19
年No. 2
)(CD-ROM
版).2008
年3
月発行第
320
号 平成17
年度大都市大震災軽減化特別プロジェクトⅡ木造建物実験-
震動台活用による構造物の耐震性向上研究-
(付録
CD-ROM
)152pp
.2008
年3
月発行第
321
号 平成17
年度大都市大震災軽減化特別プロジェクト実大6
層RC
建物実験報告書(付録CD-ROM
)46pp
.2008
年3
月発行第
322
号 地すべり地形分布図第37
集「福岡・中津」24
葉(5
万分の1
).2008
年8
月発行 第323
号 地すべり地形分布図第38
集「長崎・唐津」29
葉(5
万分の1
).2008
年9
月発行 第324
号 地すべり地形分布図第39
集「鹿児島」24
葉(5
万分の1
).2008
年11
月発行 第325
号 地すべり地形分布図第40
集「一関・石巻」19
葉(5
万分の1
).2009
年2
月発行 第326
号 新庄における気象と降積雪の観測(2007/08
年冬期)
33pp
.2008
年12
月発行 第327
号 防災科学技術研究所45
年のあゆみ(付録DVD
)224pp
.2009
年3
月発行 第328
号 地すべり地形分布図第41
集「盛岡」18
葉(5
万分の1
).2009
年3
月発行 第329
号 地すべり地形分布図第42
集「野辺地・八戸」24
葉(5
万分の1
).2009
年3
月発行 第330
号 地域リスクとローカルガバナンスに関する調査報告53pp
.2009
年3
月発行第
331
号E-Defense
を用いた実大RC
橋脚(C1-1
橋脚)震動破壊実験研究報告書-1970
年代に建設された基部曲げ破壊タ イプのRC
橋脚震動台実験-
(付録DVD
)107pp
.2009
年1
月発行第
332
号 強震ネットワーク 強震データVol. 25
(平成20
年No. 1
)(CD-ROM
版).2009
年3
月発行 第333
号 強震ネットワーク 強震データVol. 26
(平成20
年No. 2
)(CD-ROM
版).2009
年3
月発行第
334
号 平成17
年度大都市大震災軽減化特別プロジェクトⅡ地盤基礎実験-
震動台活用による構造物の耐震性向上研究-
(付録
CD-ROM
)62pp
.2009
年10
月発行第
335
号 地すべり地形分布図第43
集「函館」14
葉(5
万分の1
).2009
年12
月発行 第336
号 全国地震動予測地図作成手法の検討(7分冊+CD-ROM
版).2009
年11
月発行第
337
号 強震動評価のための全国深部地盤構造モデル作成手法の検討(付録DVD
).2009
年12
月発行 第338
号 地すべり地形分布図第44
集「室蘭・久遠」21
葉(5
万分の1
).2010
年3
月発行第
339
号 地すべり地形分布図第45
集「岩内」14
葉(5
万分の1
).2010
年3
月発行 第340
号 新庄における気象と降積雪の観測(2008/09
年冬期) 33pp
.2010
年3
月発行© National Research Institute for Earth Science and Disaster Prevention 2012
防災科学技術研究所研究資料 第367
号 編 集 委 員 会平成
24
年 3月29
日 発行※防災科学技術研究所の刊行物については,ホームページ(http://dil.bosai.go.jp/publication/index.html)をご覧下さい.
編集兼 独 立 行 政 法 人
発行者 防 災 科 学 技 術 研 究 所
〒305-0006
茨 城 県 つ く ば 市 天 王 台
3
-1
電話 (029)863-7635http://www.bosai.go.jp/
印刷所 朝 日 印 刷 株 式 会 社 茨 城 県 つ く ば 市 東
2-11-15
(委員長) 納口恭明
(委 員)
實渕哲也
鈴木真一本吉弘岐
田原健一関口宏二
(事務局)
吉田則夫
根岸弘明鈴木比奈子
(編集・校正) 樋山信子
Geological and Logging Data of the NIED Hydraulic Fracturing Boreholes in the Kanto-Tokai Region, Japan
Kentaro OMURA
*, Tatsuo MATSUDA
**, and Ryuji IKEDA
****
Earthquake and Volcano Research Unit, Monitoring and Forecast Research Department,
National Research Institute for Earth Science and Disaster Prevention, Japan
**
Real-time Earthquake Information Consortium, Japan
***
Hokkaido University
Abstract
National Research Institute for Earth Science and Disaster Prevention (NIED) drilled deep boreholes in Kanto-Tokai region, Japan for hydraulic fracturing experiments and geohydrological observations. In the boreholes, cuttings and spot cores were recovered, and geological columns were constructed. In addition, downhole loggings were conducted to investigate physical properties of geological formations around the boreholes. In this note, the geologic columns and geophysical logging data of 11 boreholes have been compiled into figures. Their depths are from 201.0 to 903.5 m. The geophysical logging items are spontaneous potential, resistivity, sonic velocity, bulk density, porosity, total gamma ray, caliper and temperature. These data are illustrated with the geologic columns on a scale of 1/2,900. We hope that these data contribute to the analysis of the ground and rock mass structures in those regions.
Key words: Borehole, Geophysical logging, Geologic column, Kanto-Tokai region, Hydraulic fracturing
1. Introduction
In a past few decades, more than ten deep boreholes were drilled in Kanto-Tokai region, Japan by National Research Institute for Earth Science and Disaster Prevention (NIED) for in-situ crustal stress measurements by hydraulic fracturing method and installations of instruments for geohydrological observation (Ikeda and Tsukahara, 1987a; Ikeda and Tsukahara, 1987b; Ikeda and Tsukahara, 1990; Tsukahara and Ikeda, 1987). In the boreholes, cuttings and spot cores were recovered and downhole loggings were performed. The collected samples and logging data directly provide fundamental information on the geological, physical structure in the crust.
In this note, we have compiled the geological and physical data into a figure for each borehole. In the figure, the geologic column and physical logging data are drawn up in order.
NIED has already published such compiled data as NIED Technical Notes (Suzuki et al., 1981; Suzuki and Omura,
1999; Matsuda et al., 2008). Present data are expected to contribute to research on the precise structures and properties of ground and rock mass, and its applications to disaster mitigation.
2. Locations of the boreholes
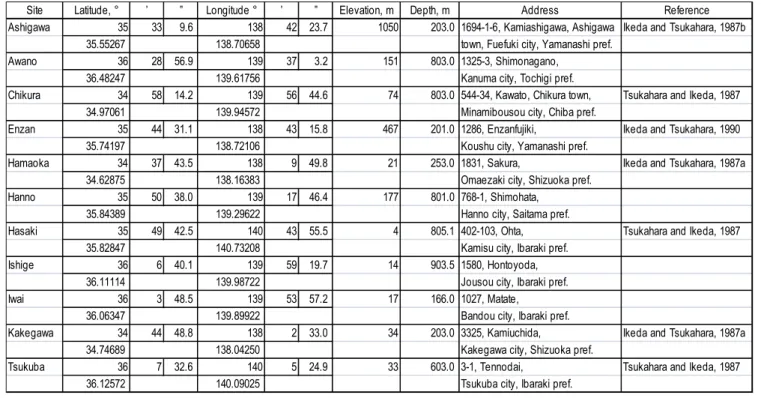
Fig.1 shows the locations of drilling sites in the study area. Table 1 shows the latitude, longitude (International Terrestrial Reference Frame), the elevation and the depth of each borehole. Figs.2-13 show the locations of boreholes plotted on topographic maps published by the Geographical Survey Institute of Japan.
3. Geophysical logging items and methods 3.1 List of the geophysical logging items
Table 2 lists the geophysical logging items measured in the
boreholes.
3.2 Methods employed in measuring the geophysical logging items (SPWLA, 1984; Chapellier, 1992;
Hearst, 2000)
Table 2 lists the geophysical logging items measured in the boreholes.
3.2.1 Spontaneous potential log: SP (spontaneous potential, mV)
An SP log measures the difference in electrical potential between an electrode moving along the borehole and a reference electrode fixed at the surface. SP arises mainly from electrochemical effects when fluids of contrasting salinities are encountered, such as drilling mud and water within the rock around the borehole through which the log is passing.
An SP log is useful in examining the distribution of porous and permeable/impermeable zones in the drilled rock.
3.2.2 Electrical log: SN (short normal, ohm-m); LN (long normal, ohm-m); Micro1 (micro log 1 inch, ohm-m); Micro2 (micro log 2 inch, ohm-m)
An electrical log measures the resistivity of the rocks around the borehole. Various types of tools can be used, each with different configurations of electrodes. For a normal log, a current electrode and potential electrode are configured on the tool. Potential difference is measured between the potential electrode and a reference electrode at the surface while a constant current passes between the current electrode and the surface electrode. Because the electrodes on the surface are situated in an ‘infinite’ space, the measured potential difference depends on the characteristics of the rock around the current and potential electrodes on the tool.
The distances between the two electrodes are 25 cm (short normal) or 100 cm (long normal).
For a micro log, the resistivity is measured by a simple array of three button electrodes at 1-inch spacings on a pad pressed against the borehole wall. The current electrode occupies the lowermost position. The potential of the uppermost electrode with respect to a remote reference electrode yields 2-inch normal resistivity. At the same time, the potential difference between the upper two electrodes gives 1-inch lateral resistivity. The micro log consists of two resistivity curves that are expected to coincide with each other in the absence of mud cake on the borehole wall.
3.2.3 Sonic log: Vp (P wave velocity, km/sec); Vs (S wave velocity, km/sec)
A sonic log is an acoustic log that measures the interval transit time of compressive and shear waves in the rock around the borehole. There are one transmitter and two receivers on the tool. The tool measures directly the travel time from transmitter to receiver, comprising the travel time through mud located between the transmitter and the borehole wall, between the borehole wall and the receiver, and through the wall rock along the same distance as that between the transmitter and receiver. The difference between the two
travel times represents the travel time through the wall rock along the fixed distance between the two receivers, generally a distance of 1 foot. The difference in travel time represents the interval transit time, which is converted to the acoustic velocity of the rock around the borehole.
3.2.4 Formation density log (sometimes called a gamma- gamma log): Density (density, g/cm
3)
A formation density log measures the intensity of backscattered gamma rays from the rock around the borehole using a detector mounted in the tool and shielded from a gamma ray source (e.g.,
137Cs). The intensity of backscattered gamma rays depends on the electron density, which is closely related to the bulk density of the rock around the borehole.
The intensity of the backscattered gamma rays is converted to rock density using a calibration curve.
3.2.5 Neutron (Porosity) log: Porosity (porosity, %) A neutron log counts the neutrons emitted from a neutron source installed within the tool and scattered by the rock around the borehole. Fast neutrons continuously emitted from the source (a radioisotope of Am. Be) are slowed by collisions with atomic nuclei within the rock around the borehole, thereby becoming low-energy thermal neutrons that are captured by the neutron detector. Because collisions with hydrogen atoms, which have similar masses to the neutrons, are by far the most effective in terms of slowing the neutrons, the number of neutrons recorded by the detector is inversely proportional to the concentration of hydrogen in the rock around the borehole. In water-saturated rock, the hydrogen content is equivalent to the pore water content, i.e., porosity.
The porosity is derived from the number of detected neutrons via an empirically determined relationship.
3.2.6 Gamma-ray log: Gamma Ray (gamma- ray, API) A gamma-ray log counts all of the gamma rays, without energy discrimination, radiated from natural radioactive isotopes in the rock around the borehole, being mainly uranium (
238U), thorium (
232Th), and potassium (
40K). The API (American Petroleum Institute) unit for radioactivity is employed, based on an artificial radioactive concrete block housed in the API calibration facility at the University of Houston, Texas, USA.
3.2.7 Caliper log: Caliper-X (caliper x-axis, mm);
Caliper-Y (caliper y-axis, mm)
A caliper log measures the borehole diameter. The tool has one or more arms that are extended mechanically and placed in contact with the borehole wall. The degree of extension of the arm(s) is converted to the length from the center of the tool to the borehole wall.
3.2.8 Temperature log: Temperature (temperature, degree C)
A temperature log measures temperature within the borehole
using a thermistor sensor installed within the tool such that fluid
passes over the sensor as the tool travels down the borehole.
4. Geologic columns and geophysical logs of the boreholes Geophysical logs for the boreholes are shown in Figs.13-23 alongside geologic columns. Logs were compiled for various rock types. Broadly speaking, we found correlations among electrical, sonic, density, and neutron logs, while gamma-ray logs discriminate different rock types. These findings suggest that the logging data presented in this note will contribute to studies of crustal structure and petrophysics.
Acknowledgments
We thank all people concerned with downhole measure- ments for present data.
References
1) Chapellier, D. (1992): Well logging in hydrogeology, 175 pp., A.A. Balkema Pub., Brookfield.
2) Hearst, J. R., Nelson, P. H., and Paillett, F. L. (2000):
Well logging for physical properties, second ed., 483 pp, John Wiley & Sons Ltd., West Sussex.
3) Ikeda, R. and Tsukahara, H. (1987a): Crustal stress measurement and pore water pressure observation in Omaezaki peninsula, Shizuoka Prefecture. Geophysical Bulletin of Hokkaido University, Sapporo, Japan, No.49, 269-279. (in Japanese with English abstract)
4) Ikeda, R. and Tsukahara, H. (1987b): Hydraulic fracturing stress measurements at Ashigawa-mura and Tsuru city in Yamanashi prefecture -The vertical state of stress and the regional stress field-. Zishin 2, 40-4, 519-531. (in Japanese with English abstract)
5) Ikeda, R. and Tsukahara, H. (1990): Hydrofracturing Crustal Stress Measurements in Granitic Rocks, in
Proceedings of the 8th Japan Symposium on Rock Mechanics, 309-314, Japanese Committee for Rock Mechanics, Tokyo. (in Japanese with English abstract) 6) Matsuda, T., Omura, K., and Ikeda, R. (2008): Geological
and logging data of the NIED boreholes, Japan -Active fault, seismogenic zone, hingeline-. In Technical Note of the National Research Institute for Earth Science and Disaster Prevention, No.310, 29 pp., National Research Institute for Earth Science and Disaster Prevention.
7) SPWLA (1984): Glossary of terms & expressions used in well logging, second ed., 116 pp., Society of Professional Well Log Analysts, Houston.
8) Suzuki, H., Ikeda, R., Mikoshiba, T., Kinoshita, S., Sato, H., and Takahashi, H. (1981): Deep well logs in the Kanto-Tokai area. in Technical Note of the National Research Institute for Earth Science and Disaster Prevention, No.65, 162pp., National Research Institute for Earth Science and Disaster Prevention. (in Japanese with English abstract)
9) Suzuki, H. and Omura, K. (1999): Geological and logging data of the deep observation wells in the Kanto region, Japan. in Technical Note of the National Research Institute for Earth Science and Disaster Prevention, No.191, 80pp., National Research Institute for Earth Science and Disaster Prevention. (in Japanese with English abstract)
10) Tsukahara, H. and Ikeda, R. (1987): Hydraulic fracturing stress measurements and in-situ stress field in the Kanto - Tokai area, Japan. Tectonophysics, 135-4, 329-345.
(Accepted : February, 2012)
Fig. 1 Locations of the drilling sites.
Table 1 Location data of the boreholes (International Terrestrial Reference Frame).
138°E 141°E
37°N
34°N 50km
0
Drilling Sites 1 Ashigawa 2 Awano 3 Chikura 4 Enzan 5 Hamaoka 6 Hanno 7 Hasaki 8 Ishige 9 Iwai 10 Kakegawa 11 Tsukuba
Tokyo
Site Latitude, ° ’ ” Longitude ° ’ ” Elevation, m Depth, m Address Reference
Ashigawa 35 33 9.6 138 42 23.7 1050 203.0 1694-1-6, Kamiashigawa, Ashigawa Ikeda and Tsukahara, 1987b
.f e r p i h s a n a m a Y , yt ic i k uf e u F , n w ot 8
5 6 0 7 .8 3 1 7
6 2 5 5 .5 3
Awano 36 28 56.9 139 37 3.2 151 803.0 1325-3, Shimonagano,
.f e r p i gi h c o T , yt ic a m u n a K 6
5 7 1 6 .9 3 1 7
4 2 8 4 .6 3
Chikura 34 58 14.2 139 56 44.6 74 803.0 544-34, Kawato, Chikura town, Tsukahara and Ikeda, 1987
.f e r p a bi h C , yt ic u o s u o bi m a ni M 2
7 5 4 9 .9 3 1 1
6 0 7 9 .4 3
Enzan 35 44 31.1 138 43 15.8 467 201.0 1286, Enzanfujiki, Ikeda and Tsukahara, 1990
.f e r p i h s a n a m a Y , yt ic u h s u o K 6
0 1 2 7 .8 3 1 7
9 1 4 7 .5 3
Hamaoka 34 37 43.5 138 9 49.8 21 253.0 1831, Sakura, Ikeda and Tsukahara, 1987a
.f e r p a k o u zi h S , yt ic i k a z e a m O 3
8 3 6 1 .8 3 1 5
7 8 2 6 .4 3
Hanno 35 50 38.0 139 17 46.4 177 801.0 768-1, Shimohata,
.f e r p a m at ia S , yt ic o n n a H 2
2 6 9 2 .9 3 1 9
8 3 4 8 .5 3
Hasaki 35 49 42.5 140 43 55.5 4 805.1 402-103, Ohta, Tsukahara and Ikeda, 1987
.f e r p i k a r a bI , yt ic u si m a K 8
0 2 3 7 .0 4 1 7
4 8 2 8 .5 3
Ishige 36 6 40.1 139 59 19.7 14 903.5 1580, Hontoyoda,
.f e r p i k a r a bI , yt ic u o s u o J 2
2 7 8 9 .9 3 1 4
1 1 1 1 .6 3
Iwai 36 3 48.5 139 53 57.2 17 166.0 1027, Matate,
.f e r p i k a r a bI , yt ic u o d n a B 2
2 9 9 8 .9 3 1 7
4 3 6 0 .6 3
Kakegawa 34 44 48.8 138 2 33.0 34 203.0 3325, Kamiuchida, Ikeda and Tsukahara, 1987a
.f e r p a k o u zi h S , yt ic a w a g e k a K 0
5 2 4 0 .8 3 1 9
8 6 4 7 .4 3
Tsukuba 36 7 32.6 140 5 24.9 33 603.0 3-1, Tennodai, Tsukahara and Ikeda, 1987
.f e r p i k a r a bI , yt ic a b u k u s T 5
2 0 9 0 .0 4 1 2
7 5 2 1 .6 3
Table 2 List of the geophysical logging items in the boreholes.
Fig. 2 Location of the Ashigawa borehole on a topographic map published by the Geographical Survey Institute of Japan (http://portal.cyberjapan.jp/denshi/index3.html).
Fig. 3 Location of the Awano borehole on a topographic map published by the Geographical Survey Institute of Japan (http://portal.cyberjapan.jp/denshi/index3.html).
Fig. 4 Location of the Chikura borehole on a topographic map published by the Geographical Survey Institute of Japan (http://portal.cyberjapan.jp/denshi/index3.html).
Fig. 5 Location of the Enzan borehole on a topographic map published by the Geographical Survey Institute of Japan (http://portal.cyberjapan.jp/denshi/index3.html).
Site SP(mV) SN(ohm-m) LN(ohm-m) MIC-1(ohm-m) MIC-2(ohm-m) Vp(km/sec) Vs(km/sec) Density(g/cm3) Porosity(%) GR(API) CAL-X(mm) CAL-Y(mm) Temp(C)
Ashigawa ۵ ۵ ۵ ۵ ۵ ۵
Awano ۵ ۵ ۵ ۵ ۵ ۵ ۵ ۵
Chikura ۵ ۵ ۵ ۵ ۵ ۵
Enzan ۵ ۵ ۵ ۵ ۵ ۵ ۵ ۵ ۵ ۵ ۵
Hamaoka ۵ ۵ ۵ ۵ ۵ ۵
Hanno ۵ ۵ ۵ ۵ ۵ ۵ ۵ ۵
Hasaki ۵ ۵ ۵
Ishige ۵ ۵ ۵ ۵ ۵ ۵
Iwai ۵ ۵
Kakegawa ۵ ۵ ۵ ۵ ۵ ۵
Tsukuba ۵ ۵ ۵ ۵
Fig. 6 Location of the Hamaoka borehole on a topographic map published by the Geographical Survey Institute of Japan (http://portal.cyberjapan.jp/denshi/index3.html).
Fig. 8 Location of the Hasaki borehole on a topographic map published by the Geographical Survey Institute of Japan (http://portal.cyberjapan.jp/denshi/index3.html).
Fig. 10 Location of the Iwai borehole on a topographic map published by the Geographical Survey Institute of Japan (http://portal.cyberjapan.jp/denshi/index3.html).
Fig. 7 Location of the Hanno borehole on a topographic map published by the Geographical Survey Institute of Japan (http://portal.cyberjapan.jp/denshi/index3.html).
Fig. 9 Location of the Ishige borehole on a topographic map published by the Geographical Survey Institute of Japan (http://portal.cyberjapan.jp/denshi/index3.html).
Fig. 11 Location of the Kakegawa borehole on a topographic
map published by the Geographical Survey Institute of
Japan (http://portal.cyberjapan.jp/denshi/index3.html).
Fig. 12 Location of the Tsukuba borehole on a topographic map
published by the Geographical Survey Institute of Japan
(http://portal.cyberjapan.jp/denshi/index3.html).
防災科学技術研究所による関東・東海地域における水圧破砕井の孔井検層データ
小村健太朗*・松田達生**・池田隆司***
* 独立行政法人 防災科学技術研究所 観測・予測研究領域 地震・火山防災研究ユニット
** 特定非営利活動法人リアルタイム地震情報利用協議会(元防災科学技術研究所特別技術員)
*** 北海道大学大学院 理学研究院
要 旨
独立行政法人防災科学技術研究所は関東・東海地域において水圧破砕実験のための深層掘削を実施してきた.孔 井からはカッティングスとスポットコアが回収され,地質柱状図が作成されるとともに,孔内検層が実施され,岩 盤の物理特性が調べられた.本資料では,深度201.0 mから903.5 mにわたる11か所の孔井の地質柱状図と物理検 層データを,各孔井ごとに2,900分の1のスケールの図面にとりまとめた.物理検層項目は自然電位,比抵抗,弾 性波速度,密度,間隙率,全ガンマ線,孔径,温度である.これらのデータは,当該地域の地盤から岩盤にいたる 構造の解析に貢献することが期待される.
キーワード:孔井,物理検層,地質柱状図,関東・東海地域,水圧破砕
SP, mV 04 00 SN, ohm-m 11 0000 LN, ohm-m 11 0000 Micro1, ohm-m 11 0000 Micro2, ohm-m 11 0000
V p, km/se c 17 Vs, km/se c 17
Densit y, g/cm3 13 Porosit y, % 06 0 G ammaRa y, API 01 00 0 Cali per-X, mm -400 40 0 Cali per-Y, mm 40 0- 40 0 Te m perature, C 0 100
Lithology sand and gravel basalt porphyrite
Fi g. 1 3 Geologic column and geop hysical logging charts of the Ashigawa borehole.
De pth
1m:2900mSP, mV 04 00 SN, ohm-m 11 0000 LN, ohm-m 11 0000 Micro1, ohm-m 11 0000 Micro2, ohm-m 11 0000
V p, km/se c 17 Vs, km/se c 17
Densit y, g/cm3 13 Porosit y, % 06 0 G ammaRa y, API 01 00 0 Cali per-X, mm -40 04 00 Cali per-Y, mm 40 0- 40 0 Te m perature, C 0 100
Lithology
0. 0 20.0 40.0 60.0 80.0 100.0 120.0 140.0 160.0 180.0 200.0 220.0 240.0 260.0 280.0 300.0 320.0 340.0 360.0 380.0 400.0 420.0 440.0 460.0 480.0 500.0 520.0 540.0 560.0 580.0 600.0 620.0 640.0 660.0 680.0 700.0 720.0 740.0 760.0 780.0 800.0
sand and gravel sandstone and slate
Fi g. 1 4 Geologic column and geop hysical logging charts of the Awano borehole.
SP, mV 04 00 SN, ohm-m 11 0000 LN, ohm-m 11 0000 Micro1, ohm-m 11 0000 Micro2, ohm-m 11 0000
Vp , km/se c 17 Vs, km/se c 17
Densit y, g/cm3 13 Porosit y, % 06 0 G ammaRa y, API 01 00 0 Cali per-X, mm -40 04 00 Cali per-Y, mm 40 0- 40 0
Te m perature, C 0 100
Lithologysandston e
and mudstone
Fi g. 1 5 Geologic column and geop hysical logging charts of the Chikur a borehole.
De pth
1m:2900mSP, mV 04 00 SN, ohm-m 11 0000 LN, ohm-m 11 0000 Micro1, ohm-m 11 0000 Micro2, ohm-m 11 0000
V p, km/se c 17 Vs, km/se c 17
Densit y, g/cm3 13 Porosit y, % 06 0 G ammaRa y, API 01 00 0 Cali per-X, mm -40 04 00 Cali per-Y, mm 40 0- 40 0 Te m perature, C 0 100
Lithology
0. 0 20.0 40.0 60.0 80.0 100.0 120.0 140.0 160.0 180.0 200.0
sand and gravel granodio- rite
Fi g. 1 6 Geologic column and geop hysical logging charts of the Enzan borehole.
SP, mV 04 00 SN, ohm- m 11 0000 LN, ohm- m 11 0000 Micro1, ohm- m 11 0000 Micro2, ohm- m 11 0000
V p, km/se c 17 Vs, km/se c 17
Densit y, g/cm3 13 Porosit y, % 06 0 G ammaRa y, API 01 00 0 Cal ip er-X, mm -400 40 0 Cal ip er-Y, mm 40 0- 40 0 Te m perature, C 0 100
Lithology sand mudstone
Fi g. 1 7 Geologic column and geop hysical logging charts of the Hamao ka borehole.
Depth 1m:2900m
SP, mV 04 00 SN, ohm-m 11 0000 LN, ohm-m 11 0000 Micro1, ohm-m 11 0000 Micro2, ohm-m 11 0000
V p, km/se c 17 Vs, km/se c 17
Densit y, g/cm3 13 Porosit y, % 06 0 G ammaRa y, API 01 00 0 Cali per-X, mm -400 40 0 Cali per-Y, mm 40 0- 40 0 Te m perature, C 0 100
Lithology
0. 0 20.0 40.0 60.0 80.0 100.0 120.0 140.0 160.0 180.0 200.0 220.0 240.0 260.0 280.0 300.0 320.0 340.0 360.0 380.0 400.0 420.0 440.0 460.0 480.0 500.0 520.0 540.0 560.0 580.0 600.0 620.0 640.0 660.0 680.0 700.0 720.0 740.0 760.0 780.0 800.0
sandstone and shale
Fi g. 1 8 Geologic column and geop hysical logging charts of the Hanno borehole.
SP, mV 04 00 SN, ohm-m 11 0000 LN, ohm-m 11 0000 Micro1, ohm-m 11 0000 Micro2, ohm-m 11 0000
V p, km/se c 17 Vs, km/se c 17
Densit y, g/cm3 13 Porosit y, % 06 0 G ammaRa y, API 01 00 0 Cali per-X, mm -400 40 0 Cali per-Y, mm 40 0- 40 0 Te m perature, C 0 100
Lithology sand and
gravel (Shimousa group) sandstone and mudstone (Kazusa group) sandstone and mudstone (Miura group)
Fi g. 1 9 Geologic column and geop hysical logging charts of the Hasaki borehole.
De pth
1m:2900mSP, mV 04 00 SN, ohm- m 11 0000 LN, ohm- m 11 0000 Micro1, ohm- m 11 0000 Micro2, ohm- m 11 0000
V p, km/se c 17 Vs, km/se c 17
Densit y, g/cm3 13 Porosit y, % 06 0 G ammaRa y, API 01 00 0 Cal ip er-X, mm -400 40 0 Cal ip er-Y, mm 40 0- 40 0 Te m perature, C 0 100
Lithoogy
0. 0 20.0 40.0 60.0 80.0 100. 0 120. 0 140. 0 160. 0 180. 0 200. 0 220. 0 240. 0 260. 0 280. 0 300. 0 320. 0 340. 0 360. 0 380. 0 400. 0 420. 0 440. 0 460. 0 480. 0 500. 0 520. 0 540. 0 560. 0 580. 0 600. 0 620. 0 640. 0 660. 0 680. 0 700. 0 720. 0 740. 0 760. 0 780. 0 800. 0 820. 0 840. 0 860. 0 880. 0 900. 0
sandstone granite
Fi g. 2 0 Geologic column and geop hysical logging charts of the Ishige borehole.
SP, mV 04 00 SN, ohm-m 11 0000 LN, ohm-m 11 0000 Micro1, ohm-m 11 0000 Micro2, ohm-m 11 0000
V p, km/se c 17 Vs, km/se c 17
Densit y, g/cm3 13 Porosit y, % 06 0 G ammaRa y, API 01 00 0 Cali per-X, mm -400 40 0 Cali per-Y, mm 40 0- 40 0 Te m perature, C 0 100
Lithology sandstone and mudstonesilt
Fi g. 2 1 Geologic column and geop hysical logging charts of the Iwai bo rehole.
De pth
1m:2900mSP, mV 04 00 SN, ohm-m 11 0000 LN, ohm-m 11 0000 Micro1, ohm-m 11 0000 Micro2, ohm-m 11 0000
V p, km/se c 17 Vs, km/se c 17
Densit y, g/cm3 13 Porosit y, % 06 0 G ammaRa y, API 01 00 0 Cali per-X, mm -40 04 00 Cali per-Y, mm 40 0- 40 0 Te m perature, C 0 100
Lithology
0. 0 20.0 40.0 60.0 80.0 100.0 120.0 140.0 160.0 180.0 200.0
sand mudstone
Fi g. 2 2 Geologic column and geop hysical logging charts of the Kakeg awa borehole.
SP, mV 04 00 SN, ohm-m 11 0000 LN, ohm-m 11 0000 Micro1, ohm-m 11 0000 Micro2, ohm-m 11 0000
V p, km/se c 17 Vs, km/se c 17
Densit y, g/cm3 13 Porosit y, % 06 0 G ammaRa y, API 01 00 0 Cali per-X, mm -40 04 00 Cali per-Y, mm 40 0- 40 0 Te m perature, C 0 100
Lithology sand sandstone and mudstone granite diabase