DISCUSSION PAPER No.178
研究プロジェクトの中止・継続がイノベーションの 成果に及ぼす影響とその決定要因:
全国イノベーション調査による定量分析
Determinants of Staged Project Management and Success in Innovation:
An Empirical Analysis Based on the Japanese National Innovation Survey
2020 年 2 月
文部科学省 科学技術・学術政策研究所 第 1 研究グループ
羽田 尚子 池田 雄哉
本 DISCUSSION PAPER は、所内での討論に用いるとともに、関係の方々からの御意見を頂く ことを目的に作成したものである。
また、本 DISCUSSION PAPER の内容は、執筆者の見解に基づいてまとめられたものであり、
必ずしも機関の公式の見解を示すものではないことに留意されたい。
The DISCUSSION PAPER series is published for discussion within the National Institute of Science and Technology Policy (NISTEP) as well as receiving comments from the community.
It should be noticed that the opinions in this DISCUSSION PAPER are the sole responsibility of the author(s) and do not necessarily reflect the official views of NISTEP.
【執筆者】
羽田 尚子 中央大学商学部 教授
文部科学省科学技術・学術政策研究所 客員研究官 池田 雄哉 文部科学省科学技術・学術政策研究所 研究員
【Authors】
HANEDA Shoko Professor, Faculty of Commerce, Chuo University
Affiliated Fellow, National Institute of Science and Technology Policy (NISTEP), MEXT
IKEDA Yuya Research Fellow, National Institute of Science and Technology Policy (NISTEP), MEXT
本報告書の引用を行う際には、以下を参考に出典を明記願います。
Please specify reference as the following example when citing this paper.
羽田尚子・池田雄哉 (2020) 「研究プロジェクトの中止・継続がイノベーションの成果に及ぼす影響 とその決定要因:全国イノベーション調査による定量分析」,NISTEP DISCUSSION PAPER, No.178,文部科学省科学技術・学術政策研究所.
DOI: https://doi.org/10.15108/dp178
HANEDA Shoko and IKEDA Yuya (2020) “Determinants of Staged Project Management and Success in Innovation: An Empirical Analysis Based on the Japanese National Innovation Survey,”
NISTEP DISCUSSION PAPER, No.178, National Institute of Science and Technology Policy, Tokyo.
DOI: https://doi.org/10.15108/dp178
研究プロジェクトの中止・継続がイノベーションの成果に及ぼす影響とその決定要因:
全国イノベーション調査による定量分析
文部科学省 科学技術・学術政策研究所 第1研究グループ 要旨
本実証研究では,イノベーション・プロジェクトの段階的なマネジメント方法(ステージ型管理法)
が及ぼす影響を検証している。ステージ型管理法は,製品開発プロセスの各段階においてプロジ ェクトが中止される脅威を伴う方法であり,本研究では第4回全国イノベーション調査(J-NIS 2015) から作成したデータセットを用いて,ステージ型管理法を採用した企業(プロジェクトを中止又は継 続した企業)を識別している。また,本研究ではJ-NIS 2015と会計・信用情報を接合して,イノベー ション・プロセスにおけるステージ型管理法の採用に係る決定要因とその効果について検証してい る。
本研究の結果は,より広範の異なる相手先との協力を実行した又は負債比率が低い研究開発 集約型の企業ほど,製品開発プロセスにおいてステージ型管理法を採用しやすいことを明らかに している。本研究において,イノベーション実現は革新的なプロダクト(又はプロセス)を生み出す 企業の性向や革新的なプロダクトの売上率により測定している。ステージ型管理法を採用している 企業と採用していない企業を比較したところ,ステージ型管理法がイノベーション実現率やイノベ ーションの新規性に寄与していることが分かった。
Determinants of staged project management and success in innovation:
An Empirical analysis based on the Japanese National Innovation Survey
First Theory-Oriented Research Group, National Institute of Science and Technology Policy (NISTEP), MEXT
ABSTRACT
This empirical study examines the impact of a staged approach to management of innovation projects. This approach incorporates the threat of termination at each stage of the product development process. Under these conditions, the present study identifies firms that have abandoned and/or still have ongoing projects by using a unique firm-level dataset constructed from the Japanese National Innovation Survey 2015 (J-NIS 2015). Combining J- NIS with a firm-level accounting and credit information dataset, the study explores the determinants and the effects of staging of innovation processes. The study results show that R&D-intensive firms with a broad collaboration and a lower debt ratio are more likely to adopt a staged approach in the product development process. Success in innovation is measured by the propensity of a firm to realise innovative products (or processes) and the ratio of innovative product sales to the total sales. Additionally, the study compared firms that did not implement staging of projects to those that employed staged project management and found that staging significantly improved innovation performance and increased the degree of radicalness.
本稿は,独立行政法人経済産業研究所と科学技術・学術政策研究所で実施された研究 について,経済産業研究所が公表した研究成果
(RIETI Discussion Paper Series, 19-E-094)
を科学技術・学術政策研究所において新たに編集したうえで報告書として取りまとめ
たものです。
概要
[空白のページ]
i 1.
導入
研究開発プロジェクトの工程管理では,新製品のアイデアから製品化に至るまでの工程ごとに中間 目標を設定・評価する方法がある。ある工程での成果が中間目標に達していれば,成果は次の工程 へ移行してプロジェクトは継続されるが,末達であればプロジェクトの中止が検討される。このようなプロ ジェクト管理法(以下,「ステージ型管理法」と呼ぶ)では,資金供給の停止等によりプロジェクトが中止 される脅威がある。中止の脅威が存在すると実現性の高い漸進的なプロジェクトばかりが選ばれ,画期 性のあるプロジェクトが遂行されなくなるという指摘がある
(Manso, 2011)。これに対して,ステージ型管 理法はリアル・オプションになっており,中止の脅威により技術的・商業的に実現性の高いプロジェクト が選別されるため,イノベーションに適しているという指摘もある(例えば,
Dahiya and Ray, 2012)。
2.
先行研究と仮説
Manso (2011)
は,製品開発がステージ型で進行する理論モデルに基づいて,イノベーションには試
行錯誤が必要不可欠なことから,開発初期段階の失敗については寛容に対応しつつ有効なフィード バックを与え,成果を長期的に評価するインセンティブ・スキームが有効であると主張している。製品開 発過程で生じるプロジェクト中止の脅威は,画期性あるプロジェクトを試みるインセンティブを減少させ るため,イノベーションを抑制することが理論分析により示されている。
一方,ベンチャー・キャピタル
(VC)によるエクイティ投資では,中止の脅威はイノベーションに適して いるという議論がある。
VCのエクイティ投資はいくつかの段階(ステージ) に分けて資金が提供されるこ とが多い。これは,中間的な成果をモニタリングしながら資金供給を継続するか又は中止するかを判断 することが,不確実性の大きなイノベーションに対処する上で有効と考えられているためである。ステー ジを経過するごとに,
VCは投資先企業の技術面・商業面での成功を学習していくので,イノベーショ ンを実現する可能性の高い企業が選別されることになる
(Dahiya and Ray, 2012)。
実際,ステージ型のプロジェクト管理は,国内外を問わず多くの企業の製品開発において採用され ている
(Schilling, 2013)。日本企業を対象とした西村
(2007)の調査によると,調査対象の
90%以上の研 究開発組織では,進捗状況をモニタリングしながらプロジェクトを進めており,同様の方法で資金も管 理している。また,ドイツ企業(約
1,800社)を対象とした
Andries and Hunermund (2014)の実証研究で は,ステージ型のプロジェクト管理法の実行とプロジェクトの中止又は継続には正で有意な関係が示さ れている。一方,ステージ型のプロジェクト管理は,漸進的なイノベーションには正で有意に作用する が,画期性のあるイノベーションに対しては効果をもたないことも明らかになっている。
以上の背景及び先行研究を基にして,本研究では以下の
3つの仮説を導出する。
H1:
ステージ型管理法を実施している企業は,より多くのイノベーション成果を獲得している。
H2:
ステージ型管理法を実施している企業は,新規性の高いイノベーションを実現しやすい。
H3:
ステージ型管理法を実施している企業は,漸進的なイノベーションを実現しやすい。
ii 3.
データとサンプル
本研究では,科学技術・学術政策研究所が実施した「第
4回全国イノベーション調査
(J-NIS 2015)」 の個票データと東京商工リサーチの企業情報・財務情報を使用している。全国イノベーション調査は,
イノベーションに関するデータを収集・分析するための国際標準『オスロ・マニュアル』に準拠して実施 されている。全国イノベーション調査では,プロダクト・イノベーションの新規性や売上率といったイノベ ーションの成果についても測定している(詳細は,科学技術・学術政策研究所
(2016)を参照)。本研究 における分析対象は,
2012年度から
2014年度までの
3年間にイノベーション活動を実行した
1,468社
(うち,
727社は製造業)である。
イノベーションの成果を代理する変数は,
3年間で市場新規プロダクト・イノベーションを実現した企 業を
1,それ以外を
0とする二値変数で定義する。これと同様に,市場新規プロダクト・イノベーションの 売上率も用いている。ステージ型管理法実施の有無を代理する変数は,
3年間で完了前に中止・中断 したイノベーション活動のある企業,又は
2014年度末においても継続中のイノベーション活動がある企 業を
1,それ以外を
0とする二値変数で定義する。
4.
分析方法
まず本研究では,どのような特性の企業がステージ型管理法を採用する傾向が高いかについてプ ロビット・モデルを用いて推定する。ステージ型管理法では,進捗状況を確認しながらプロジェクトの中 止又は継続を決めている。研究開発には不確実性があるので,組織の不確実性許容の程度が,プロ ジェクトの中止又は継続の判断に影響する。また,複数のプロジェクトを並行して行う企業の方がプロジ ェクトの選別をする誘因が大きく,中止又は継続の判断には組織内外(市場に関する知識など)の知 識が必要となる。このため,研究開発に対する組織の理解,プロジェクトの数,及び組織内外の知識活 用を代理する変数を用いて,ステージ型管理法の決定要因を検証する。
次に傾向スコア・マッチングを用いて処置群と対照群を選定し,ステージ型管理法の実施がイノベー ションの成果を高めているのかを検証する。具体的に,プロビット・モデルの推計から得られた傾向スコ アにより処置群と対照群をマッチングした後,イノベーションの成果に対する平均処置効果を求める。
5.
分析結果
ステージ型管理法の決定要因を推定した結果,研究開発集約度(売上高に対する研究開発支出 額の比率)が高い,負債比率(自己資本に対する負債の比率)が低い,又は多様な相手と協力してイノ ベーション活動を実行している企業ほど,ステージ型管理法を採用していることが分かった。
次に,ステージ型管理法の実施がイノベーションの成果に及ぼす効果を推定したところ,仮説
H1か
ら
H3までを支持する結果が得られた。つまり,ステージ型管理法を実施している企業(処置群)は,実
施していない企業(対照群)に比べて,プロダクト・イノベーション実現確率やプロダクト・イノベーション
売上率が高かった。プロダクト・イノベーションの新規性に着目しても,ステージ型管理法を実施してい
る企業の方が実施していない企業に比べて,市場新規プロダクト・イノベーション実現確率や市場新規
iii
プロダクト・イノベーション売上率が高かった。この結果は,ステージ型管理法を実施することで,より大 きなイノベーションの成果を獲得できることを示唆している。
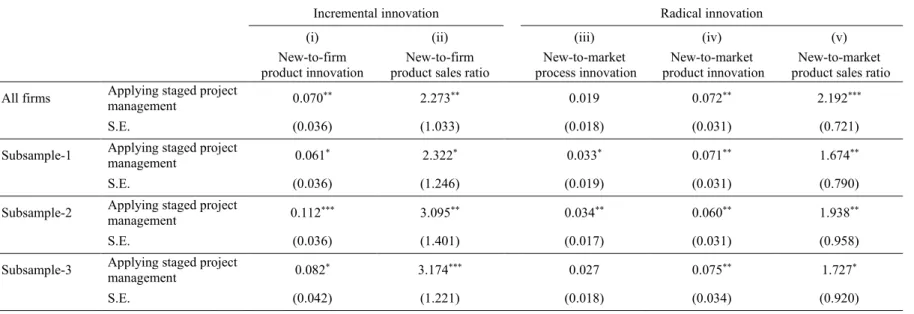
概要表
1.ステージ型管理法がイノベーションに及ぼす影響
市場新規プロダクト・イノベーション 非市場新規プロダクト・イノベーション
(企業にとってのみ新しいプロダクト・イノベーション)
実現有無 売上率 実現有無 売上率
処置群における
平均処置効果(ATT) 0.072** 2.192*** 0.070** 2.273***
註:**,***は,それぞれ5%水準,1%水準での統計的有意性を表している。
[空白のページ]
本文(英語)
[空白のページ]
1
Determinants of staged project management and success in innovation: An Empirical analysis based on the Japanese National
Innovation Survey
*Shoko Hanedaa and Yuya Ikedab Abstract
This empirical study examines the impact of a staged approach to management of innovation projects. This approach incorporates the threat of termination at each stage of the product development process. Under these conditions, the present study identifies firms that have abandoned and/or still have ongoing projects using a unique firm-level dataset constructed from the Japanese National Innovation Survey 2015 (J-NIS 2015). Combining J-NIS with a firm-level accounting and credit information dataset, the study explores the determinants and the effects of staging of innovation processes. The study results show that R&D-intensive firms with a broad collaboration and a lower debt ratio are more likely to adopt a staged approach in the product development process. Success in innovation is measured by the propensity of a firm to realise innovative products (or processes) and the ratio of innovative product sales to the total sales. Additionally, the study compared firms that did not implement staging of projects to those that employed staged project management and found that staging significantly improved innovation performance and increased the degree of radicalness.
JEL Classification Codes: D22, L10, L40, O31, O32
Keywords: staged project management, real option, Innovation Survey, Japan
*This study was conducted as part of the project “Study on growth of firms and innovation”
undertaken at the Research Institute of Economy, Trade and Industry (RIETI), and at the National Institute of Science and Technology Policy (NISTEP) in 2017–2019. This study uses the micro data that are based on the Basic Survey of Japanese Business Structure and Activities which is conducted by the Ministry of Economy, Trade and Industry (METI) and the TSR data, which are provided by RIETI. This study also uses the firm-level data from the fourth round of the Japanese National Innovation Survey (J-NIS 2015) which is conducted by NISTEP, the Ministry of Education, Culture, Sports, Science and Technology (MEXT). The authors thank Hiroyuki Odagiri, Arito Ono, Masatoshi Kato, Keiko Ito, Kenta Ikeuchi, Shinya Kinukawa, the members of the RIETI project, and participants of the 6th Asian SME Conference. Haneda gratefully acknowledges financial support through the JSPS Grant-in-Aid for Scientific Research (C) (No. 16K03661).
a Faculty of Commerce, Chuo University, 742-1 Higashinakano, Hachioji-shi, Tokyo 192-0393, Japan. Email: [email protected]
b First Theory-Oriented Research Group, National Institute of Science and Technology Policy (NISTEP), MEXT. Email: [email protected]
2 1. Introduction
Innovation has been recognized as the key to economic development and growth of firms.
Therefore, policy makers and enterprises constantly seek methods to promote innovation.
Holmstrom (1989) states that innovation is characterized by high risk of failure, unpredictability, path dependency, and unforeseen contingencies. Given these characteristics of innovation, several studies focus on how to successfully organize and manage innovation (Souder et al., 1998; Story et al., 2001; Tidd and Bodley, 2002).
Manso (2011) presents a model of the innovation process and the trade-off between radical and incremental innovation. The study also shows that optimal compensation schemes for managers motivate them to not only innovate but also exhibit tolerance for early failures and reward for long-term success. The study by Manso (2011) has implications for human resource management as well as for managing the innovation process. The results suggest a need for early feedback on performance. However, the effects of the threat of termination on incentives for radical innovation are ambiguous. In the present study, the threat of termination refers as to
“stopping investment” on the projects. This threat discourages researchers from exploring new actions, indicating a negative relationship between the threat of termination and radical innovation.
By contrast, studies on venture capital stage financing reveal how a threat of termination is positively associated with successful economic outcome (Gompers, 1995; Bergemann and Hege, 1998; Fluck et al., 2005). When projects are managed in stages, there is less uncertainty of technological and commercial feasibility if the project were to successfully progress to the subsequent stage. This implies that staging increases the value of the real option of the project.
Dahiya and Ray (2012) show that staged investment filters good projects from the bad by giving managers the option of terminating projects with low early returns. Managers can invest more in the later stages of the development process where there is no uncertainty and the expected profits increase. In reality, the later stage of the process typically costs more than the initial stage because of several aspects, such as, constructing a pilot plant, conducting market research, and testing the market. Therefore, the retained projects are viable, suggesting that staged project management leads to higher innovation success.
Although theoretical and empirical studies explore the mechanisms of innovation underlying management decisions and the condition under which an organization can encourage radical innovation, there is scant research on organization management related to R&D. Therefore, the present study empirically examines the relationship between research project management and innovation success. For the analysis, we use firm-level data obtained from the fourth round of the Japanese National Innovation Survey conducted by the National Institute of Science and Technology Policy (NISTEP) of the Ministry of Education, Culture, Sports, Science and
3
Technology in 2015 (J-NIS2015). This survey is the Japanese equivalent of the Community Innovation Surveys (CIS) conducted in European countries. These survey data help in understanding staged project management of innovation using information on project abandonment or continuation.
To measure technological innovation and distinguish product-oriented and process- oriented innovations, we use firm’s responses to the J-NIS 2015. The questions asking about the type of innovation carried out by the sample firms. Starting from product-oriented innovations, we consider (1) new-to-market product innovation, which measures whether the firm introduced a new or significantly improved good or service onto the market before its competitors; (2) only new-to firm product innovation, which measures whether the firm introduced a new or significantly improved good or service that was already available in the market from its competitors. Some studies have regarded the two types of product innovation as radical or incremental innovation (e.g. Tojeiro-Rivero et al. 2019).1 By contrast, as process-oriented innovations, we consider process innovation, which measures whether the firm adopted a new or significantly improved production process or delivery method etc.2 In this study, we merge firm- level accounting data with J-NIS 2015 for examining the factors why firms implement the staged management for innovation.
The study results reveal the following. First, R&D-intensive firms with a low debt ratio and those using various external information sources are more likely to manage projects in stages.
Firms adopting a staged development process use additional financial, physical, and external information resources. Firms with higher debt ratio may avoid project abandonment or reduce the total number of projects that potentially lead to new products; that is, financial constraints dissuade a firm from exploring new untested actions. In addition, the result suggests that firms collaborating with diverse partners from various regions may use external knowledge and information to filter the good projects from bad.
Second, compared to firms that do not manage development process in staging, firms engaging in staged management are likely to achieve higher propensity to innovate as well as larger sales volume of innovation products. The study result also confirms that firms that implement staging of innovation process increase their sales turnover of highly innovative goods or services similar
1 New-to-market or only new-to firm product innovation should be interpreted as measuring the degree of novelty of products introduced by the firm. Radicalness indicates some kind of novelty, but it is considered to transform the market in which the firm operates. Radical innovation likely to be very rare, while some new-to-market product innovation may have a potential to transform the market. It suggests that CIS-type survey may be a poor instrument for measuring radical innovation (OECD and Eurostat, 2018).
2 As well as product-oriented innovation We also considered new-to-market process innovation, which measures whether the firm adopted a new or significantly improved production process or delivery method etc. that have not been implemented by its competitors yet. However, we did not consider only new-to-firm process innovation because the J-NIS 2015 does not ask about such type of process innovation.
4
to that of incremental innovation, suggesting that the threat of termination on product development process encourages more radical product innovation.
This paper is also related to several strands of literature, such as papers that examine the link between project abandonment and innovation success. There is some quantitative evidence for the association of the cost/benefit and collaboration for innovation, suggesting that more novel projects are mutually associated with a higher “failure,” that is, project abandonment or delay, in innovation activities (for example, Guzzini and Iacobucci, 2017; Kobarg et al., 2019). Following the theory of real options decision making on the staged project management, the present study extends further to the explanation on why firms with project failure can achieve higher sales generated by innovation.
Section 2 of this study provides a literature survey and presents the empirical hypotheses.
Section 3 explains the data, key variables, and the empirical strategy. Section 4 presents the empirical results. Finally, Section 5 concludes.
2. Empirical Hypotheses and Literature Review
2.1 Staged project management and innovation radicalness
Staged innovation process is widely used to manage financial and physical resources for projects, including stages of ideation of new products or processes. The basic premise of staging is that projects only advance to the subsequent stages if there is justification for the risk involved in the next stage (Block and MacMillan, 1993). The justification, including the interim performance or action at each stage, is subsequently examined to decide whether to terminate or continue investing in the ongoing projects based on the milestones or metrics corresponding to the stage.
Manso (2011) theoretically examines the nature of contracts that promote radical innovation, based on the notion that the product development process involves several steps. In particular, the theory highlights the effects of feedback on performance, commitment to long-term contracts, and the threat of project termination. Manso (2011) shows the effectiveness of the combination of tolerance for early failure and reward for long-term success for motivating radical innovation.
Feedback on interim performance should guide adjustments and improvement in the research performance. Meanwhile, threat of termination of finance discourages researchers from shirking or exploring new actions; thus, it can undermine the incentives for radical innovation but foster incremental innovation. In a laboratory experiment, Ederer and Manso (2013) provide new evidence that the threat of termination with the golden parachute, such as cash bonuses and generous severance pay, can alleviate effects that hinder innovation.
Literature on venture capital (VC) stage financing also discuss the staging of projects and innovation radicalness. The staging of capital infusion by VC refers to the stepwise disbursement of capital to entrepreneurial firms. Gompers (1995) finds that VC staging occurs more frequently in industries with greater intangible assets, a higher market-to-book ratio, and intensive R&D
5
activities. The VC withholds investment in the early stages owing to the uncertainty. In particular, the VC sets a milestone at the first stage. If the project successfully clears this milestone, then the VC is convinced of the project’s viability and, therefore, invests more in the subsequent stages.
Several studies opine that stage financing allows a VC investor to learn about the entrepreneurial firm over financing, referred to as the learning hypothesis (e.g., Bergemann and Hege, 1998; Fluck et al., 2005). Dahiya and Ray (2012) theoretically and statistically show that the threat of termination is effective in screening projects and encouraging radical innovation compared with cases of upfront financing. The results suggest that staging creates value by generating a real option for the VC investor to terminate financing the project at each stage, depending on the VC investor’s learning between each stage about the venture or the entrepreneur.
Applying this theory to R&D and innovation projects, an R&D manager provides financial and physical resources to the projects that bind each resource to the point at which information is revealed about the quality of the project. This staged allocation builds real options by matching the amount of investment raised in each stage to the specific uncertainty that needs to be resolved with that stage of investment, for example, that of technological and commercial feasibilities (Kerr et al., 2014). Staging allows organizations to abandon projects with low early returns and, thus, filter good projects from bad. The ability to terminate projects when the intermediate information is negative prompts organizations to start projects that are more experimental in nature.
The production process that provides the option of abandoning or continuing ongoing projects based on the milestone has been adopted in both manufacturing and nonmanufacturing firms. A Product Development Management Association survey shows that 60% of the firms in practice adopt staged management in the product development process (Schilling, 2013). In a case study in Japan, Nishimura (2007) claims that over 90% of research institutes manage product development process and the funds by monitoring interim performance, not specified in staging, based on a series of criteria such as cost/benefit, fit with competencies, and technical feasibility.
With regard to the threat of termination in the staged development process, the issue of whether the staged approach encourages or discourages innovative outputs is ambiguous. Quantitative results underlying organizational studies indicate that trial-and-error learning aspects encourage radical innovation. For example, MacCormack et al. (2001) examine the characteristics of an effective production process in 29 development projects and find that a more flexible development process is associated with better-performing projects. In a study of 120 development projects in staged procedures, Sethi and Iqbal (2008) find a negative relationship between rigorous predetermined criteria and project flexibility. Although the sample size was small, the results may suggest that an explicit milestone possibly reduces the total number of radical innovation projects not only through screening in the earlier stages but also by discouraging incentives for innovation.
6
Few empirical studies of staged project management and innovation focus on large-scale firm- level databases, except the study by Andries and Hunemund (2014). They examine the relationship between staged project management and firm performance using the survey item on upfront financing for innovation projects at the beginning of a project or in stages based on Manheim Innovation Panel (MIP) for 2009 and 2011. These surveys indicate that 62% of the firms adopted staged management of innovation projects. The results show that implementing staged financing is positively associated with incremental innovation but not radical innovation.
Based on the arguments and findings on the staging of innovation projects earlier, the following hypotheses regarding the relationship between the project censoring and innovation success are drawn:
Hypothesis 1 Firms implementing in staged project management show better innovation performance than firms that do not.
Hypothesis 2 Firms implementing in staged project management have a larger amount of sales on radical innovations than on incremental innovations.
Hypothesis 3 Firms implementing in staged project management have a larger amount of sales on incremental innovations than on radical innovations.
2.2 Determinants of staged project management
Staging procedures act as screening tools for managers to terminate projects. Organizations that launch more than one project simultaneously are more likely to apply the staged approach in the development process. The decisions to invest further or terminate the project are often made by managers, whose actions are influenced by myriad problems of incentive, agency, and coordination. Therefore, the extent to which the best idea moves forward may depend on factors such as the organizational structure or the firm’s incentive system where the investor is based, the available information set, and other such frictions (Kerr et al., 2014). In addition, the interim milestone at each stage of the development process is notably associated with not only the go/not- go decision but also the number of potentially promising projects. Cooper and Edgett (2007) contend that managers can be flexible in their control of research performance because the milestone or metrics, including both financial and nonfinancial information, are represented at every round. If the goal is to explore new methods, the research organization will appropriately adjust its milestone to perform better by utilizing what one learns from external organizations.
Given these characteristics of staging, the present study focuses on the factors that are likely to affect managing for innovation: (1) total number of projects at the start, (2) research-friendly
7
organizational culture, and (3) sourcing of external knowledge for milestone. The remainder of this subsection reviews the findings of past empirical studies related to these factors. Studies showing the determinants of staged management projects are fairly scarce. Thus, there is much obscurity regarding the significant impact of those factors on implementing staging project management.
First, preferences for implementation in staged project management is dependent on firm size, reflecting the firm’s access to finance, sales economies, and differences in the work organization.
It is common that large firms may find it difficult to abandon projects before the termination even in case of infeasible projects, owing to the career concerns of the R&D managers in charge of the effort (Kerr et al., 2014). Conversely, large firms, including IBM, Procter & Gamble, 3M, General Motors, and Corning, run numerous concurrent projects using abundant resources (Schilling, 2013), reducing the time to development and increasing the proportion of technically and commercially viable products. The study assumes a positive relationship between the staged approach for managing innovation project and firm size.
Higher debt ratio also impacts the total number of potentially viable projects. Owing to the intangible nature, uncertain outcome, and asymmetric information, R&D-driven firms find it difficult to use external finance (Brealey and Myers, 1996; Czanitzki and Kraft, 2009). Under tight budget constraints, research organizations might reduce the number of potentially viable projects at their earlier stages. Andries and Hunermund (2014), who use credit rating index for German firms as a proxy for availability of financial resources, found that initially constrained firms reduce the number of projects when adopting staged project management.
A topic that has received considerable attention is the role of organizational research culture represented by ownership structure and founders’ social capital. Agency problems arising from information asymmetries between managers and owners negatively affect R&D investment decision (Ortega-Argil’es et al., 2005). Therefore, effective monitoring and in-depth understanding of the firm’s business and its underlying process reduce the information asymmetries between the owners and managers. Resource allocation to innovation projects is also influenced by the firm’s ownership structure (Miller and Le Breton-Miller, 2005). However, studies on ownership structure and innovation have produced mixed results. While some studies show that family firms commit more resources to investment activities than nonfamily firms, other studies on the underlying perspective of risk preference highlight that family firms commit fewer financial resources to long-term investment activities. Statistical studies (Anderson et al., 2012; Block, 2012) show that family-owned firms seek to reduce the risk levels by committing fewer resources to R&D projects.
Several studies empirically examine the link between top management team and innovation.
With regard to innovation, Balsmeier and Buchwald (2015) argue that top management experience is critical to a firm’s innovation strategy, because it enhances the understanding of
8
the process involved. Kaiser et al. (2018) used a variable of the ratio of top management team experienced in scientific research and suggested that research-friendly organizations are able to apply patents of highly cited research by hiring individuals with university research experience.
Chemmanur et al. (2018) find that managers with a postdoctoral degree are more likely to allocate resources to innovative projects. Results suggest that those managers accept uncertain product viability, which potentially increases the amount of sales generated by innovation, while they have more experience on the project termination. Although extant literature explains the importance of a research-friendly organization for innovation, few highlight the underlying theory. A positive relationship is assumed to exist between these variables and the staging approach. However, no research confirms the relationship.
Cooperation with other enterprises and institutions for innovation is another managerial dimension. Extensive literature shows that collaboration in innovation projects improves the innovation performance of firms (e.g., Kobarg et al., 2019; Du et al., 2014; Grimpe and Sofka, 2016; Aschhoff and Schmidt; 2008). Other organizations may have superior information on cutting-edge technology, consumer attitudes, and market potential of new products than the company’s R&D personnel. Based on the dataset of concept and development phases in the innovation process, D’Este et al. (2016) argue that external knowledge is crucial for a firm across all stages in the innovation process. These findings suggest that collaboration with other organizations will be beneficial advantageous as innovation partners seek broader information when deciding to stop or hold projects. Additionally, it might produce alternative innovation projects.
3. Data, Variables, and Empirical Approach 3.1 Data and sample selection
The present study uses firm-level data obtained from J-NIS2015.3 The survey is based on the Oslo Manual and provides extensive information on firms’ innovation activities and their outcomes, such as the sale of innovative, novel products. In 2015, questionnaires were sent out to 24,825 firms (10 or more regular persons employed); of which, 12,526 (50%) firms responded.
J-NIS2015 includes the up-to-date information on innovation activities for Japanese firms in
3 J-NIS was conducted in 2003, 2009, 2012, and 2015. Each round of the survey is considerably different in terms of sample size and size distribution of responding firms. Moreover, the questions and the choices provided for answers were also quite different, although all the rounds are based on the Oslo Manual. We could try to construct a panel consisting of firms. However, unfortunately, there are very few such firms so that we do not have a sufficient number of observations. In the 2003 survey, 19% of the firms that answered were large firms (250 or more persons employed), while in the 2009 survey 48% were large firms. In a similar way, in 2013 survey, 20% were large firms, while in the 2015 survey 9% were large firms.
9
addition to a largest realized sample size that is available for academic purposes.4 Therefore, J- NIS2015 data is useful for constructing the present study data set to identify the relationship between staging approach on the product development process and characteristics of the firms.
Savignac (2008) and Hall et al. (2016) state that, although questionnaire (self-reported) data represents an important source of additional information, such data are biased from interpretation.
The present study combines the J-NIS2015 with the company database compiled by a major credit investigation company in Japan, Tokyo Shoko Research (TSR). TSR database includes accounting data, information of the top five shareholders, detailed information on CEOs, and supplier and seller networks within firms. TSR database provides the names of supplier and customer firms as well as their individual company codes. Therefore, it is easier to identify each firm and connect to his/her basic information.
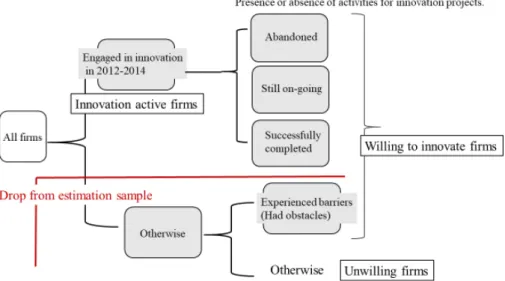
Figure 1 shows the multilayer structure of the J-NIS questionnaire. Only firms reportedly engaged in innovation activities are categorized as Innovation-active firms (Savignac, 2008;
D’Este et al., 2012), which were asked to complete the entire questionnaire. Innovation-active firms were those that answered they had developed new or changed the product or process, or that they have an experience with abandonment of innovation projects, or that they have incomplete or currently ongoing projects in the preceding three years. On including 3,524 innovation-active firms from the 2015 survey with the TRS data, 1,693 firms were included in the present study and excluded firms with a negative debt ratio to total assets. Consequently, the present empirical study included 1,468 observations obtained from firm-level fundamental information, accounting information, and information on business networks from the TSR database. Table 1 provides the number of firms by industry. From the detailed (3-digis level) industry information available, the study classifies firms into 11 manufacturing and 7 nonmanufacturing industries. The cross-section data include 727 manufacturing (49.5%) and 741 nonmanufacturing industries (50.5%).
INSERT Figure 1 INSERT Table 1
3.2 Key variables
The key variables in this research represent the staging of innovation project. The J-NIS2015 questionnaire included two items on activities that were abandoned before completion during the preceding three years and/or activities that were still ongoing at the end of 2014. In the study
4 In the 2003 survey, the questionnaire was sent out to 43,174 firms, and 9,257 firms answered (for a response rate of 21%). As for the 2009 survey, the questionnaire was sent out to 15,137 firms, and 4,579 firms answered (for a response rate of 30%). As for the 2012 survey, the questionnaire was sent out to 20,405 firms, and 7,034 firms answered (for a response rate of 35%).
10
dataset, 686 firms (46.7%) out of 1,468 firms had successfully completed projects without experiencing abandonment or kept ongoing projects (Successfully complete in Fig.1). A total of 191 firms (13%) had experienced abandoned innovation activities prior to completion (Abandoned in Fig.1), 743 firms (50.6%) had still ongoing projects at the end of the targeted year (Still ongoing in Fig.1), and 152 firms (19.4%) out of 782 firms (=1,468–686) had activities abandoned as well as still ongoing activities, respectively.
In the J-NIS, there is no detailed information on each project, represented interim milestone, the number of innovation projects engaged by the firm, those abandoned, and the stage at which some of them were abandoned. However, there is available information on whether a firm abandons at least one innovation project before the completion, and whether a firm has still ongoing projects at the end of targeted year on questions 7(a) and (b) of the J-NIS2015. We infer that firms engaged in the staging of innovation projects have more opportunities to make a decision about whether to abandon or hold still ongoing projects, which might account for the positive relationship between innovation and project abandonment or continuity.
Firms dragging a project for a long term, without referring to interim milestone, might be more inclined to hold on to the ongoing projects. Furthermore, project abandonment or continuation could depend on the product development process that is unique to the industry or firm characteristics. For example, firms producing life science products such as pharmaceutical and biologicals are well known as applying the “screening funnel” process to mitigate investment risk on clinical testing or regulatory approval (Soenksen and Yazdi, 2017). Substantial additional resources required to complete product development and commercialization differ among industries and firms, therefore, not all firms would impose necessary metrics to confirm market potential.
However, there is a promising explanation for the link between project abandonment or continuation and staging of innovation projects. MIP for 2009 and 2011 contains survey items on the total number of innovation projects a firm has initiated in the last three years as well as on a lump-sum funding for innovation projects at the beginning of a project in stages, indicating that 63.4% of the full sample is implemented in the staged process. Andries and Hunermund (2017) use these survey items and find that a staged approach impacts the likelihood of abandoning projects with a marginal impact of 0.69. Moreover, the study by Andries and Hunermund (2014) confirms that staged project management has a positive and significant effect on the project abandonment or continuity, whereas such a management approach has a negative and significant effect on the project successfully completed by the end the sample periods.
Although a few studies have empirically examined the relationship between staged project management and project abandonment or continuity using CIS, the present study follows their results and employs a binary variable as a proxy for staging approach, which takes the value of
11
1 if a firm experienced project abandonment or held on to ongoing projects during the study periods.
3.3 Empirical approach
3.3.1 Determinants of implementing in staged project management
First, a probit model is estimated to observe the determinants on a new product development process. The probit model assumes that there exists an underlying relationship, 𝑦𝑦𝑖𝑖∗= 𝑋𝑋𝑖𝑖𝛽𝛽 + 𝑢𝑢𝑖𝑖, where 𝑢𝑢𝑖𝑖~𝑁𝑁(0,1). Here 𝑦𝑦𝑖𝑖∗ is a latent variable for firm i measuring the likelihood of applying staged project management on new product development process, where 𝑋𝑋𝑖𝑖 is a vector of firm characteristics including firm size, financial conditions, and the extent of external resources used for innovation. The corresponding observed variable 𝑦𝑦𝑖𝑖is a binary variable, which assume a value of 1 for firms that have adopted a staging approach in innovation and 0 otherwise:
𝑦𝑦𝑖𝑖 = (𝑦𝑦𝑖𝑖∗> 0)
Table 2 presents a list of the variables, along their definition and sources, used in the following analysis. Appendix Table 1 reports correlation coefficients for all the variables.
INSERT Table 2
We include firm size as measured by the log of the number of employees in 2012. Furthermore, we include debt financing ratio, defined as debt finance divided by total finance, as a proxy for the firm’s capital structure. Debt includes numerous separate accounting items, including bills payable, accounts payable, and loans payable, and not all of these fit the concept of debt finance from capital markets. Shareholders’ equity includes retained earnings related to cash flow, and these accounting items do not fit the concept of equity financing from capital markets as well.
Therefore, we extract information on debt and equity finance directly from the financial statements.5
Two binary variables are taken as proxies for insider or outsider ownership structure, i.e., financial institutions or family members of founders. Financial institution is a binary variable that takes the value of 1 for a firm where trust and banking companies and insurance companies
5 In this study, debt finance is defined as the sum of short- and long-term loans payable, corporate bonds, and commercial paper. Equity finance is defined as the sum of paid-in capital, deposits for subscriptions to shares, additional paid-in capital, share warrants, and convertible bonds. Additionally, total finance (capital) is defined as debt finance plus equity finance, and debt finance ratio as the debt finance divided by total finance.
12
are listed in the top five shareholders. Similarly, another binary variable is constructed that takes the value of 1 for those firms with families of the founder. Moreover, as proxies for founder’s social capital, two types of variables are used, indicating whether the firm’s founder holds a university or postgraduate degree, taking the value of 1 for the firms with these types of founders, respectively.
As a proxy for sourcing of external knowledge, the study uses the logarithm of the number of geographical reasons for which a respective firm collaborated with a specific partner type, following studies measuring the diversity of external knowledge (Terjesen and Patel, 2017;
Chapman et al., 2018; Kobarg et al., 2019; Tsinopoulos et al., 2019). The study uses the information on project collaboration activity indicated by the responding firms on a matrix with the dimensions on seven types and nine geographical areas of the partners. For each country, firms indicated whether they had collaborated and the type of partner. Based on these data, a broad search was made as a measure of the overall number of partner types with which the firm collaborated in countries or regions, where the value could range between 0 and 63 (63 implies firms cooperating with all seven partner types in all nine regions/countries).
As another proxy for external knowledge sourcing, the study uses supplier/seller networks variables to indicate the possible spillover of industry-specific information and not through collaboration for innovation. Variables indicating the size and quality of the firm’s business networks are considered. For each firm i in industry j, we identify its main suppliers 𝑠𝑠𝑘𝑘0 and customers 𝑐𝑐𝑘𝑘0 up to a maximum of 20 (𝑘𝑘 = 1,2, … , 20). We also identify supplier 𝑠𝑠𝑙𝑙1 and customer 𝑐𝑐𝑙𝑙1, where (𝑙𝑙 = 1, 2, … , 20). Then the following ratio is calculated:
𝑆𝑆𝑢𝑢𝑆𝑆𝑆𝑆𝑙𝑙𝑆𝑆𝑆𝑆𝑆𝑆 𝑆𝑆𝑖𝑖𝑖𝑖𝑖𝑖𝑖𝑖𝑘𝑘 = 𝑁𝑁𝑢𝑢𝑁𝑁𝑁𝑁𝑆𝑆𝑆𝑆 𝑖𝑖𝑖𝑖 𝑠𝑠𝑙𝑙1 𝑎𝑎𝑖𝑖𝑎𝑎 𝑐𝑐𝑙𝑙1 𝑆𝑆𝑖𝑖 𝑆𝑆𝑖𝑖𝑎𝑎𝑢𝑢𝑠𝑠𝑖𝑖𝑆𝑆𝑦𝑦 𝑗𝑗
𝑁𝑁𝑢𝑢𝑁𝑁𝑁𝑁𝑆𝑆𝑆𝑆 𝑖𝑖𝑖𝑖 𝑖𝑖𝑖𝑖𝑖𝑖𝑎𝑎𝑙𝑙 𝑠𝑠𝑢𝑢𝑆𝑆𝑆𝑆𝑙𝑙𝑆𝑆𝑆𝑆𝑆𝑆𝑠𝑠 𝑎𝑎𝑖𝑖𝑎𝑎 𝑐𝑐𝑢𝑢𝑠𝑠𝑖𝑖𝑖𝑖𝑁𝑁𝑆𝑆𝑆𝑆𝑠𝑠 𝑖𝑖𝑖𝑖𝑆𝑆 𝑠𝑠𝑘𝑘0
Then, we consider the sum of all 𝑠𝑠𝑢𝑢𝑆𝑆𝑆𝑆𝑙𝑙𝑆𝑆𝑆𝑆𝑆𝑆 𝑆𝑆𝑖𝑖𝑖𝑖𝑖𝑖𝑖𝑖𝑘𝑘 = ∑ 𝑠𝑠𝑢𝑢𝑆𝑆𝑆𝑆𝑙𝑙𝑆𝑆𝑆𝑆𝑆𝑆 𝑆𝑆𝑖𝑖𝑖𝑖𝑖𝑖𝑘𝑘 𝑖𝑖𝑘𝑘.
Additionally, various other variables presenting firm characteristics in the estimation are included. We include the logarithm of the number of markets supplied by the firm as a proxy for the range of their activities. Intensity of R&D, measured as the logarithm of the ratio of R&D expenditure to total sales, is a proxy for a firm’s innovation inputs. ROA is defined as return on assets (i.e., net operating income before depreciation) divided by the book value of assets, indicating the profitability of a firm to control firm-level accounting profitability. Industry- specific factors such as industry-targeted technology policy, technological characteristics, and competitive pressures must be considered as well. These factors are controlled by including industry dummies.
13
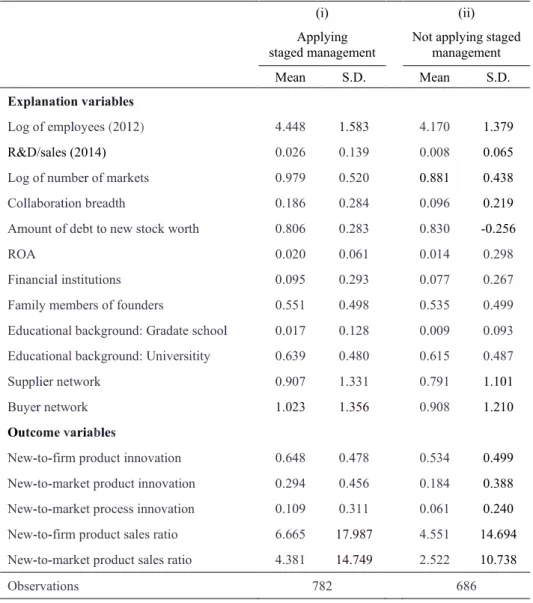
Table 3 presents the overall means of the variables used in the present econometric analysis.
Two categories of firms are compared: those that manage projects in staging and those that do not. Making univariate comparisons between the categories, it is found that firms adopting staging of innovation projects have a larger number of employees, a wider range of product market, higher R&D intensity, a large extent of innovation partners, and lower debt ratio to equity finance. Meanwhile, majority of the variables indicating the financial conditions and ownership structure do not exhibit a significant difference between the categories. As an outcome of innovation, firms adopting staged management are expected to be more likely to innovate products or processes and achieve larger sales volumes from innovative products.
INSERT Table 3
3.3.2 The effects of the staging approach: Treatment effect estimation
To test Hypotheses 1-3, the propensity-score matching (PSM) estimation6 proposed by Rosenbaum and Rubin (1983) is used. By matching treatment firms (i.e., firms that apply the staging approach in innovation) with the appropriate control firms (i.e., firms that do not apply such an approach) having the “closest” propensity scores, which are estimated based on the probit estimation in the previous subsection, a sample that is assumed to be sufficiently similar to the one generated by randomization is created. Among the several matching algorithms used to find the “closest” control observations, the nearest-neighbor matching estimators are employed, and the nearest-neighbor matching within the specified propensity-score calipers of 0.03 deviations are specified. In other words, we match each firm implementing staged project management in innovation with the most similar firms in the control group that do not apply staged approach.
The present study considers two types of variables representing the technological superiority of products or processes. On the basis of the J-NIS2015, we identify whether a firm introduced new or significantly improved goods or services onto the market before its competitors (new-to- market product innovation). Similarly, we identify whether a firm adopted new or significantly improved production processes or delivery methods that have not been implemented by its
6 Constructing a valid proxy for the counterfactual situation, difference-in-difference estimators, control function approaches (selection models), instrumental variable estimations, and matching techniques are used. For our cross-section dataset, we adopt a selection model but we do not obtain significant estimation results when we limit our sample to innovation-active firms only. We also tried to find appropriate, effective instrument variables that have an effect on innovation outcome but do not have an effect on a development procedure. However, the test of over-identifying restrictions indicated that our instrumental variables were likely to be correlated with the error terms.
14
competitors yet (new-to-market process innovation).7 Following prior studies, we regarded these two types of new-to-market innovation as proxies for radical innovation. Regarding product innovation, we also identify whether a firm introduced new or significantly improved goods or services that was already available in the market from its competitors (only-new-to firm product innovation). This indicator is considered to be a proxy of incremental innovations.
Panel (c) in Table 2 shows the definition of measurements of innovation outcomes. New-to- firm products are binary variables that take the value of 1 for firms developing new-to-firm goods or services but only those that are not new to the market. New-to-market products (or processes) are also considered as binary variables that take the value of 1 for the respective firms similarly.
To display the robustness of the study results, we also employ alternative measurements that indicate the significance of new products in the market. As indicators of the magnitude or importance of highly innovative goods or services, we employ the share of new-to-market products in turnover introduced by the firm in the preceding three years. Additionally, we assume the sales ratio of new-to-firm products as another variable, explaining the magnitude of incremental innovation.
After matching the firms, we measure the average causal effect (average treatment effect of the treated group, ATT) of a binary variable (the treatment) on the outcome variable. ATT is defined as
ATT = E(𝑌𝑌1− 𝑌𝑌0 | 𝑠𝑠𝑖𝑖𝑎𝑎𝑠𝑠𝑆𝑆𝑖𝑖𝑠𝑠 = 1) = 𝐸𝐸(𝑌𝑌1| 𝑠𝑠𝑖𝑖𝑎𝑎𝑠𝑠𝑆𝑆𝑖𝑖𝑠𝑠 = 1) − 𝐸𝐸(𝑌𝑌0| 𝑠𝑠𝑖𝑖𝑎𝑎𝑠𝑠𝑆𝑆𝑖𝑖𝑠𝑠 = 0)
where 𝑌𝑌1|𝑠𝑠𝑖𝑖𝑎𝑎𝑠𝑠𝑆𝑆𝑖𝑖𝑠𝑠 = 1 represents the realized innovation outcome for a firm managing development process in staging, and 𝑌𝑌0|𝑠𝑠𝑖𝑖𝑎𝑎𝑠𝑠𝑆𝑆𝑖𝑖𝑠𝑠 = 0 represents the counterfactual outcome for the same firm if it had not applied staging approach of innovation projects.
4. Estimation Results 4.1 Probit estimation
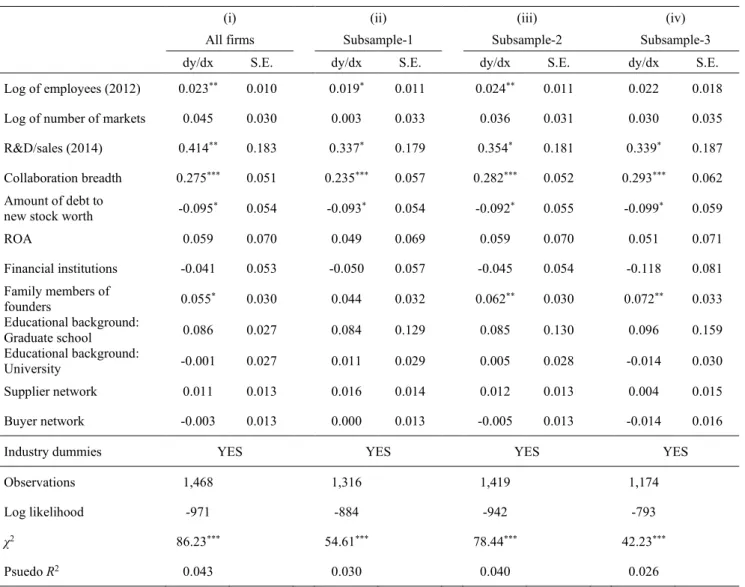
The results of the probit estimation are presented. These examine the factors determining implementation of staged project management. Table 4 presents the marginal effects as the means of the explanatory variables based on the probit estimation results. Additionally, confirming the robustness of the likelihood on firms’ applying the staged approach to their project management, we examine the determinants by using the three types of subsamples in a given sample. J-NIS
7 While process innovation can be considered as services for which the firm itself is the market, the term “new-to-market process innovation” means the new process that has not been adopted by any competitors of “markets” in which the firm operates.
15
does not contain survey items on the total number of projects that a firm had initiated during the sample periods nor staged funding that a firm adopted in the development process. Since there is no clear validation to judge which of the firms managed projects in staging, the robustness should be verified using the subsample of firms that are less likely to apply the staged approach.
Subsample 1 consisted of firms that have continuous projects but did not abandon any projects during the past three years or those that experienced project abandonment but do not hold on to the ongoing projects. This is done because we cannot identify whether those firms manage more than one project at the same time. Subsample 2 consisted of firms other than those in the pharmaceutical industry because pharmaceutical firms are promisingly managing the development process in staging. Subsample 3 consisted of small and medium sized firms that are not identified in relation to whether they are required to represent interim milestones to confirm market potential.
The study results reveal that firm size, breadth of collaboration, family ownership, and intensity of R&D have a positive influence on the implementation of staged project management in a given sample, although not all of the factors are strictly significant in the estimation results with Subsamples 1 and 3. R&D intensity has a much higher marginal effect than firm size does.
Nearly 50% of the study sample consists of the firms in the service sector and majority did not appropriate R&D expenditure. Although for the manufacturing firms, 1% point increase in R&D intensity raises the probability of implementing in staged project management by 41.4%, even for the firms in the service sector, 1% point expansion in firm size increases the probability of employing staged management on their product development process by 2.3%.
In terms of factors affecting the total number of projects at the start, debt financing ratio is negatively associated with the firms’ staged approach as our expectation. The study results suggest that a financially constrained firm is less likely to abandon the projects and keep ongoing projects, or more likely to reduce the total number of projects being potentially innovative. In other words, financial constraints dissuade a firm from searching for alternative innovative ideas;
ultimately, the firm becomes more conservative in innovation, i.e., allocates smaller budget on fewer projects.
While most of research-friendly organizational culture is not associated with management in staging, ownership structure, that is, family members of the founders in this study, has a positive and significant impact on the staging of innovation projects in all samples except one. The study by Wang and Zhou (2004) explaining the monitoring hypotheses in VC staging shows that managers engage in staging financing only if monitoring on the research organization is not cost- effective. Staged financing involves several steps where a manager observes the interim performance and then decides on the go/not-go drawing upon the mid-term milestone at every stage. A possible interpretation of the results is that family-owned, rather than nonfamily-owned,