• 検索結果がありません。

Improving a News Recommendation System in Adapting to Interests of a User with Storage of a Constant Size

N/A
N/A
Protected

Academic year: 2021

シェア "Improving a News Recommendation System in Adapting to Interests of a User with Storage of a Constant Size"

Copied!
7
0
0

読み込み中.... (全文を見る)

全文

(1)

Improving a News Recommendation System in Adapting to Interests of a User with Storage of a Constant Size

Akito Nishitarumizu, Tsuyoshi Itokawa, Teruaki Kitasuka, Masayoshi Aritsugi Computer Science and Electrical Engineering

Graduate School of Science and Technology, Kumamoto University 2-39-1 Kurokami, Kumamoto 860-8555, Japan

{akito@dbms., itokawa@, kitasuka@, aritsugi@}cs.kumamoto-u.ac.jp

Abstract—It is desired to have a system that can recommend news articles according to interests of a user, which would change with time. In this paper, we attempt to improve a news recommendation system with supervised classification by integrating a clustering method into the system in order to adapt flexibly to the variety of interests of a user. To follow the changes of interests with time, we need to make not only the classifier but also the clustering module of the system be easily updatable. We construct clusters in the feature space from combining one-dimensional clusters to make the size of storage to hold for updating clusters be constant. We let the data distribution in each one-dimensional space be influenced by the clustering results from another one-dimensional space, thereby taking into account of data distribution in the original multiple dimensional space. Main contribution of this paper is to propose a method that can achieve both of the two goals:

to improve the performance of a news recommendation system and to make the amount of data to hold for updating clusters be constant. Some experimental results are shown and the effective and weak points of our proposal are discussed.

Keywords-news filtering; news recommendation; personaliza- tion

I. I NTRODUCTION

It is required to recommend news articles to users ac- cording to their interests. Recently many online news have been available, and users can get a large amount of news articles. However, the number of news articles in which a user is interested tends to be relatively small compared to the number of whole news articles. To reduce the burden of finding interesting news articles, news recommendation techniques have been studied so far (e.g., a part of [1]).

Since interests of a user and trends of news articles would naturally change with time, a news recommendation system must be able to follow the changes flexibly. That is, the better a news recommendation system can follow the changes, the better it can recommend appropriate news articles.

iScore[2] is a news recommendation system. The system introduces various features, which range from topic rele- vancy to source reputation, and proposes to measure the interestingness of articles in a limited user environment not by using single feature but by using the multitude of them.

However, the system cannot work well when a user has several interests, each of which is independent of each other.

Because a user is likely to have multiple interests in the real world, this is a serious problem. To deal with the problem, Pon et al., who are the same authors of [2], use multiple profile vectors and add tracking multiple topics as a new feature to iScore[3].

Note that interests of a user can be modeled with a feature space, which consists of multiple dimensions including topics. If a user has multiple interests, we think that the multiple interests must not be treated with only the features relating to topics but with other multiple features as well.

That is, [3] can treat a user’s multiple interests that can be featured by the dimensions relating to topics in the feature space but cannot work well in other cases.

In this paper, we borrow and enhancing the news rec- ommendation system proposed in [3]. Our system can handle a variety of interests of a user, which are modeled with multiple features, and can also follow the changes of interests with time. To achieve these contributions, we propose a clustering method in which the size of necessary storage for updating clusters is constant, and integrate it into the system. Note that users’ interests must have a variety of different characteristics, and we do not intend that the clustering method can model every kind of them; instead, we propose a way for deciding whether we should or should not apply clustering to news recommendation to adapt to the variations. The paper reports some experimental results and discusses availabilities of our proposal.

The remainder of this paper is organized as follows.

Section II mentions related work and compares with our work. Section III proposes a clustering method with storage of a constant size and discusses how to integrate it into a news recommendation system. Section IV reports some experimental results to evaluate our proposal, and Section V concludes this paper.

II. R ELATED W ORK

There have been many studies on news recommendation.

Collaborative filtering, for example, has attracted many

researchers for personalized news recommendation (e.g.,[4],

[5], [6]). To exploit collaborative filtering, however, a large

number of collaborators is generally required.

(2)

Figure 1. A system overview.

[7] discussed the interface for user feedback and proposed a user model for short-term and long-term interests for news story classification. Although the interface is much interesting, they did not discuss well what features should be considered and how to deal with them for news recom- mendation.

iScore[2] is a recommendation system in a limited user environment. The study focused on what makes an article interesting. Fig. 1 shows an overview of the system. In [2], a set of article features, namely, topic relevancy, uniqueness, source reputation, writing style, freshness, and subjectivity and polarity, was introduced and combined to calculate the interestingness of an article for a user.

Moreover, [3] extended iScore to handle the situation where a user has multiple interests by using multiple profile vectors. The Rocchio algorithm[8] represents both topics of articles and interests of users as vectors, and each value of the vector is a tf-idf[9] value. The vector for an interest that a user has is called the profile vector. Topic relevancy is assigned by calculating the similarity between the vectors in the Rocchio algorithm. Note that the profile vector can express one interest of a user. In [3], a user’s interests are expressed with multiple profile vectors. Although this system can express multiple interests on topics, we believe this system may fail to completely express the variety of interests which are characterized by not only topics but also the other features.

In this paper, we borrow the architecture shown in Fig. 1 and the features consisting of the feature space proposed in [3] and enhance the system to handle multiple interests of a user by introducing a clustering method and integrating it into the system.

III. P ROPOSAL

A. Idea Behind Our Proposal

In this section, we propose a clustering method that can be updated with ease and discuss how to integrate it into a

Figure 2. Clustering in our proposal.

news recommendation system. Our ideas were motivated by the studies of [10] and [11].

One of the contributions of [3] is to propose a good set of features for modeling users’ interests. The system can work well when news articles are mapped into a narrow region in the feature space. However, since a user has naturally a variety of interests in the real world, we believe news articles are often mapped into wide regions in the space. To handle such situations, we exploit a clustering method.

Motivated by the results in [10], we attempt to develop a clustering technique and to introduce it into the news recommendation system proposed in [3] as a preprocessing to make data suitable for input to a na¨ıve Bayes. A na¨ıve Bayes might be affected when each class spreads into multiple regions. To improve this, [10] decomposes each class into clusters.

Because it is necessary for a news recommendation sys- tem to follow the changes of interests of a user with time, we have to take account of updating clusters in our proposal.

If we integrate the idea into the system straightforwardly, we need to hold a large amount of data for the update. To avoid this, we hold the distribution of news articles in the feature space as two sets of histograms: one is for interesting articles and the other is for uninteresting ones. A set of a histogram for interesting articles and the histogram for uninteresting articles corresponds to the distribution in one dimension of the feature space. Similar to [11], we handle the multiple dimensions of the space in calculating clusters with combining all the histograms, as will be described in detail in this section. The most significant different point from [11] is that our proposal makes the amount of data to hold for updating clusters be constant.

Fig. 2 shows an example in F

k−1

and F

k

space. We cluster the data according to each dimension in the two dimensional space, and as a result we get the two clusters, (F

k−1

, F

k

) = {((a, b), (g, h)), ((c, d), (e, f))} in the example.

A cluster is constructed to recognize a dense region in the

space. When clustering in one dimension, we consider the

range of a cluster generated in another dimension. In other

words, after generating a cluster according to F

k−1

feature

space, the cluster’s range is considered in clustering accord-

ing to F

k

feature space for affecting on the distribution in

F

k−1

space.

(3)

By doing this, we model multiple interests of a user with all dimensions. However, we do not hold histograms of co-occurrence frequencies of every two feature dimensions space but hold histograms of co-occurrence frequencies of F

k−1

-F

k

to make the amount of data for updating constant, as will be described in detail in this section.

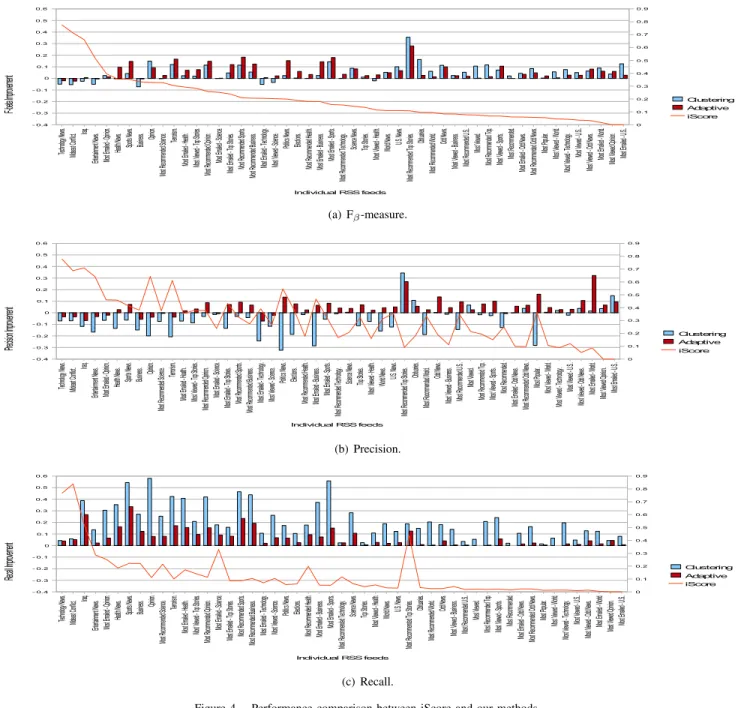
Our clustering method is expected to work for improving performance, especially recall, of a news recommendation system. In the current proposal, we handle interesting and uninteresting news articles individually. The amount of in- teresting news articles is generally much less than that of uninteresting ones. Thus, the clustering results with using interesting news articles tends to have stronger effects on the recommendation results than those with using uninteresting news articles. On the other hand, our method might not work well for improving precision.

Since users’ interests must have a wide variety of different characteristics, a clustering method cannot always improve the performance of a news recommendation system, or may rather decrease. We thus propose an adaptive method in which our system can select whether it applies our clustering method or not to generating a recommendation result.

B. Algorithms

1) Distribution generation: We generate distributions by calculating co-occurrence frequencies in a two dimensional space. Let F = {F

1

, F

2

, . . . , F

d

} be a set of features, and H = {H

1

, H

2

, . . . , H

d−1

} be the histograms we hold to cal- culate clusters

1

. We generate the histograms according to the suffix, for example, H

k−1

holds co-occurrence frequencies of F

k−1

and F

k

.

Let F

k−1

(i) and F

k

(j) be the frequencies of class i and j in F

k−1

and F

k

, respectively, and f (F

k−1

(i), F

k

(j)) be the co-occurrence frequency between F

k−1

( i ) and F

k

( j ).

Naturally, the value of f ( F

k−1

( i ) , F

k

( j )) comes from H

k−1

. Algorithm distGenerate is as follows.

Algorithm 1: distGenerate Input: Histogram H

k−1

and a cluster c ranging [ c

s

, c

e

] in F

k−1

Output: Histogram F

k

foreach class j in F

k

F

k

( j ) =

ce

i=cs

f ( F

k−1

( i ) , F

k

( j )) end foreach

As described later, a cluster inputted into the algorithm is an interval in one dimensional space, and thus is expressed as [c

s

, c

e

], as shown in the algorithm. When calculating F

1

, we use this algorithm by setting H

0

to H

1T

, c to the whole range in F

2

, and f (F

0

(i), F

1

(j)) to f (F

2

(i), F

1

(j)).

The algorithm generates distributions in one dimensional space F

k

by using histogram H

k−1

, which holds the fre-

1

Strictly speaking, H consists of two sets of histograms: one is for interesting articles and the other is for uninteresting articles. For simplicity, we omit to specify them in the following if there is no ambiguity.

(a) Two clusters are constructed. (b) One cluster is constructed.

Figure 3. Clustering examples.

quencies in (F

k−1

, F

k

) space. Note that when k > 2 the dis- tribution generation is processed only on the ranges, which are generated with Algorithm 1-dimClustering appearing later, in F

k−1

space.

2) Clustering in one dimensional feature space: After Algorithm distGenerate constructs F

k

, we construct clusters with interesting and uninteresting distributions of F

k

. We find the points where frequency in a histogram become from non-zero to zero or from zero to non-zero. When the distance between two contiguous points found is less than a threshold, we recognize the two points are in a cluster.

Typical examples are shown in Fig. 3. In our proposal, two clusters are constructed in the case depicted in Fig. 3(a), while one cluster is constructed in Fig. 3(b). How to set the distance threshold will be described later.

Algorithm 1-dimClustering is as follows.

Algorithm 2: 1-dimClustering

Input: Histogram F

k

and distance threshold DT Output: Clusters

foreach class i in F

k

find point pair P P that may be an interval between two contiguous clusters

if |P P | > DT then

we set P P the interval and create two clusters else we do not create any cluster

end if end foreach

3) Clustering: Our clustering method is to use the algo- rithms described above to a news recommendation system.

The algorithms consisting the method are Clustering and recurClustering as shown in the following.

Algorithm 3: Clustering

Input: Histograms H and distance threshold DT Output: Clusters

foreach i in { interesting, uninteresting } F

1

= distGenerate(H

1T

, c = [ c

0

, c

] ) C = 1-dimClustering(F

1

, DT ) foreach cluster j in C

recurClustering(H , DT, j, 2) end foreach

end foreach

(4)

Algorithm 4: recurClustering

Input: Histograms H , distance threshold DT, a cluster c, and counter k

Output: Clusters

F

k

= distGenerate(H

k−1

, c) C = 1-dimClustering(F

k

, DT ) foreach cluster j in C

label j as a cluster if k < d then

recurClustering(H, DT , j, k + 1) else

j is included in the output end if

end foreach

Each cluster obtained from Algorithm recurClustering represents a k-dimensional hypercuboid in combining fea- ture spaces ranging from F

1

to F

k

in k-th recursion, and each cluster obtained from Algorithm Clustering represents a d- dimensional hypercuboid in the whole feature space. Note that the clustering results of Algorithm Clustering are af- fected by the clustering results of Algorithm recurClustering, in other words, the order of features processed by Algorithm recurClustering may affect the final clustering results; we do not go through this here and will discuss in the next section.

As shown in the algorithm, we use a simple clustering method instead of more complex methods including the EM algorithm[12] and X-means[13]. One of the main reasons is that we want to make our proposal as simple as possible.

Not to mention, there are some cases where this clustering method may not be able to construct clusters appropriately, e.g., clusters should not be divided vertically of the axes in the space. We intend to consider this problem in future.

4) Recommendation method with clustering: The algo- rithm of our recommendation method with clustering is as follows.

Algorithm 5: Recommendation with clustering Input: A new article N , histograms H,

and distance threshold DT Output: Recommendation result RR,

updated histograms H

,

and updated distance threshold DT

C = Clustering(H, DT )

RR = na¨ıve bayes classify (N, C) H

= updateHistogram(N, H ) DT

= updateDistanceThreshold(DT )

The above algorithm is processed whenever a new article comes to the system. After producing a recommendation result for the new article, the histograms H and the dis- tance threshold DT are updated appropriately. Because it is likely, especially in initial stage, that news articles distribute sparsely in a feature space, we need to set the threshold be relatively large to avoid making the number of clusters too

large. The distance threshold is thus initially set to relatively large, and is reduced gradually to at most the bottom value, which is set in advance, as the number of training data grows.

The clustering results are used in the classification pro- cess, which is implemented with a na¨ıve Bayes as mentioned before. A cluster is treated as a subclass, and RR is produced according to the subclass to which the new article belongs in the highest probability, as in [10].

The time complexity of this method depends on the data distribution. Let k be the number of clusters, V be the number of classes in a feature space, and d be the number of features. The time complexity of distGenerate is obviously O(V

2

). There are at most O(k × d) distributions in each result of 1-dimClustering, and we have to perform distGenerate on each of the distributions. Therefore the time complexity of the recommendation method is O ( V

2

× k × d ) . If we set V and d as fixed value, the time complexity depends linearly on the number of clusters, which depends on the data distribution.

As described, the data we must hold to update clusters in the method are only two sets of histograms, one is for interesting articles and the other is for uninteresting ones. Because a histogram holds co-occurrence frequencies in a two dimensional space, the necessary space for the histogram is O(V

2

). Therefore the space complexity of the recommendation method is O(V

2

×d). If we set V and d as fixed value, the space size for updating is also a fixed value.

Obviously this is pretty better than the case where we have to hold all feature vectors of the whole articles.

5) Adaptive method: By using the recommendation method with clustering, we can improve the performance of a news recommendation system in cases where clustering can contribute to classifying articles. However, there are other cases where clustering may reduce the performance;

for example, if data are distributed sparsely in the feature space, our clustering method may reduce the performance.

Because the characteristics of users’ interests are various, we propose to use our clustering method and iScore[3]

selectively to adapt to the variation.

First, we modify F

β

-measure, which is

F

β

= (1 +

β2

)|IntArticlesRetr|

|ArticlesRetr| +

β2

|IntArticles| , to F

β

-measure as follows:

F

β

= (1 +

β2

)|IntArticlesRetr| + α|U nintArticlesN otRetr|

|ArticlesRetr| +

β2

|IntArticles| + α|U nintArticlesN otRetr|

where | U nintArticlesN otRetr | is the number of articles which should be classified in uninteresting and actually are recommended as uninteresting by the method.

Next, let P

clusteringint

, P

clusteringunint

, P

iScoreint

, and P

iScoreunint

be the results of the recommendation with clustering and

(5)

Table I P

ARAMETER SETTINGS

.

parameter value

# of features d 9

distance threshold DT [V,

V6

]

β in F

β

and F

β

0.5

α in F

β

0.25

minimum support m 0.4

partial completeness level k 1.5

# of recent articles for the adaptive method 100

iScore, respectively. We calculate P

clustering

and P

iScore

as follows.

P

clustering

= F

β

× max(P

clusteringint

, P

clusteringunint

) P

iScore

= F

β

× max(P

iScoreint

, P

iScoreunint

)

Then, we select the result of the method having larger P

. Note that, in order to calculate F

β

, we hold all feature vectors of a small number of recent articles in our adaptive method.

IV. E XPERIMENTS

The algorithms described in Section III have been im- plemented in Java, and we exploited Weka [14] as a na¨ıve Bayes classifier. In generating histograms, we par- titioned the values of each feature space by using equi- depth partitioning[15]. The number of classes V in a feature space was V = 2 × d

m × ( k 1) , where d is the number of quantitative attributes, or the number of features in this study, m is minimum support, and k is partial completeness level.

Table I shows the parameter settings we used in the experiments. We set DT to V initially, and reduced it 1 per processing one article, to its bottom value

V6

. We held feature vectors of 100 recent articles for calculating F

β

in our adaptive method described in Section III-B5.

The parameter settings were derived heuristically from our preliminary experiments.

We used 9 features in the experiments. They were bor- rowed from [2], [3] as follows: MTT, na¨ıve Bayes language model classifier, incremental cluster anomaly detection, writ- ing style, polarity, subjectivity, objective speech events, and subjective speech events. They were selected by observing the results shown in [3] and [2], that is, we thought that the features Rocchio, a variant of Rocchio, language modeling classifier, and cross-entropy language modeling classifier were able to be replaced by MTT and na¨ıve Bayes language model classifier.

In the experiments, we used 16,836 news articles from Ya- hoo! News RSS feeds collected from June to July 2009. The number of feeds was 51, and each of the feeds was labeled as

“<category>”, “Most Viewed <category>”, “Most Emailed

<category>”, and “Most Recommended <category>.” Each feed consists of articles which are ranked by multiple users’

activities such as reading, commenting on, or scoring them, and those which are selected by Yahoo! editors. Thus, we can think the higher ranking an article has the more a user is supposed to be interested in the article. We treated higher ranked articles as interesting ones in the experiments. Also, feeds labeled by Yahoo! editors were treated as interesting articles in the experiments. These treatments come from [2], [3].

We implemented and evaluated “Reduced iScore + MTT”[3] as iScore, our recommendation method with clus- tering and our adaptive method described in Section III.

These are denoted as “iScore”, “Clustering”, and “Adaptive”, respectively, in the following.

Fig. 4 shows the comparison between iScore and our methods in terms of F

β

-measure, precision, and recall.

Line and bar graphs report the results of iScore and of improvement of our methods to iScore, respectively. The feeds are sorted according to the F

β

-measure results of iScore.

Overall, our methods could improve the performance.

In particular our recommendation method with clustering could significantly improve the performance in the feeds that iScore tended to fail in appropriate recommendation.

In fact, our recommendation method with clustering could produce better results of F

β

-measure in 40 feeds out of 51 than iScore, and our adaptive method could produce better results in 47 feeds than iScore. According to the results shown in Fig. 4(c), the improvement was generated mainly by improvement of recalls. In contrast, there were many feeds in which precisions of our recommendation method with clustering were worse than iScore. We need to improve precisions of our recommendation method with clustering.

Also, in some feeds our adaptive method could produce better performance than our recommendation method with clustering but in other feeds our adaptive method produced even worse performance than our recommendation method with clustering. A modification of F

β

-measure described in Section III-B5 may be able to improve this; this will also be included in our future work.

Fig. 5 shows the changes of average values of F

β

over time. We can see that the performance of our methods slightly increased with time while that of iScore slightly decreased in our experiments. This may be because the number of data in our experiments could be smaller than the expected number in using iScore. Note, however, that the results showed that our methods could work well even in relatively small number of available data.

The experiments run on a machine with an Intel Core2 Quad Q6600 2.40GHz CPU and 4GB main memory. Fig. 6 shows the times for clustering. As discussed in the previous section, the time does not depend on the amount of data. It took about 1.6 ms in average to do clustering per one article.

As mentioned before, the performance of our method may

be affected by the order of features to be treated with in

(6)

Figure 5. Average performance results over time.

Figure 6. Times for clustering.

Algorithm Clustering. Fig. 7 shows the performance results in randomly selected three variations of the order. To high- light the influence of the order, we report the performance results of our recommendation method with clustering in the figure. The results denoted as “Clustering-Order1” in the figure are identical with the results shown in Fig. 4(a).

As shown in Fig. 7, we must say that the performance of our recommendation method with clustering is actually affected by the order of features, the overall tendencies are almost the same, though. That is, our proposal tends to give better performance than iScore, overall. How to decide an appropriate order will be included in our future work.

V. C ONCLUSION

In this paper, a clustering method was proposed and inte- grated into a news recommendation system with supervised classification. Our method can improve the performance by using clustering, while it makes the amount of data to hold for updating clusters be constant. Some experimental results show that our proposal actually can improve the performance of news recommendation.

As we discussed in this paper, we need to make our clustering method more sophisticated, e.g., in terms of decisions of thresholds and feature order.

R EFERENCES

[1] M. J. Pazzani and D. Billsus, “Content-based recommenda- tion systems,” in The Adaptive Web, ser. Lecture Notes in Computer Science, vol. 4321. Springer, 2007, pp. 325–341.

[2] R. K. Pon, A. F. Cardenas, D. Buttler, and T. Critchlow,

“iScore: Measuring the interestingness of articles in a limited user environment,” in CIDM 2007: Proceedings of the IEEE Symposium on Computational Intelligence and Data Mining, Apr. 2007, pp. 354–361.

[3] ——, “Tracking multiple topics for finding interesting arti- cles,” in KDD ’07: Proceedings of the 13th ACM SIGKDD international conference on Knowledge discovery and data mining, 2007, pp. 560–569.

[4] J. Wang, A. P. de Vries, and M. J. T. Reinders, “Unifying user-based and item-based collaborative filtering approaches by similarity fusion,” in SIGIR ’06: Proceedings of the 29th annual international ACM SIGIR conference on Research and development in information retrieval, 2006, pp. 501–508.

[5] A. S. Das, M. Datar, A. Garg, and S. Rajaram, “Google news personalization: scalable online collaborative filtering,” in WWW ’07: Proceedings of the 16th international conference on World Wide Web, 2007, pp. 271–280.

[6] X. Amatriain, N. Lathia, J. M. Pujol, H. Kwak, and N. Oliver,

“The wisdom of the few: a collaborative filtering approach based on expert opinions from the web,” in SIGIR ’09:

Proceedings of the 32nd international ACM SIGIR conference on Research and development in information retrieval, 2009, pp. 532–539.

[7] D. Billsus and M. J. Pazzani, “User modeling for adaptive news access,” User Model. User-Adapt. Interact., vol. 10, no.

2-3, pp. 147–180, 2000.

[8] J. Rocchio, Relevance Feedback in Information Retrieval.

Prentice-Hall, 1971, ch. 14, pp. 313–323.

[9] G. Salton and C. Buckley, “Term-weighting approaches in automatic text retrieval,” Inf. Process. Manage., vol. 24, no. 5, pp. 513–523, 1988.

[10] R. Vilalta and I. Rish, “A decomposition of classes via clustering to explain and improve naive bayes,” in ECML:

Proceedings of the 14th European Conference on Machine Learning, ser. Lecture Notes in Computer Science, vol. 2837, 2003, pp. 444–455.

[11] R. Agrawal, J. Gehrke, D. Gunopulos, and P. Raghavan,

“Automatic subspace clustering of high dimensional data for data mining applications,” in SIGMOD ’98: Proceedings of the 1998 ACM SIGMOD international conference on Man- agement of data, 1998, pp. 94–105.

[12] G. J. McLachlan and T. Krishnan, The EM Algorithm and Extensions. Wiley-Interscience, 2008.

[13] D. Pelleg and A. W. Moore, “X-means: Extending k-means with efficient estimation of the number of clusters,” in ICML 2000: Proceedings of the Seventeenth International Confer- ence on Machine Learning, 2000, pp. 727–734.

[14] WEKA, “Weka machine learning project,”

http://www.cs.waikato.ac.nz/ml/.

[15] R. Srikant and R. Agrawal, “Mining quantitative association

rules in large relational tables,” in SIGMOD ’96: Proceedings

of the 1996 ACM SIGMOD international conference on

Management of data, 1996, pp. 1–12.

(7)

(a) F

β

-measure.

(b) Precision.

(c) Recall.

Figure 4. Performance comparison between iScore and our methods.

Figure 7. Performance results in variations of clustering order to features.

Figure 2. Clustering in our proposal.
Figure 3. Clustering examples.
Table I P ARAMETER SETTINGS . parameter value # of features d 9 distance threshold DT [V, V 6 ] β in F β and F β 0.5 α in F β 0.25 minimum support m 0.4
Figure 5. Average performance results over time.
+2

参照

関連したドキュメント

[9] DiBenedetto, E.; Gianazza, U.; Vespri, V.; Harnack’s inequality for degenerate and singular parabolic equations, Springer Monographs in Mathematics, Springer, New York (2012),

Keywords: continuous time random walk, Brownian motion, collision time, skew Young tableaux, tandem queue.. AMS 2000 Subject Classification: Primary:

Thus, we use the results both to prove existence and uniqueness of exponentially asymptotically stable periodic orbits and to determine a part of their basin of attraction.. Let

, 6, then L(7) 6= 0; the origin is a fine focus of maximum order seven, at most seven small amplitude limit cycles can be bifurcated from the origin.. Sufficient

Section 4 will be devoted to approximation results which allow us to overcome the difficulties which arise on time derivatives while in Section 5, we look at, as an application of

“Breuil-M´ezard conjecture and modularity lifting for potentially semistable deformations after

Then it follows immediately from a suitable version of “Hensel’s Lemma” [cf., e.g., the argument of [4], Lemma 2.1] that S may be obtained, as the notation suggests, as the m A

In order to be able to apply the Cartan–K¨ ahler theorem to prove existence of solutions in the real-analytic category, one needs a stronger result than Proposition 2.3; one needs