77
An Evaluation Method of Transportation Policies by the Quality of Mobility Index based on Capability approach
Youhei EITOKU a , Shoshi MIZOKAMI b
a Kumamoto Office, Fukuyama Consultants Co., LTD., 1-21 Minami-Sendanbata, Kumamoto City, 860-0842 Japan; E-mail: [email protected]
b Graduate School of Science and Technology, Kumamoto University, 2-39-1 Kurokami, Kumamoto City, 860-8555 Japan; E-mail: [email protected]
Abstract: This study aims to develop a model for the evaluation of Quality of Mobility (QOM) based on the Capability approach pioneered by Amartya Sen. It seeks to illustrate how to use such model in the evaluation QOM among regions by applying this to the condition in Yamaga City, Japan. Evaluation results indicate that the transportation service level in this city will decrease and the inequality will expand in the future. Therefore, some policies were prepared and evaluated. Using the model, it was concluded that the policy that will encourage people to live in the city center and improve road will enhance QOM.
Keywords: Capability approach, Structural equation modeling, Vector Product
1. INTRODUCTION
The depopulation trend due to the ageing population is expected to become more serious in local cities of Japan in the coming years. Thus, it is more important than ever to integrate villages and cluster them together to maintain the social base efficiency and share social welfare facilities. How to maintain transportation service levels is very important to evaluate these factors. QOL (Quality Of Life) must be evaluated by concerning the maintenance of Infrastructure. In this paper, the Quality of Mobility (QOM) is defined as an integrated index which evaluates the transportation service level. This paper proposes a method for evaluating service levels and the equity in the entire region using Capability approach. It then outlines the model to calculate QOM. The model is then applied to evaluate the transportation policy to be adopted for a local City in Japan.
2. EVALUATION TECHNIQUE BY CAPABILITY APPROACH 2.1 A Framework of Capability Approach
Capability approach has been put forward by Sen (1985). A person’s capability to achieve functioning that he or she has reason to value provides a general approach to the evaluation of social arrangements, and this yields a particular way of the assessment of equality and inequality.(Sen, 1992) The core concepts of Capability approach are functionings and capabilies. Functionings are the “beings and doings” of a person, whereas a person’ capability is “the various combinations of functionings that a person can achieve. Capability is thus a set of vectors functionings, reflecting the person’s freedom to lead one type of life or another.
(Sen, 1992)
In Capability approach, there is no established measurement scale for functionings, and
78
there is not a method for aggregating functioning. There is rich literature on how to model Capability approach. Non-statistical methods include the Human Development Index (HDI) adopted by the United Nations Development Programme (UNDP), Fuzzy-sets-theory (Oizilbash, 2002), and Analytic-Hierarchy-Process (Inoi, 2005). The common feature of these methodologies is that the value of functioning can be easily interpreted with subjective evaluations. On the other hand, the common weakness is the high dependence of the results of the evaluation on the competence of the evaluator. Statistical analysis methods include Factor Analysis (Lelli, 2001), Principal Components Analysis (Klasen, 2000), and Structural Equation Modeling (Kuklys, 2004). The common feature of these methods is that information from the data itself is used to determine the weights.
The construction of the index for composing QOM, its functioning’s expression, functioning’s measurement, functioning’s ranking and functioning aggregation is difficult. The authors proposed a methodology which can approximate the four functions using statistical analysis to keep the objectivity of the solutions.
2.2 Functioning’s Expression
In his book “Commodities and capabilities”, Sen (1985) formalized the following relationship between commodities and capabilities as follow:
The achieved function of person i is:
( ) (
i)
i
i
f c x
b = (1)
where x
i:the vector of commodities possessed by person i
( ) ⋅
c :the function (not necessary linear) converting a commodity vector into a vector of characteristics of those commodities
( ) ⋅
f
i:a personal ‘utilization function’ of i reflecting one pattern of use of commodities that i can actually make
The vector b
ireflects the beings and doing a person can achieve, because “Well-being then, can plausibly be seen as an evaluation of this b
i, indicating the kind of being he or she is achieving.” (Sen, 1985, p.12.) As the list of functioning decides capability’s value, the list and description method of functioning become problems.
2.3 Functioning’s Measurement
The commodity and happiness of a being can be observed directly, but the functioning cannot be observed. In this section, the measurement method for the functioning is explained.
By Capability approach, the happiness that an individual will enjoy is given by u
i:
( )
i i(
i( ( )
i) )
i
i
h b h f c x
u = = (2)
where h
i( ) ⋅ :the happiness function of person i related to the functionings achieved by i
79
The functioning vector b
ican be expressed by using the model following equations (1) and (2). As can be seen, the functioning is described by the latent variable which exists in the middle of the commodities and the happiness by using Structural Equation Model. When the happiness is an endogenous variable and commodities are exogenous variables, the functioning is conceptualized as a latent variable which can only be measured with error of data.
2.4 Method of Measuring Value of Functioning Vector
In the Capability approach, the value of a single functioning vector b
iis given by the real- valued functioning vectors v
i( ) ⋅ , which is person i ’s valuation function.
( )
ii
i
v b
v = (3)
There are two problems for measuring value of functioning vector.
The first problem is the difficulty of comparing functionings because the directions of the vector are too different to measure the value. For example, it is difficult to judge which is more important, the mobility of shopping or the mobility of going to the hospital. According to Sen, evaluating a functioning vector can take the form of giving a scalar value to this vector. Because it is difficult to rank all functioning vectors, Sen has proposed a range of methods including “Dominance ranking” for extending incomplete orderings.
The second problem is that posed by the possibility of high multi-collinearity because the functioning vectors are mutually related. Actually, since each mobility purpose is consecutive in one day or one month, mobility purposes correlate mutually. For this, functioning vectors should be independent of each other.
In the light of these challenges, the authors propose a method for converting two or more functioning vectors b
iinto principal integrated vectors b
i'by using Principal Component Analysis. As a result of Principal Component Analysis, multi-collinearity is eliminated.
Moreover, because the sums of squared loadings obtained by Principal Component Analysis shows the volume of information of converted functioning vector, the size of functioning vector b
i'can be assumed to be proportional to sums of squared loadings.
2.5 Method of Aggregating Value of Functioning Vector
In Capability approach, the capability set of a person is given by the set Q
i( ) x
iof all the functioning vectors that are feasible for person i :
( )
i[
i i i( ( )
i) ( )
i i i i]
i
x b b f c x f F x X
Q = = , for some ⋅ ∈ and for some ∈ (4)
where F
iis the set of ‘utilization function’ f
i( ) ⋅ , any one of which person i can in fact choose.
The capability set Q
i( ) x
irepresents the freedom of choice of a person, who can decide
between several combinations of functionings what are the most valuable for him. Among all
feasible vectors of functionings, one will be chosen and will be the achieved vector of
80
functionings. The values of all functioning vectors present in a capability set are given by V
i.
( )
i[
i i i( )
i i]
i
x v v v b b Q
V = = , for some
iin (5)
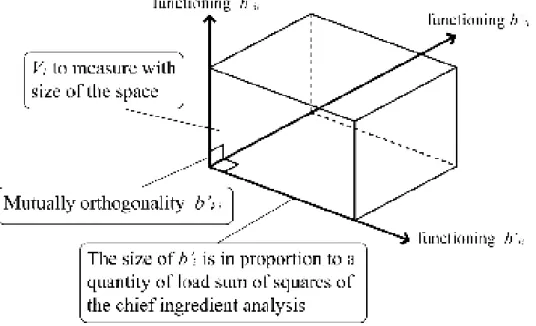
Sen (1992) insists that the equality should be sought in the space of capability. Capability is a set of such functioning n-tuples, which means that capability is defined in the space of functionings (Sen, 1993). Because functioning vectors b
i'intersect squarely, the value of set of functioning vectors is shown by the size of the space, which is composed of functioning vectors b
i', as shown in Fig.1. In a word, the value is calculated by the Product of the size of the converted functioning vectors b
i'.
Figure 1. Size of the Functioning Vector Space
3. MODELING OF QOM
3.1 Outline of Modeling of QOM
Figure 2 shows the structure of the models used to calculate QOM. The right part of Figure 2 shows a model of transportation possibility, which is modeled according to equations (1) and (2). The left part shows a model of selected transportation possibility, constructed on the basis of using equations (3) and (5). The model is analyzed by using data obtained through a questionnaire survey in Yamaga City, Japan.
3.2 Factor of Transportation Possibility
Among all feasible vectors of functionings, one will be chosen. Thus, it is necessary to enumerate the selected functioning for the mobility. In this paper, these are identified as:
selection of transportation, selection of the migration pathway, selection for mobility purpose and selection of the target facilities. In this study, selection for mobility purpose and selection
図3-6 functioningベクトルの空間の大きさ
81
of the target facilities are described in the functioning. There are nine transportation purposes defined.
Figure 2. Outline of two models
3.3 A Model of Transportation Possibilities
In this study, transportation possibilities constitute three concerns, “mobility by travel time”,
“mobility by transportation selection” and “comfort in transportation facilities”. The model of
“mobility by transportation selection” uses the effect value of the modal choice model. The relation between transportation frequencies and permissible times in a year is analyzed, and then the model of “mobility by travel time” is built. The model of “comfort in transportation facilities” is used to evaluate the comfort between the origin and the destination with a set of drivability data provided in the “Road drivability Map”.
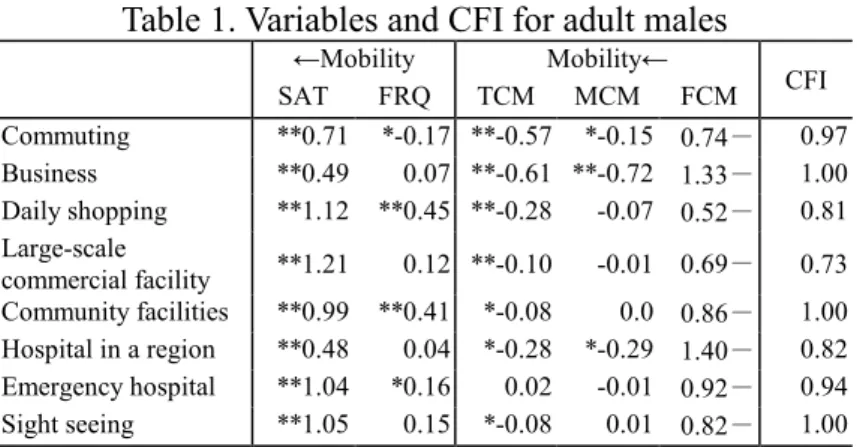
These three factors are integrated according to Structural Equation Model. Latent variables of Structural Equation Model are defined as transportation possibility functionings (see Figure 3). Table 1 shows the result by Structural Equation Model, because CFI value is a rough value, about 0.9 or more, so the accuracy is guaranteed.
3.4 A Model of Selected Transportation Possibilities
The model of selected transportation possibilities is composed of two models. The first one is the model of “ease of selecting plural destinations”. This model is a gravity model in which the attractiveness of the destination is given through a certain weight.
The second one is the model of “ease of selecting transportation purposes”. Capability is described by a set of the vectors of functioning (the transportation possibility). The magnitude of Capability is same as the magnitude of Vector Product of these functioning’s vectors, which is defined as QOM. Through Principal Component Analysis on the values calculated by the
※ an example for daily shopping
■ Model of the transportation possibilities
■ Model of selected the transportation possibilities
Mobility to large–scale commercial Daily
mobility in daily
Non-daily mobility QOM
Travel time Total satisfaction
rating
Car license
Drivability Mobility by
transportation selection
Comfort
in transportation facilities
Frequency
Mobility for daily shopping Satisfaction rating
Mobility by travel
time
82
“ease of selecting plural destinations” model, the values for various transportation purposes are synthesized to two principal ingredients. With these two principal perpendicular ingredients x
1i, x
2i, QOM can be expressed by the Cobb-Douglas Production Function in equation (6). Here, the ratio of squared loadings is assumed to be the share parameter in the Cobb-Douglas Production Function. For the adult male in Table 2, the first principal component can be interpreted as non-daily mobility.
α α 1−
2 1i i
i
ax x
QOM = (6)
Figure 3. A model of transportation possibility Table 1. Variables and CFI for adult males
←Mobility Mobility←
SAT FRQ TCM MCM FCM CFI
Commuting **0.71 *-0.17 **-0.57 *-0.15 0.74 - 0.97 Business **0.49 0.07 **-0.61 **-0.72 1.33 - 1.00 Daily shopping **1.12 **0.45 **-0.28 -0.07 0.52- 0.81 Large-scale
commercial facility **1.21 0.12 **-0.10 -0.01 0.69- 0.73 Community facilities **0.99 **0.41 *-0.08 0.0 0.86 - 1.00 Hospital in a region **0.48 0.04 *-0.28 *-0.29 1.40- 0.82 Emergency hospital **1.04 *0.16 0.02 -0.01 0.92- 0.94 Sight seeing **1.05 0.15 *-0.08 0.01 0.82 - 1.00
※1) **t>1.96 , *1.00< t <1.96
Table 2. Principal component score
Adult male Adult female Senior citizens first second First second First second Emergency hospital 0.87 -0.03 0.85 -0.02 0.71 0.36 Hospital in a region 0.69 0.47 0.78 0.13 0.82 0.13
Sight seeing 0.85 0.20 0.70 0.17 0.13 0.88
Caltural facilities 0.78 0.26 0.82 0.08 0.27 0.87 Community facilities in a region 0.74 0.27 0.20 0.14 0.84 0.35 Emergency hospital 0.71 0.45 0.61 0.19 0.72 0.22
Daily shopping 0.67 0.31 0.12 0.80 0.81 0.04
Business 0.05 0.91 0.28 0.48
Commuting 0.33 0.58 -0.03 0.81
Accumulated proportion 67% 55% 71%
Mobility Mobility by transportation selection ( MCM ) Mobility by travel time
( TCM )
Comfort in transportation facility (FCM) Frequency
Satisfaction rating ( SAT )
83
3.5 Setting of Evaluation Index
By using feasible maximum and smallest QOM values, QOMR is expressed as a percentage of QOM value. The entire region is evaluated by three indices. The first index is the mean value ( QOMR ) of QOMR .It is used to evaluate the service level in the whole region. The second index is an Atkinson index ( AI ), which evaluates the inequality in equation (7). The third index ( QOMA ) is an index with an Atkinson type function for evaluating the service level and inequality of the region in equation (8). The Atkinson index ( AI ) is evaluated by specifying the parameter ε, which shows the evasion level of inequality.
( )
ε − ε
−
−
= ∑
1 / 1 1
/
1 n
QOMR AI QOMR
n
i
i (7)
( ε )
ε
−−
= ∑
1 / 1 1
_________
/ n QOMR
QOMR QOMR QOMA
n
i
i
(8)
where, n is population.
4. EVALUATION OF TRANSPORTATION POLICY IN LOCAL CITIES 4.1 Outline of Target Area
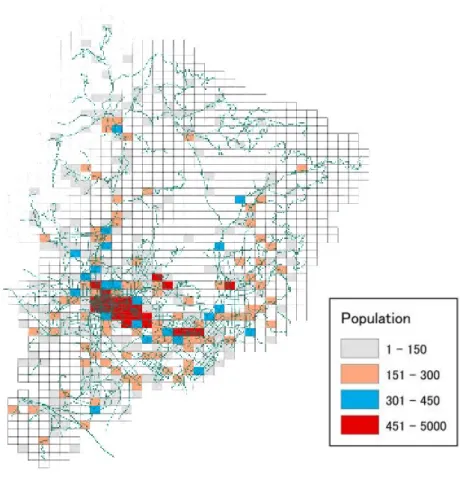
Yamaga City is a local city that was formed through the merging of four towns in 2003 and has a population of 50,000 (see Figure 4). It takes about one hour to travel from this city to prefecture capital, Kumamoto City. This city is an independent region with simple transportation purposes such as work and school commuting.
4.2 Setting of Transportation Condition
The transportation policy is evaluated on the assumption of the following conditions.
1) The rank of the country and prefecture road is set by the data of “Road drivability Map”.
2) Input data that concerns the information on the car license and the car ownership, etc. is obtained by the questionnaire survey.
3) The evaluation is carried out for both the year 2000 and 2030. The estimated population issued by National Institute of Population and Social Security Research is used.
4) The position of target facilities according to transportation purposes will not change in the future. Table 3 shows the target facilities and the public attractiveness according to transportation purposes.
4.3 Analysis of the Current State and the Trend in the Future
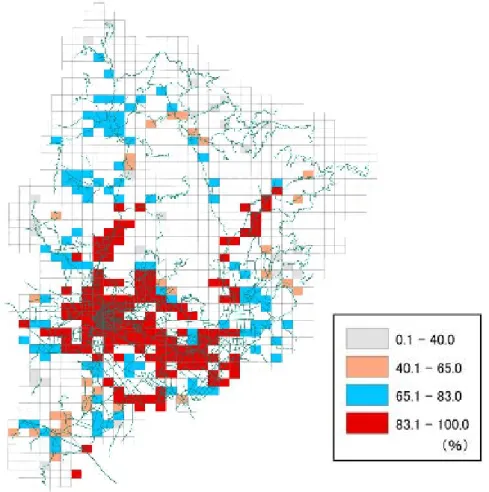
As an example of the analysis result, Figure 5 shows the distribution of QOMR at the current
population of senior citizens. In urban area, QOMR is higher than the mean value 82%. But it
is very low in other regions. Figure 6 shows the population composition rate according to the
84
rank of QOMR . Persons in areas with a QOMR of around 20% are in a service level lower than the mean value ( QOMR ). Table.4 shows QOMR , Atkinson index ( AI ), and QOMA value of 2000 and 2030. QOMR decreases, AI increases. The result shows that the transportation service level will decrease and the inequality will expand. The important reason is that the public attractiveness of each facility decreases in proportion due to the population decrease in the future.
Table 3. Target facilities and public attractiveness Purpose Target facilities and Public attractiveness
Commuting, Business Districts in which number of employees is concentrated
The public attractiveness is proportional to the number of employees.
The proportion will decrease as the population decreases in the future.
Daily Shopping.
Community facilities in a region
Shops in this city and Community facilities in a region
The public attractiveness of each facility is assumed to be constant.
The proportion will decrease as the population decreases in the future.
Large-scale commercial facility, Large-scale hospitals, Large-scale community facilities
Downtown of the prefecture capital The public attractiveness is constant.
Hospitals in a region Hospitals in this city The public attractiveness is constant.
Sightseeing Kikuchi (sightseeing location) The public attractiveness is constant.
Figure 4. Distribution of population of Yamaga City
85
Figure 5 Distribution of QOM value at current state (The senior citizens)
0 10 20 30 40 50 60 70 80 90 100
0 5 10 15 20 25 30 35 40 45 50 55 60 65 70 75 80 85 90 rate of accumulation
according to rank the
the the
the Q o M R mea n mea n mea n mea n 82.89
Q o M R (((( % % % % ))))
sh ar e o f po pu la ti o n
Figure 6 Population composition by the rank
86
Table 4. QOMR value
(AI value is calculated as ε=0.8.) 4.4 Scenarios Used for Evaluation
Two scenarios are evaluated to solve the problems presented in Subsection 4.3. The first scenario is to improve the road, and the second scenario is to distribute the population properly to each district. Three cases were evaluated for the first scenario. The first case is that new roads do not need improvement. The second case is to improve sections ranked “D” to
“C” in the “Road drivability Map”, which is called “road in region”. The third case is to upgrade Ueki Bypass (10 km) to the main road between Yamaga City and Kumamoto City, which is called “main road”.
Table 5. Criteria for ranking of road
Rank Criteria
A 2 or more lanes, gentle curves/slopes.
B 2 or more lanes, fully gentle curves/slopes.
C One lane road with sharp curves.
2 or more lanes, many sharp curves and steep slopes.
D One lane road with continuous sharp curves.
Road shoulders are always narrow.
The second scenario is to distribute the population properly to each district. Similarly, three cases were evaluated in this scenario, as shown in Table 6.
Table 6. Cases Evaluated in Scenario 2: Population Distribution
Case Method
Maintain the current condition The rate of change of the population according to the group’s age for the four towns is multiplied by the current population according to the age's group of each zone.
Maintain the population of mountainous districts
The rate of change of the population according to the group’s age for this city is multiplied by the current population according to the group’s age for each zone.
Concentrate the population around the city center
Population in the zone with QOMR less than 60% is transferred to the zone with QOMR more than 75%.
4.5 Evaluation of Cases for Scenario 1
The results of the evaluation of QOM in three cases to improve the road are shown in Figure 7 and Table 7. By improving main roads between cities, a large effect of improving of QOMR is achieved, but the effect of improving the inequality ( AI ) is small. On the other hand,
2000 2030 2030/2000
Population 59491 45927 0.77
Elderly Population 15635 17778 1.14
QOMR (%) 82.89 80.55 0.97
QOMA 81.12 78.50 0.97
Atkinson index 0.0214 0.0255 1.19
87
improving roads around this region has a large effect on improving the inequality ( AI ), but a small effect on improving QOMR . However, the ratio of the low service population ( QOMR is 60% or less) is the same in both cases. In 2030, compared with 2000, the transportation service level ( QOMR ) will decrease and the inequality ( AI ) will expand. So the service level at the current state could not be maintained only by this road improvement method.
0.02 0.022 0.024 0.026
79 80 81 82 83
mean of QOMR
A tk in so n i n d e x
Main road(2030)
Road in region(2030)
2000 current
st at e(2030)
Figure 7. QOM of cases to improve the road 4.6 Evaluation of the Different Cases to Distribute the Population
Figure 8 shows the evaluation results of QOM in the future in three cases to distribute the population. In the case of concentrating the population around the city center, both QOMR and the inequality ( AI ) are improved compared with the current state. However, in the case of maintaining the population in mountainous districts, QOMR decreases and the inequality ( AI ) increase, much worse than the current state.
4.7 Direction of Transportation Policy of Yamaga City
In the future, the population will decrease due to the increasing number of senior citizens. To a large extent, the population will concentrate in the city center and the public attractiveness of various facilities will decrease. As a result, the transportation service level will decrease and the inequality will expand in the future.
In the condition that the investment is limited, it is suggested that the administration
improve QOM, and keep equality in the entire region. This will ensure that investment will
not be wasted. This analysis shows that concentrating the population around the city center
and improving the main road from Yamaga City to Kumamoto City is a good measure that
should be considered in the policy.
88 0
0.01 0.02 0.03
79 80 81 82 83 84 85
mean of QOMR
A tk in so n i n d e x
2000
T o concent rat e around t he cit y cent er(2030) current
st at e(2030) T o m aint ain of
mount ainous dist rict s (2030)