of Transit Jointed Development in Taipei Metropolitan Area
著者 Pai Jen‑te, Huang Yong‑han
journal or
publication title
International Review for Spatial Planning and Sustainable Development
volume 1
number 2
page range 15‑24
year 2013‑01‑01
URL http://hdl.handle.net/2297/34405
15
International review for spatial planning and sustainable development, Vol.1.2(2013),15-24 ISSN: 2187-3666 (online)
http://hdl.handle.net/2297/32453?locale=en
Copyright@SPSD Press from 2010, SPSD Press, Kanazawa
The Travel Behaviours Change of the Residents of Transit Jointed Development in Taipei Metropolitan Area
Jen-te Pai
1*and Yong-han Huang
21 Department of Land Economics, National Chengchi University, Taiwan.
2 Postgraduate of Department of Land Economics, National Chengchi University, Taiwan.
* Corresponding Author, Associate Professor, Taipei 116,Taiwan. Email: [email protected]
Key words: Transit Oriented Development, Transit Jointed Development, Travel Behavior Abstract: In recent years, there are plenty of researches advocating the concept of
Transit Oriented Development. Among the mass transit infrastructure projects driven vigorously by the government, the most important one is the construction of MRT. In Taipei Metropolitan Area, the Transit Jointed Development (TJD) is flourishing while the construction of the MRT system is gradually completed. Up to now, there are 82 sites in Taipei MRT system, among which 35 sites have been completed and opened for lease with totally 75,577,369 square meters floor area for 6,317 households. Thus, can TJD improve the Transit Oriented Development become a very important issue.
Therefore, this research selected 9 TJD sites for discovering the travel behaviours of the residents before and after they moved in the TJD housing.
The research findings show that compared with the data before the residents moved in the residences of TJD, their MRT share for commuting increased from 25.92% to 57.11%, and the car share declined from 28.44% to 15.60%. The total distance reduced was 42.68km, averagely 0.1km reduction per household everyday. In terms of the commute days, the total driving days reduced 373 days, averagely 0.86 day reduction per household; and the total MRT commuting days increased 619 days, averagely 1.42 days increase per household. The totally travel time reduction is 1,133 min, averagely 2.6 min reduction per household; and the cost totally reduced NT$1349, averagely NT$3 reduction per household;.
According to the results, TJD has significant positive effect on improving MRT share and reducing car usage. Besides, the results also show that TJD reduce the work commuting distance, commuting time and cost, and helps the government undertaking the Transit Oriented Development.
1. INTRODUCTION
In recent years, Taipei MRT system has been under sustained
development. Te total passenger volume of Taipei MRT had exceeded
500,000,000 person-trips until Dec. 29th, 2010. Taipei MRT will formally
become a member of Nova/CoMET and conduct technological exchange
with the subway systems of international metropolises such as London, New
York, Paris and Moscow, which implies Taipei MRT development is tending
to mature. As the Taipei MRT system is gradually completed, the TJD is
increasingly important. However, since there is a lack in the studies of TJD in Taiwan currently, this study is going to investigate and analysis the travel change of TJD residents.
In the past decades, in order to cope with the great population in Taipei metropolitan area and the consequent traffic jam and air pollution, government has taken much effort on the MRT system construction in Taipei Metro Area. Meanwhile, the TJD plan has been integrated in the MRT system for financing. As a result, TJD has become one of the common ways to furnish the Transit Oriented Development (TOD) in Taiwan.
So far, there are 82 development sites in Taipei MRT system, among which 35 sites have been completed and open opened for lease with totally 75,577,369 square meters floor area for 6,317 households. However, to what extent can TJD improve the MRT usage is still lack of research. Therefore, taking the TJD sites completed and open for lease as the subjects, the study selects 9 sites for the empirical research in order to understand the travel behaviour change of the TJD residences. Travel behaviours contain the amount of car ownership by the residents, the transportation mode for commute, the car usage frequency and the commute time and cost.
According to the motivation mentioned above, the study first compares the travel behaviours before and after the residents moved into TJD housing.
Then, the study discusses the factors that cause the change of travel behaviours, expecting to provide planning suggestions for further TJD development.
2. LITERATURE REVIEW
TJD is the practical implementation of TOD. According to the study of Quade et al. (1996), when the population density of a certain area is doubled, the usage of MRT system will be more than double. From this we can see the ratio of MRT share increases as the population density increases. With such a development orientation, the study is going to understand how the travel behaviours change and what factors result in the change, with the expectation to find out the reasons based on the findings of the previous studies. The effects of TOD and TJD on the commute travel can be seen in Cervero’s (2008) research. He takes 900 households in Shanghai and its three subzones (Jiangqiao Town, Meilong & Shenzhuang Town and Sanlin Town) as the subjects, Cervero (2008) observed the change of the accessibility to work from the residence area, the change of the mode for commute and the change of commute time after the residents moved to those sites. The findings are as follows:
(1) The accessibility to work reduces the least after they moved from downtown to the area with subway service.
(2) In the case that transport modes have been changed, the most common change is from non-motorized vehicle to bus, which is followed by the change from bus to subway. Besides, the cars ownership of the residents increase which leads the car commute increases greatly.
(3) The commute time increases when the non-motorized vehicle is changed to motorized one. That’s because the residence is farther to the work place after moving, which means the speed superiority of the motorized transport can be balanced by the distance.
CTODRA (2004) investigated the TOD areas in the U.S. In 2000, there
were 140,000 citizens (62,000 households) living in the areas within half
mile (about 800m) around the subway stations throughout the U.S. That
Pai and Huang 17 study covered 27 TOD areas and classified them according to the scale of city (giant, large, middle and small). The results showed that the household types and the building styles in TOD areas have the following features: 1) the households in TOD areas are relatively small; 2) the householders who afford the family in TOD areas are mainly 18-24 years old and the middle- aged are rare, which is more common in small cities; 3) there is no significant difference in the family income, but the extremely poor households in TOD areas obviously decrease as the subway system grows;
4) the larger the city is, the fewer the residents in TOD areas own the houses, which is possibly caused by the house price according to the author; and 5) the amount of cars held and the frequency used by the residents in TOD areas are significantly low.
After investigating the residents who moved into TOD areas (within 400- 800m around the station) in San Francisco Bay, Los Angel, San Diego during 2002-2006, Hollie (2006) explored the following questions: 1) what types of the households are in TOD areas; 2) what factors lead people to move to TOD areas, and whether the reasons for moving are all the same among different types of households; and 3) whether those factors affect the application of mass transit. Through the Binary Logit Model Analysis, he arrived at the following results:
The residents in TOD areas of San Francisco Bay pay more attention to the residence cost, those in Los Angel pay more attention to the environmental quality of surroundings, and those in San Diego emphasize on the type and quality of the residence.
The families with different incomes live in different TOD areas. For example, high-income families live around the subway stations, while the low-income families live around the bus stops.
The residents in TOD areas use mass transit for 13-40 times more than others per year.
As the literature reviewed above, the benefits of TJD are summarized into three aspects as follow.
(1) Transportation mode
TJD is closely related to TOD. According to the definition of TJD mentioned above, the TJD is the practical implementation of TOD and thus contributes a lot to the transport. Zhong (1997) indicated that TJD is helpful to improve the finance of MRT construction and promote the usage of mass transit.
(2) Land Use
In the respect of land use, Chang (2007) indicated that TJD integrates the transport, commerce and residence effectively, and exhibits the mixed land use concept of TOD practically. Li and Lai (2007) claimed that the mixed land use can improve the efficiency of land use, reduce the commuting time trip numbers.
Moreover, Chen (2007) put forward some practical ideas on the TJD and land use types. In the business area, it is often positioned as office building, shopping mall, business apartment or multifunctional building. In the residential zone, it is positioned as diversified residences with 2-4 rooms. In some large cases, residences are also accompanied by shopping mall or other facilities to support the daily life.
(3) Real Estate Market
In the respect of real estate market, Chen (2007) pointed out that the price
of the residences of TJD tends to be steady and soaring up from the
perspective of the law of supply and demand in the real estate market. That’s
because the MRT network has currently become wider and the value of TJD
in the future is gradually increasing. Moreover, according to Hong and Lin (1999), the distance between residence and the MRT station has significant effect on the residence price. The price decreases as the distance increases.
Since the distance between the residence of TJD and the MRT station is 0, the residence price of TJD should be the highest.
3. RESEARCH DESIGN
There are totally 34 TJD sites of both the primary and subsequent networks, they were classified and sampled for the empirical research, based on which the questionnaire and survey are designed. The study classifies the stations into four types according to the transportation feature.
(1) Transfer Station
Transfer Station refers to the junction of two or more MRT or railway lines, for example, Taipei Main Sta., Zhongxiao Fuxing, Zhongxiao Xinsheng, Minquan W. Rd., Guting and Banqiao. The land-use type in those areas were mainly commercial. They feature as the hubs of urban traffic with strong transfer trips. They have the same functions as the interchange stations, but the transfer capability is stronger. Most of them are the cores of urban development.
(2)Terminal Station
Terminal Station refers to the terminal of a MRT line, for example, Yongning, Nanshijiao, Xindian, Daqiaotou, Luzhou, Zhuwei and Danshui.
They are located usually near the outskirts with relatively low land use.
Those areas focus on residence and the commercial function is in lack. The housing type is different from public housing, since there are more private housing. The traffic condition is relatively poorer in shortage of convenient mass transit, which requires more private vehicles.
(3) Interchange Station
Interchange Station refers to the station with plenty of bus lines nearby which facilitates the interchange. The station with more than 20 bus lines is defined as the interchange station, for example, Gongguan, Dingxi, Dapinglin, Qizhang and Jing’an. The commerce is often flourishing in those areas with the developing power next to the transfer stations. Both the interchange stations and the transfer stations are hubs of traffic, but the former is weaker than the latter in terms of transfer capability. Most of them are the cores of regional development.
(4)Regular Station
The stations without the above features are defined as the regular stations, for example, Yongchun, Houshanpi, Yong’an Market, Xianse Temple and Jiangzicui. The areas are often the residential zones with perfect living functions. They are similar to the interchange stations in terms of development model, but the strength of development is weaker. As for the traffic, the mass transit is more convenient than the terminal stations but inferior to the interchange stations.
Since the study focuses on the correlation between the TJD and the change of travel behaviour, the residential TJD buildings in different developing conditions are chosen for the study on the change of travel behaviour. The sampling principal is as below.
(1) Serving more than 2 years.
Being ignorant of the occupancy rate, the study chooses the TJD
buildings that have got the building usage license for more than 2 years as
the selecting objects in order to find sufficient household samples.
Pai and Huang 19 Moreover, after 2-year experience, the residents can really reveal life-style changes after moving, especially, the cognition for MRT convenience and the need for parking space supply.
(2)Mainly used for residence
Since the study mainly discusses the travel behaviour, the residential TJD buildings were selected as the empirical sites. The land use is based on the building usage license.
(3) With the MRT stations located in New Taipei City
Compared with Taipei city, the MRT system of New Taipei city is under development and the domestic habit of using mass transit is gradually formed. Besides, New Taipei city can support more volume and larger scale of development. Thus it is an object worthy of observation and study. Since the MRT system of New Taipei city is under development, we can further observe what factors affect the usage of MRT significantly.
Based on the above principles, the following TJD buildings are selected:
Dingxi, Yong’an Market, Jing’an, Dapinglin, Qizhang, Xindian Dist.Office, Xindian and Jiangzicui. After sample selection, we can find the total number of households in the survey scope is 2,647. According to the findings of field survey, the average occupancy rate is estimated as 70%. The period of survey is from 1st July 2011 to 31th Oct. 2011.
4. ANALYSIS OF THE SURVEY RESULTS 4.1 Sample background Analysis
Totally 2,362 questionnaires were distributed for the study and 471 were returned, which 463 were considered valid. After the preliminary sorting, the Reliability Analysis was conducted on the questionnaires. On the whole, the Cronbach’s α was 0.552 which means the questionnaires were reliable.
According to the statistics and analysis on the 436 valid questionnaires, males and females account for 48.85% and 51.15% of the samples respectively. The 18-40 years old householders who afford the family account for 63%, while the 40-50 years old householders account for 37%, which shows most of the respondents are young adults.
In terms of the number of family members and the monthly family income, the households can be classified into small families and normal families. In the study, small families generally have two or more persons, while normal families have three or more persons. According to the monthly family income, the households can be divided into low-income families, middle-income families and high-income families. In the study, the monthly income of the low-income families is less than NT&50,000, the middle- income families fall in the range from NT&50,000 to NT&110,000, and the high-income families, above NT&110,000. In the respect of the family type, the small family samples take the majority, accounting for 60.32%; the common family samples account for 39.68%.
In the respect of family income, the middle-income family samples take
the majority, accounting for 50.23%; the low-income families take the
second place, accounting for 28.21%; and the high-income families are the
fewest, accounting for 21.56%.
4.2 The Changes of Travel Behaviours
(1) The change of car ownership
In the respect of car ownership before and after the moving, the samples without car increase from 180 to 217; the samples with one car reduce from 203 to 188; and the samples with two or more cars reduce from 53 to 31. The car ownership totally reduces 59 at least after the moving (as in figure 1).
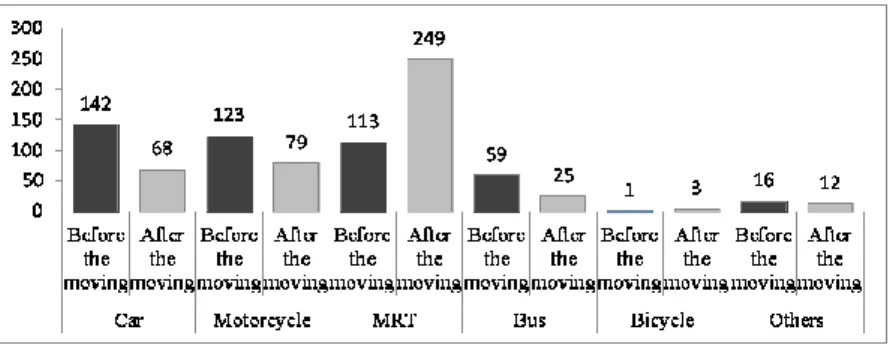
(2) The change of commute mode
Most residents of the TJD buildings used to drive before they moved, accounting for 28.44%. After moving, most residents use MRT, accounting for 57.11%. Compared the different modes before and after the moving, it’s found that the MRT usage for commute increases from 25.92% to 57.11%, while the car usage reduces from 28.44% to 15.60% (as in figure 2).
Figure 1. The comparison of the car ownership before and after the moving
Figure 2. The comparison of vehicles used before and after the moving
Table 1. Styles in the CF2001 template (%) County/City Mass
transit Motor-
cycle Car On
foot Bicycle Others/taxi Total proportion Dept. of Rapid Transit
Systems
Taipei 23.38 29.72 12.75 28.28 4.50 1.37 100.00 New Taipei 15.02 45.13 14.84 21.12 3.14 0.74 100.00 Statistical Dept. of Ministry
of Trans. and Com.
Taipei 34.10 29.90 16.20 15.40 4.20 0.20 100.00 New Taipei 24.90 44.60 14.50 10.90 4.70 0.30 100.00
The study New Taipei 63.84 18.12 15.60 - 0.69 2.75 100.00
(Source: The abstract analysis of the Survey of the Daily Vehicle Application of the Public issued by the Statistical Dept. of Ministry of Transportation and Communications in 2010. The Estimation Model of the Entire Transportation Demand in Metro Area of Taipei issued by Department of Rapid Transit Systems in 2010.)
Compared to Taipei City, the people of New Taipei City had already used the mass transit more frequently than the people of Taipei County and Taipei City before they moved to the TJD buildings (as in table 1). After the moving, the MRT usage increased greatly. Thus we can infer that the
180 217 203 188
53 31 500
100150 200250
Before the moving After the moving Before the moving After the moving Before the moving After the moving
0 car 1 car 2 or more cars
Pai and Huang 21 residents of TJD buildings used to be the users of MRT and had formed the habit before they moved. Thus with the greatly improved convenience of MRT, the MRT usage increases significantly after they moved into the TJD buildings.
(3) The change of the frequencies of car and MRT usage for commute In the respect of the usage frequency for commute, the samples without driving increase from 231 (before the moving) to 292 (after the moving), and the samples without taking MRT reduce from 214 (before the moving) to 82 (after the moving). The samples driving to office more than 4 days per week reduce from 125(before the moving) to 62(after the moving), and those taking MRT more than 4 days per week increase from 120 (before the moving) to 229 (after the moving). As for the commute days, the driving days reduce 373 days, averagely 0.86 day reduction per head, and the MRT usage days increase 619 days, averagely 1.42 days increase per person.
Figure 3. The comparison of the driving frequencies before and after the moving
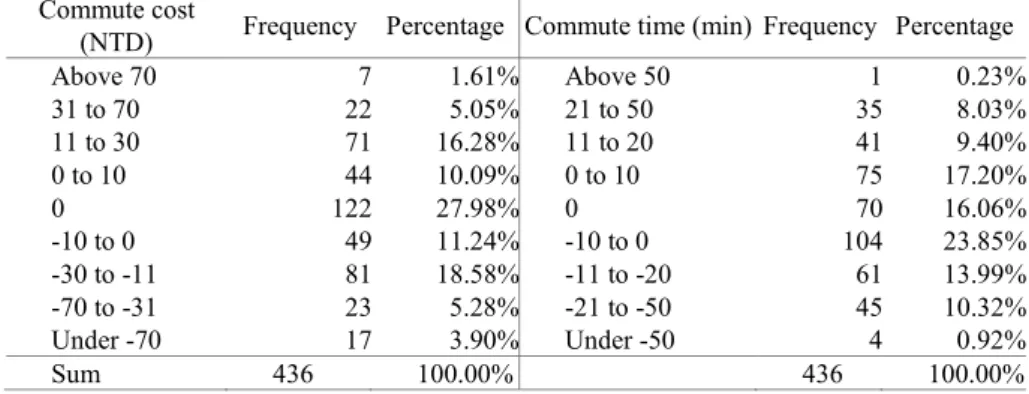
Table 2. The frequency distribution of the commute time and cost Commute cost
(NTD) Frequency Percentage Commute time (min) Frequency Percentage
Above 70 7 1.61% Above 50 1 0.23%
31 to 70 22 5.05% 21 to 50 35 8.03%
11 to 30 71 16.28% 11 to 20 41 9.40%
0 to 10 44 10.09% 0 to 10 75 17.20%
0 122 27.98% 0 70 16.06%
-10 to 0 49 11.24% -10 to 0 104 23.85%
-30 to -11 81 18.58% -11 to -20 61 13.99%
-70 to -31 23 5.28% -21 to -50 45 10.32%
Under -70 17 3.90% Under -50 4 0.92%
Sum 436 100.00% 436 100.00%
(4) The changes of commute time and cost
As for the daily commute time and cost, the residents of TJD buildings spend totally 1,133min less on the commute than that before the moving, averagely 2.6 min reduction per person. The commute cost reduces NT$1,349, averagely NT$3 reduction per person. The frequency of change on the commute time and cost is listed in Table 2.
4.3 Influential Factor Analysis
(1) The effect of MRT station type on the car occupancy
By using cross-tabulation analysis to discuss the relationship between the car ownership and MRT station type. The result of chi-square test is
231 292
34 31 22 32 24 19 125 62 1000
200300 400
Before the moving After the moving Before the moving After the moving Before the moving After the moving Before the moving After the moving Before the moving After the moving
No driving 1 day/week 2 days/week 3 days/week above 4 days
significant (chi-square value is 30.696, and P is less than 0.01), which means there is significant relationship between the car ownership and MRT station type. From Table 3, it’s found that there are 82 samples own cars around the terminal stations, accounting for 61.7%, which is higher than interchange stations (56.2%) and regular stations (36.3%). It’s inferred that the MRT is less convenient for the samples around the terminal stations and the private vehicles are required, so the car ownership is higher.
Table 3. Crosstable of car ownership and MRT station type
MRT station type sum
regular interchange terminal Car ownership
0 63.7% 43.7% 38.3% 49.8%
1 32.1% 45.9% 54.1% 43.1%
2 and above 4.2% 10.3% 7.6% 7.1%
sum 100.0% 100.0% 100.0% 100.0%
Pearson chi-square value 30.696***
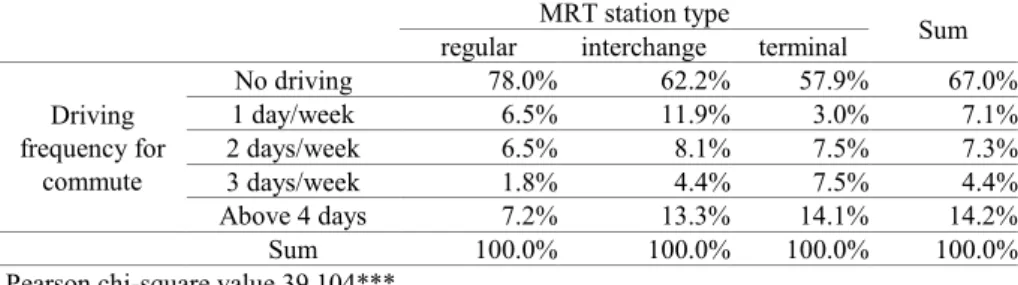
(2) The effect of MRT station type on the driving frequency
As to the driving frequency for commute and the MRT station type. The result of chi-square test is significant (chi-square value is 39.104, and P is less than 0.1), which means the driving frequency for commute is significantly related to the MRT station type. From table 4, it’s found that the samples around terminal stations who drive for commute account for 42.1%, which is higher than the samples around interchange stations (37.8%) and regular stations (22%). It’s inferred that the MRT is less convenient for the samples around terminal stations and the private vehicles are required, so the driving frequency for commute is relatively higher. Moreover, according to the car occupancy analyzed above, the car occupancy of samples around the terminal stations is the highest, which results in the higher driving frequency.
Table 4. Cross table of driving frequency and MRT station type MRT station type
regular interchange terminal Sum
Driving frequency for
commute
No driving 78.0% 62.2% 57.9% 67.0%
1 day/week 6.5% 11.9% 3.0% 7.1%
2 days/week 6.5% 8.1% 7.5% 7.3%
3 days/week 1.8% 4.4% 7.5% 4.4%
Above 4 days 7.2% 13.3% 14.1% 14.2%
Sum 100.0% 100.0% 100.0% 100.0%
Pearson chi-square value 39.104***
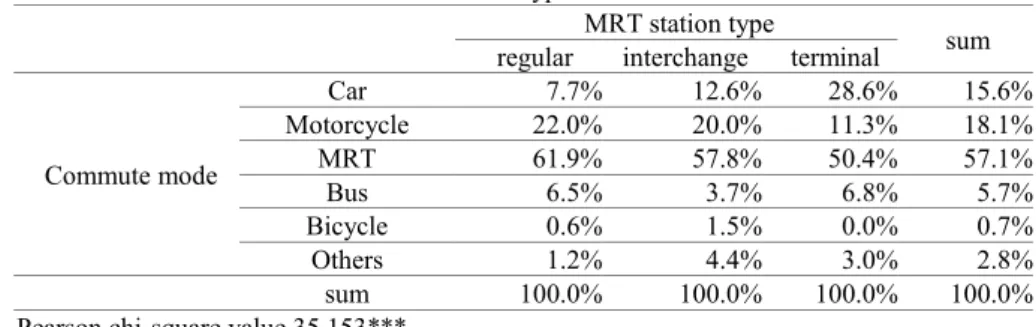
(3)The effect of MRT station type on the commute mode
As to the commute mode and the MRT station type, the result of chi-
square test is significant (chi-square value is 35.153, and P is less than 0.01),
which means the commute mode selection is significantly related to the
MRT station classification. From Table5, we can see that the samples around
the terminal station drive most, accounting for 28.6%; the samples around
the regular stations take MRT most, accounting for 61.9%. It’s inferred that
the car occupancy and the driving frequency of samples around the terminal
stations are the highest, while the car occupancy and driving frequency of
samples around regular stations are relatively lower, so they have to take
other modes for commute.
Pai and Huang 23
Table 5.Commute mode and MRT station type
MRT station type sum
regular interchange terminal
Commute mode
Car 7.7% 12.6% 28.6% 15.6%
Motorcycle 22.0% 20.0% 11.3% 18.1%
MRT 61.9% 57.8% 50.4% 57.1%
Bus 6.5% 3.7% 6.8% 5.7%
Bicycle 0.6% 1.5% 0.0% 0.7%
Others 1.2% 4.4% 3.0% 2.8%
sum 100.0% 100.0% 100.0% 100.0%
Pearson chi-square value 35.153***
5. CONCLUSIONS
(1) TJD can improve the application of mass transit and reduce the commute time and cost.
According to the field investigation, it’s found that more than a half of the residents choose MRT for commute after they moved in TJD buildings.
Based on the 2,647 households in the survey, there is at least an increase of 825 people who turn to use MRT after the moving, which helps a lot to improve the MRT usage. On the other hand, the study also investigates the reduction on commute time and cost after the residents moved in TJD buildings. The daily commute time reduces 2.6 min per head on average and the commute cost reduces NT$3 per head.
(2) TJD can reduce the car ownership and driving frequency
According to the field investigation, the car ownership of the residents reduces significantly from 58.72% to 50.2% after they moved in TJD buildings, with the reduction of 59 cars owned at least. As for the driving frequency, the residents who used to drive more than 4 days a week reduce from 125 to 62 after the moving.
(3) The MRT convenience of TJD has significant effect on the car ownership and driving frequency.
According to the analysis, the poorer the convenience of MRT is, the higher the car ownership is. In the study, samples around the terminal stations with the poorest MRT convenience own the cars accounting for 61.7%, which is higher than the samples around interchange stations (56.2%) and regular stations (36.3%). The driving frequency of the samples around the terminal stations accounts for 42.1%, which is higher than the interchange stations (37.8%) and regular stations (22%). From here we can see the significant effect of the MRT convenience on the car occupancy and driving frequency.
Due to the limit on funds and manpower, the study only chooses 9 cases as the empirical spots from the 34 TJD cases completed in 2010.
Fortunately, the results are ideal. The future studies are expected to conduct more comprehensive surveys on the TJD stations to make the results perfect.
Moreover, with the increase of the TJD stations such as 3 Rings & 3 Lines
and the Airport Line in Taipei metropolitan area, it’s necessary to add more
surveys on TJD stations for better planning strategies.
REFERENCES’
Cervero, R. and Day, J. (2008). “Suburbanization and transit-oriented development in China, Transport Policy, 15, 315–323.
Chang, Qi-de. (2007). “Driving New Metro Outlook by MRT Joint Development”, Semi- Annual Journal of MRT Technology, 36, 25-30.
Chen, S.H. (2007). “Influence of MRT Joint Development on the Local Real Estate Market”, Semi-Annual Journal of MRT Technology, 36, 171-178.
CTODRA. (2004). Capturing The Demand For Housing Near Transit, Centre for Transit Oriented Development and Reconnecting America,www.reconnectingamerica.org.
Hollie, L. (2006). “Reasons for living in a transit-oriented development, and associated transit use”, American Planning Association, 357-366.
Hong, D.Y. and Lin, Z.J. (1999). “The Influence of MRT System and Road Width on Housing price in Taipei city”, The 8th Proceeding of Chinese Housing Institute.
Li, J.N. and Lai, Z.Y. (2007). “Objective System and Strategies Construction of Mass Transit- Oriented Development in Taipei Metro Area”, Journal of Geographical Science, 48, 19- 42.
Quade, Parsons Brinkerhiff and INC. Douglas. (1996). "Transit and Urban Form," Transit Cooperative Research Program, Transportation Research Board, National Research Council, National Academy Press, Washington: D.C , Report 16.
Zhong, W.L. (1997). “Joint Development”, Taipei MRT Project Bureau.