Spatial Planning)
著者 Lei Zhang
journal or
publication title
International Review for Spatial Planning and Sustainable Development
volume 5
number 4
page range 4‑18
year 2017‑10‑15
URL http://doi.org/10.24517/00053229
doi: 10.14246/irspsd.5.4_4
Creative Commons : 表示 ‑ 非営利 ‑ 改変禁止 http://creativecommons.org/licenses/by‑nc‑nd/3.0/deed.ja
4
DOI: http://dx.doi.org/10.14246/irspsd.5.4_4
Copyright@SPSD Press from 2010, SPSD Press, Kanazawa
Different methods for the evaluation of surface water quality: The Case of the Liao River, Liaoning
Province, China
Lei Zhang
1*1 Graduate School of Global Environmental Studies, Sophia University
* Corresponding Author, Email: [email protected] Received: Dec 15, 2016; Accepted: Jan 15, 2017
Key words:
Water Quality Index, Liao River, Water Quality Management
Abstract:
The water-quality index is a grading system for presenting water-quality data and comparing water of varying quality. It can be used in water quality trend analyses and presents valuable information to policy makers, managers, and other nontechnical people. For exploring water quality and identifying the main pollution parameter in the lower reaches of Liao River, Single Factor Evaluation (SFE) method in the form of a Comprehensive Water Pollution Index (CWPI), the Nemerow-Sumitomo Water Quality Index (NWQI), and the Comprehensive Water Quality Identification Index (CWQII) method were used to evaluate water quality in lower reaches of Liao River, Liaoning province, China. The results proved that at Zhaoquan river and Wailiao river the water quality status was good, and Pangxiegou river and Qingshui river showed unsatisfactory water quality status. The major pollution indicator in lower reaches of Liao River was petroleum, and compared with the other assessment methods, CWQII was found to give more useful and objective information, and it is worth further promoting water quality inspections in lower reaches of Liao River. Finally, according to the distribution of industry in the Liao river basin, this study makes some relevant suggestions for sustainable development in the future.
INTRODUCTION
Water is a very important resource for living organisms and human society
(Huang, 2015). Without water, existence of man would be threatened
(Danquah, Abass, & Nikoi, 2011). The quality of deteriorating water has been
a growing source of concern for the international community (Gyamfi et al.,
2013). The issues of water quality have become a common challenge to many
countries (WEPA Secretariat (Institute for Global Environmental Strategies
(IGES), 2015). In order to prevent water pollution, many countries have issued
policies to address its sources, and one very significant link was the evaluation
of water environment quality (Ouyang, 2005). In recent years in Asian
countries, evaluation of surface water quality has become a critical issue (Yan
et al., 2015). According to the Outlook issued by Water Environmental
Partnership in Asia (WEPA), the evaluation methodologies applied in Asian
countries can be divided into three types (WEPA Secretariat (Institute for
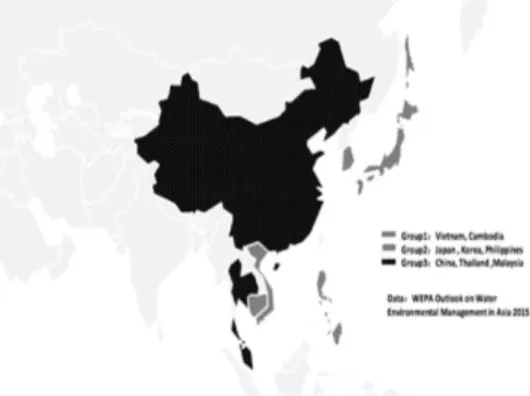
Global Environmental Strategies (IGES), 2015). The first type is the water
quality monitoring data that are directly compared to water quality standards, thus judging whether the water can be used. In Asia, this method has been used by Vietnam and Cambodia because it is simple and easy to utilize, but this is only a primary stage of water quality evaluation. The second type is used by countries like Korea, the Philippines and Japan, whose governments determine whether or not the quality of a water body satisfies the Environmental Quality Standard and is expressed as a percentage. The third type are countries like the People's Republic of China, Malaysia and the Kindom of Thailand, and involves categorizing monitoring sites based on the results of water quality testing and the sites are classified according the water quality standard.
Figure 1. Water quality evaluation methodology in Asian countries
China began to evaluate surface water quality in the 1980s. The first environmental standard of surface water quality was issued in 1983 (Wang et al., 2014). After three revisions, a new standard was formulated in 2002 (Pong, 2007). According to the National Standard of Environmental Quality, the Ministry of Environmental Protection (MEP) issued technical specification requirements for environmental quality assessment of surface water in 2004 and 2012 (The Ministry of Environmental Protection of the People's Republic of China (MEP), 2002). In these technical requirements, the Single Factor Evaluation (SFE) method was used to evaluate surface water quality.
However , because this method only considers the single most significant factor, the SFE method is limited in its ability to characterize the conditions of surface water quality (Ji, Dahlgren, & Zhang, 2016). Even when general water quality is improved, this method may not identify improvements in water quality, and cannot provide effective bases for formulating environmental protection rules and regulations (Xu, Z.-X., 2005).
Water quality evaluation is one of the basic tasks of an environmental protection administration, and researchers have designed numerous approaches for evaluating surface water quality. The comprehensive evaluation of water quality has attracted a lot of interest in recent years (Xu, S., Wang, & Hu, 2015). The pollution index method is a kind of water quality evaluation method stemming from the 1970s (Prati, Pavanello, & Pesarin, 1971), The pollution index methods include a single factor pollution index method and comprehensive pollution index method (Abbasi & Abbasi, 2012).
Liu et al. (2011) used a pollution index method to evaluate the water quality in the coastal waters of Bohai and both Chemical Oxygen Demand (COD) and phosphate were main pollution factors. However, this method cannot judge water quality class according to Chinese national standards (Yin & Xu, 2008;
Ban et al., 2014).
The Nemerow-Sumitomo Water Quality Index method (NWQI) was put
forward by Dr. Nemerow and Sumitomo in the 1970s (Nemerow, 1974). Until
now, this method was also used for water quality evaluation of underground water by China's environmental protection department (GB/T 14848-93 n.d.).
From 2015, the Guangzhou Environmental Protection Bureau started to apply the Nemerow-Sumitomo index of water quality evaluation for surface water.
In a paper by Xu, B., Lin, and Mao (2014), the single factor method and Nemerow-Sumitomo index method were used to analyze the water quality of Taihu Lake. They found that the Nemerow-Sumitomo index method was more suitable to for reflecting the comprehensive situation of water quality.
However, the overall water quality condition's classification is not identified by Nemerow-Sumitomo pollution index intuitively and cannot judge surface water quality when the water quality is worse than a class 5 (Li, Y.-S. et al., 2009; Ji, Dahlgren, & Zhang, 2016).
In addition to the methods mentioned above, there are other methods, such as the principal component analysis method (Ouyang, 2005) and the fuzzy analysis method (Gao & Jin, 2005), however these cannot be used to determine whether the composite water quality allows for the environmental functions of surface water nor to identify which water quality parameters exceed the Chinese national standards, and cannot reflect the practical situation of river water quality in China (Xu, Z.-X., 2005; Ji, Dahlgren, &
Zhang, 2016).
Xu, Z.-X. (2005) proposed a water quality identification index method in 2005. This method can be used to judge whether water polluted by a single pollutant can meet the water quality evaluation requirements of current policies, and also judges comprehensive water quality (Yan et al., 2015). Qun et al. (2009) used this method to evaluate the water quality of Dagu River and found this method can be used to evaluate water quality qualitatively and quantitatively. Hao et al. (2013) used this method to assess the water quality of Jinchuan River, Beitang River, Qingan River and Xiyandapu River in Jiangsu. The main pollution factors were Dissolved Oxygen (DO), ammonia, Chemical Oxygen Demand (COD), Biochemical Oxygen Demand (BOD5) and Total Phosphorus (TP).
This study uses 11 monitoring sites in the lower reaches of Liao River basin. To compare the advantages and disadvantages of these methods and seek a better method fit for Liao River, an SFE-based Comprehensive Water Pollution Index (CWPI) method, Nemerow-Sumitomo index method, and Comprehensive Water Quality Identification Index (CWQII) method were all used to evaluate the water quality in the lower reaches of Liao River. The results of which may be helpful for water pollution governance of Liao River.
RESEARCH AREA AND DATA SOURCE 2.1. Research Area
The research area is Liao River, an important river in the Northeast of
China (see Figure 2) (Pavlovska, 2014). Since the 1990s, Liao River has been
seriously polluted as the development of urbanization and industrialization has
grown (Wei et al., 2009). From 2005, due to the “Control Planning of Water
Pollution in Liao River” (Shao et al., 2006), the water quality in Liao River
has improved. However, compared with other rivers like Chang Jiang River
and Zhujiang River, water quality in the Liao River basin has still been poor,
especially, in its lower reaches (Li, Y. L. et al., 2012). The reason is that there
have been many pollutants in the industrial wastewater and domestic water
from the upper reaches of the basin that have accumulated in its lower reaches (Ma et al., 2015). In this study, six parameters were monitored in 11 sections (see Table 1) from 2011-2013 downstream of Liao River in Panjin City (see Figure. 3). Three methods were used to assess water quality in the lower reaches of the Liao river system in Panjin City: an SFE-based Comprehensive Water Pollution Index (CWPI) method, Nemerrow- Sumitomo Water Quality Index method (NWQI), and Comprehensive Water Quality Identification Index method (CWQII) were used.
Figure 2 . Lower Reaches of Liao River
Figure 3. Lower Reaches of Liao River
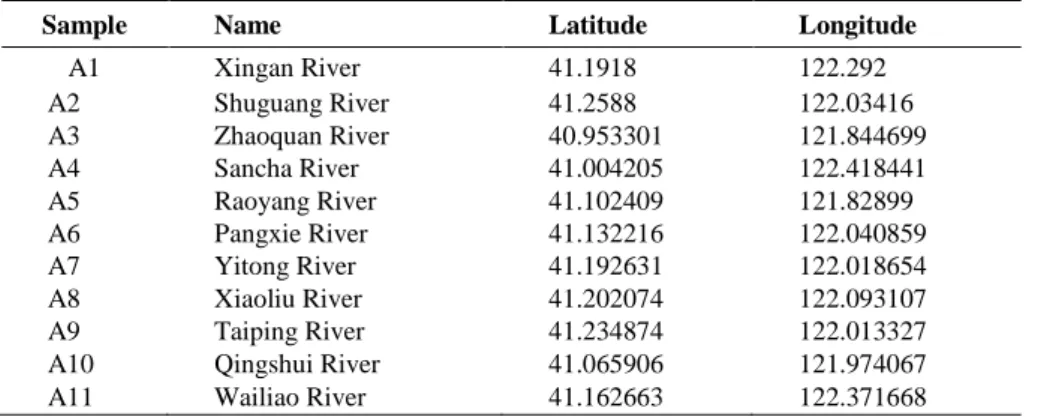
Table 1. Sampling locations of Liao River in Panjin City
Sample Name Latitude Longitude
A1 Xingan River 41.1918 122.292
A2 Shuguang River 41.2588 122.03416
A3 Zhaoquan River 40.953301 121.844699
A4 Sancha River 41.004205 122.418441
A5 Raoyang River 41.102409 121.82899
A6 Pangxie River 41.132216 122.040859
A7 Yitong River 41.192631 122.018654
A8 Xiaoliu River 41.202074 122.093107
A9 Taiping River 41.234874 122.013327
A10 Qingshui River 41.065906 121.974067
A11 Wailiao River 41.162663 122.371668
2.2. Data Source
Water quality data from 11 monitoring sites was collected between 2011 and 2013 from the Liao River basin. The municipal environmental department of local government’s water quality parameters include COD, petroleum, BOD5, ammonia nitrogen, Total Phosphorus and the Permanganate Index.
According to the goals of the ’Water Pollution Prevention Action Plan’
proposed by China, the proportion of Class 3 water available should be higher than 70%. So this paper adopted the Class 3 criteria as the preferred water quality standard.
METHODS AND MATERIALS
For water quality evaluation, the SFE method is used according to the maximum membership class's principle (Ji, Dahlgren, & Zhang, 2016). This determines that if only one parameter exceeds the standard, all functions of the water body will be lost. The formula for the SFA method is:
𝐹𝐹 = 𝐹𝐹
𝑎𝑎𝑚𝑚𝑚𝑚𝑚𝑚
F is the class of surface water, which is classified into classes 1 to (see Table 2). The value of the Surface Water Standard Concentration (The Ministry of Environmental Protection of the People's Republic of China (MEP), 2002) for each of the five classes is shown in Table 3. 𝐹𝐹
𝑎𝑎is the class of parameter a and 𝐹𝐹
𝑎𝑎𝑚𝑚𝑚𝑚𝑚𝑚 is the maximum class for all of the parameters (from classes 1 to 5).
Table 2. Water Environmental Quality Standard GB3838-MEP
Class I – Mainly applicable to the national nature reserves.Class II – Mainly applicable to class A water source protection area for centralized drinking water.
Class III – Mainly applicable to a water source protection area
Class IV – Mainly applicable to water bodies for industrial water supply in which there is not direct human contact with the water.
Class V – Mainly applicable to agricultural water supply and landscape requirements.
Class V+ - Essentially unusable.
Data from: China’s Ministry of Environmental Protection (MEP)
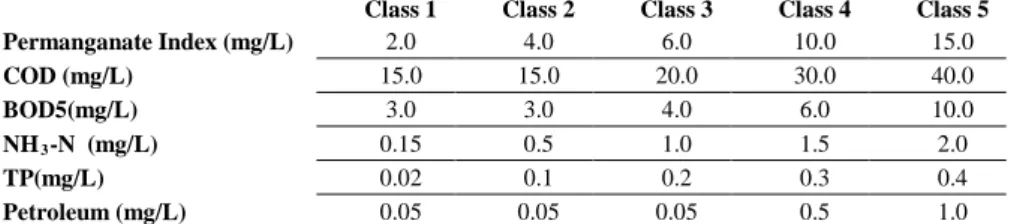
Table 3. Value of Surface Water Quality Standard Concentration in China (mg/L)
Class 1 Class 2 Class 3 Class 4 Class 5
Permanganate Index (mg/L) 2.0 4.0 6.0 10.0 15.0
COD (mg/L) 15.0 15.0 20.0 30.0 40.0
BOD5(mg/L) 3.0 3.0 4.0 6.0 10.0
NH3-N (mg/L) 0.15 0.5 1.0 1.5 2.0
TP(mg/L) 0.02 0.1 0.2 0.3 0.4
Petroleum (mg/L) 0.05 0.05 0.05 0.5 1.0
Data from: China’s Ministry of Environmental Protection (MEP)
3.1. Comprehensive Water Pollution Index ( CWPI )
The Single Factor Evaluation (SFE) method is used to create a Comprehensive Water Pollution Index (CWPI). The SFE (excluding DO) increases with the pollutant’s concentration, and its equation is as follows:
𝐼𝐼
𝑎𝑎= 𝐶𝐶
𝑎𝑎𝑆𝑆
𝑜𝑜𝑎𝑎where the pollution index of water quality index a, 𝐶𝐶
𝑎𝑎(mg/L), was the measured concentration of water quality index a, and 𝑆𝑆
𝑜𝑜𝑎𝑎(mg/L) was the concentration limit of water quality index a.
𝑭𝑭
𝒄𝒄𝒄𝒄𝒄𝒄referred to the arithmetic mean of n water quality indexes. The
equation was as follows:
𝐹𝐹
𝑐𝑐𝑐𝑐𝑐𝑐= 1 𝑛𝑛 � 𝐼𝐼
a𝑛𝑛
n=1
n is the number of selected pollutants. In this research n=6.
3.2. Nemerow-Sumitomo Water Quality Index (NWQI)
The Nemerow-Sumitomo Water Quality Index (NWQI) is a weighted-type water quality index (excluding DO) which takes into account the average and maximum, and its calculation formula is as follows.
𝐹𝐹
𝑛𝑛𝑛𝑛𝑛𝑛𝑐𝑐= � max (𝐼𝐼
𝑎𝑎)
2+ 𝑚𝑚𝑎𝑎𝑎𝑎(𝐼𝐼
𝑎𝑎)
22
𝒂𝒂𝒂𝒂𝒂𝒂(𝑰𝑰
𝒄𝒄) = 𝟏𝟏 𝒏𝒏 � 𝑰𝑰
𝒂𝒂𝒏𝒏
𝒄𝒄=𝟏𝟏
3.3. Comprehensive Water Quality Identification Index (CWQII)
As a relatively new method, the CWQII could be used to evaluate the water quality of surface water. The Single Factor Identification Index (SFII) is a basic part of the CWQII, and its equation was as follows (excludes DO).
𝑷𝑷
𝑺𝑺𝑭𝑭𝑰𝑰= 𝑷𝑷
𝟏𝟏𝑷𝑷
𝟐𝟐Where 𝑃𝑃
1is between 1 and 5, corresponding to its water quality, from Class 1 to 5.
When the index was not the index for dissolved oxygen (DO), the equation was as follows.
𝑷𝑷
𝟐𝟐= 𝑪𝑪
𝒂𝒂− 𝑺𝑺
𝒂𝒂𝒂𝒂𝑺𝑺
𝒂𝒂𝒂𝒂𝒂𝒂𝒂𝒂𝒂𝒂− 𝑺𝑺
𝒂𝒂𝒂𝒂𝒂𝒂𝒄𝒄𝒏𝒏∗ 10
C
ais the concentration of the ath water quality index, and S
abmaxand S
abminare the upper limit and lower limit of the concentration interval of Class b water in the ath index, respectively. The equation is as follows:
𝑷𝑷
𝑪𝑪=P
1P
2P
3P
4𝑷𝑷𝟏𝟏𝑷𝑷𝟐𝟐 = 𝟏𝟏
𝟔𝟔 �𝑷𝑷
𝑪𝑪𝑪𝑪𝑪𝑪𝒂𝒂𝒏𝒏+ 𝑷𝑷
𝑩𝑩𝑪𝑪𝑪𝑪𝟓𝟓+ 𝑷𝑷
𝑵𝑵𝑵𝑵𝑵𝑵−𝑵𝑵+ 𝑷𝑷
𝑻𝑻𝒄𝒄+ 𝑷𝑷
𝑝𝑝𝑝𝑝𝑝𝑝𝑝𝑝𝑝𝑝𝑝𝑝𝑝𝑝𝑝𝑝𝑚𝑚+ 𝟏𝟏 𝒏𝒏 � 𝑷𝑷
𝒂𝒂𝒏𝒏 𝒂𝒂=𝟏𝟏
� 𝑷𝑷
𝑪𝑪𝑪𝑪𝑪𝑪𝒂𝒂𝒏𝒏, 𝑷𝑷
𝑩𝑩𝑪𝑪𝑪𝑪𝟓𝟓, 𝑷𝑷
𝑵𝑵𝑵𝑵𝑵𝑵−𝑵𝑵and 𝑷𝑷
𝑻𝑻𝒄𝒄are the 𝑃𝑃
𝑆𝑆𝑆𝑆𝑆𝑆of COD, BOD5, NH
3-N and TP. a refers to other indexes incorporated in the comprehensive water quality evaluation.
P
awas the single factor identification index. P
3refers to the number of
water quality indexes that were worse than the water quality for functional
areas in the urban water environment. If P
3=0, the indexes incorporated in the
evaluation all meet the water quality standard for functional areas. If P
3=1,
one index does not achieve the functional area standard. If P
3=2, two indexes
do not meet the standard, and so on. P
4was used to judge whether the
comprehensive water quality was worse than that of water in a functional area.
If the comprehensive water quality was better than that in a functional area, P
4=0. If the water quality exceeded the standards, then:
P
4= P
1-f
aWhere f
arefers to the water quality category for water in functional areas of the urban water environment. If P
4=1, the water quality is one level higher than the standard. If P
4=2, the water quality is two levels higher than the standard.
RESULTS AND DISCUSSION
4.1. Descriptive Statistics of the Water Quality
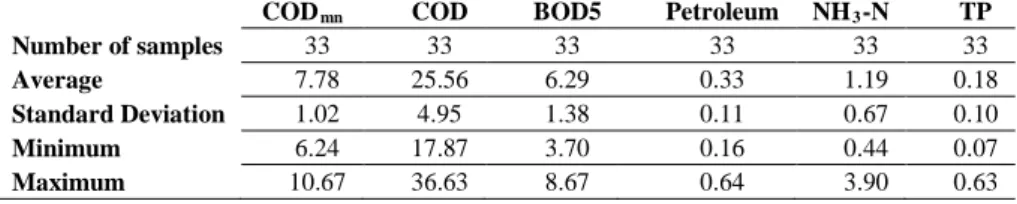
The descriptive statistics of the water quality are shown in Table 4 below.
The average concentration of COD
mn, COD, BOD5, Petrtoleum, NH
3-N and TP were 7.78 (Class 4), 25.56 (Class 4), 6.29 (Class 5), 0.33 (Class 4), 1.19 (Class 4) and 0.18 (Class 3), respectively. For COD
mn, 97% of the samples were Class 3 and only 3% exceeded Class 4 (Class 5), The lowest concentration of COD
mnwas 6.24 mg/L and the highest was 10.67mg/L. COD was worse than COD
mn, only 15% of the samples were Class 3 and 70% were Class 4, while 15% had Class 5 water quality standards. The lowest was 17.87mg/L and the highest was 36.63mg/L. For BOD5, 3% of the samples were Class 3, 49% were Class 4 and 48% were Class 5 water quality standards.
The lowest concentration of BOD5 was 3.70mg/L and the highest was 8.67mg/L. For Petroleum, 0% of the samples were Class 3, 97% were Class 4 and 3% were Class 5. The lowest concentration of Petroleum was 0.16mg/L and the highest was 0.64mg/L. For NH
3-N, 49% of the samples were Class 3, 27% were Class 4 and 15% were Class 5. 9% were worse than Class 5. The lowest concentration of NH
3-N was 0.44 mg/L and the highest was 3.90mg/L.
For TP, 3% of the samples were Class 1, 79% were Class 2, and 18% were Class 3. The lowest concentration of TP was 0.07mg/L and the highest was 0.63mg/L.
Table 4. Descriptive statistics for six parameters (mg/L)
CODmn COD BOD5 Petroleum NH3-N TP
Number of samples 33 33 33 33 33 33
Average 7.78 25.56 6.29 0.33 1.19 0.18
Standard Deviation 1.02 4.95 1.38 0.11 0.67 0.10
Minimum 6.24 17.87 3.70 0.16 0.44 0.07
Maximum 10.67 36.63 8.67 0.64 3.90 0.63
4.2. Single Factor Evaluation (SFE) Method
Depending on the results of the SFE method (Figure 4), the level of water
quality is determined by the worst index. All rivers in the Liao River basin
were inferior, Class 4, and the worst water quality was found in the SanCha
River (A4) in both 2012 and 2013, and Pangxiegou River (A6) in 2012. The
water quality was worse than Class 5 because the surface water quality
standard for the concentration of NH
3-N was Class 5. In addition, the
concentration of TP was Class 5 in Pangxiegou River (A6) in 2011. However,
this method only considered the most prominent factor (NH
3-N) and other
factors were weakened, not all factors were considered in the result of water
quality evaluation.
Figure 4. Single Factor Evaluation (SFE) method results
4.3. Comprehensive Water Pollution Index (CWPI) Method
Results of the Comprehensive Water Pollution Index (CWPI) are shown in Figure 5 below. These results show the period between 2011-2013. The comprehensive water quality in Pangxiegou River (A6) was the worst, however, according to the CWPI of Pangxiegou River (A6), the level of pollution lightened to a certain extent from 2011-2013 (the CWPI was 2.373, 1.803 and 1.482 in 2011, 2012 and 2013, respectively). The CWPI in Zhao Quan River (A3) was best, and in 2013 the CWPI of Zhao Quan River was 0.851.
Figure 5. Comprehensive Water Pollution Index (CWPI)
Although the CWPI provides a comprehensive water quality status, this
method could not determine the water quality classes according to the surface
water environment standards. Moreover, because in the CWPI method all
factors have the same contribution to the overall water quality, this method cannot reflect a genuine decrease of water quality.
4.4. Nemerow-Sumitomo Water Quality Index (NWQI) Method
Figure 6. Nemerow-Sumitomo Water Quality Index
Figure 7. The correlation between Nmax and NWQI
The results of the NWQI are shown in Figure 6. Based on the results, the water quality index of YiTong River (A7) in 2011 was the worst and the water quality of Zhao Quan River in 2013 was the best (NWQI was under 1.0).
Compared with the SFE and CWPI, the maximum and average factor
contributions of all factors are considered in the NWQI. From the correlation
seen between the maximum factor and Nemerow-Sumitomo Index in Figure
7, it can be seen that this method tends to overemphasize the influence of the maximum evaluation factor (N
max). When one factor is much higher than the others, the NWQI will be increased. Like the CWPI, this method could not determine the water quality classes according to the surface water environment standards.
4.5. Comprehensive Water Quality Identification Index (CWQII) Method
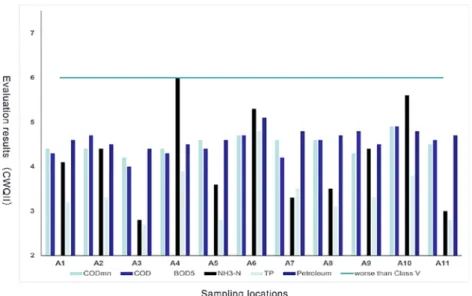
Figure 8. The result of water quality assessment using CWQII on Liao River in 2011.
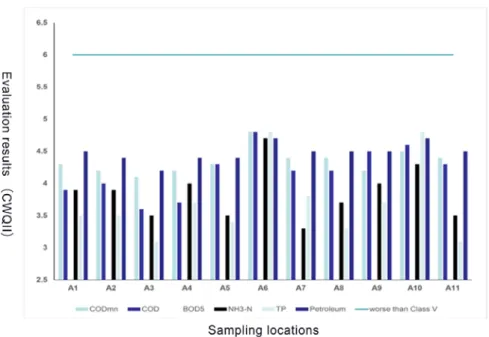
Figure 9. The result of water quality assessment using CWQII on Liao River in 2012.
The water quality classification for each factor was determined according to
the CWQII method. The results are shown in Figures 8-10. Like for the SFE
method, NH
3-N in the SanCha River in 2011 and 2012 and in the Pangxiegou
River (A6) in 2012 were Class 5 pollutants, as was the TP of Pangxiegou River in
2011. The CWQII of Petroleum and BOD5 showed Petroleum and organics
contamination in Liao River and its tributaries. For Petroleum, the lowest
concentration of was 0.16mg/L and the highest was 0.64mg/L, three times and 12.8 times Class 3, respectively.
Figure 10. The result of water quality assessment using CWQII on Liao River in 2013.
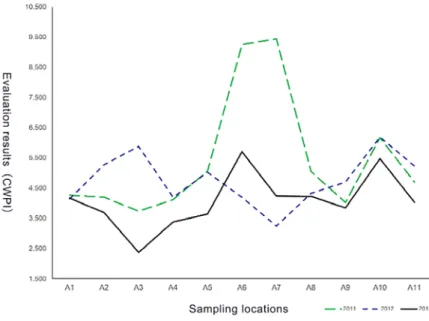
Figure 11. The results of CWQII from 2011-2013.
According to the results of the water quality evaluation by using the
CWQII method, the comprehensive water quality of the Zhaoquan River was
the best and was the worst for Pangxiegou River (Figure 11). Pangxiegou
River was the most polluted water body of Panjin City, where water quality
was affected by industrial and domestic sewage. Zhaoquan River is located in
the Wetlands Reserve of Liaoning province's delta area and local government
have taken a series of important measures to protect the water quality of the
wetlands, like creating the Wetland Protection Plan of PanJin City.
Year to year variation from 2011-2013 is shown in Figure 12. From 2011- 2013, except for Shuguang River in 2011-2012, the water quality improved in all sections. Pangxiegou River, Yitong River (2011-2012) and Sancha River (2012-2013) showed significant improvement (13.4% 14.4% and 14.7%, respectively). It means that the government has done something useful to protect the environment. However, in order to achieve the environmental targets of the ’Water Pollution Prevention Action Plan’ by 2020, petroleum and COD5 controls need be improved.
Figure 12. Comprehensive water quality change from 2011-2012 and 2012-2013.
Table 5. Comparison of different methods for the evaluation of surface water quality Considers a
group of factors instead of using the worst evaluation factor
Compares single and
comprehensive water qualities within the same class
Assesses the comprehensive water quality qualitatively and quantitatively Single Factor Evaluation
(SFE) Method
✕ ✕ ✕Comprehensive Water Pollution Index (CWPI) Method
✓ ✕ ✕
Nemerow-Sumitomo Water Quality
Index (NWQI) Method
✓ ✓ ✕
Comprehensive Water Quality Identification Index (CWQII) Method
✓ ✓ ✓