Acta Med. Nagasaki 26 : 56-72
An Ultrastructural and Stereological Study on Lipid Droplets of Adrenal Cortex of Rats Fed with High-fat,
Low-protein and Cholesterol Supplements
*Hidetaka MATSUKUMA
Second Department of Pathology, Nagasaki University School of Medicine, Nagasaki, Japan
Received for publication, July 25, 1981
In order to know the morphological change of the early phase of lipid formation in adrenocortical cells, the adrenal cortex of rats which were fed with high-fat, low-protein and cholesterol supplements was ultrastructurally observed with stereological analysis of lipid droplets in each zone. The amount and spherical size distribution of lipid droplets of the adrenal cortex were stable within 24 hours of experiment contrasting to the liver of the same experimental rats which was previously observed that lipid droplets accumulated in the hepatocytes on and after 6 hours of experiment. This fact suggests the possibility that
the amount of adrenocortical lipid droplets is stable under the hepatic regulation of cholesterol metabolism. And, also, each zone of the adrenal cortex was characterized by the amount and spherical size distribution of lipid droplets.
INTRODUCTION
The adrenal cortex is ultrastructurally characterized by the abundant smooth-surfac- ed endoplasmic reticulum, almost spherical mitochondria crowded with tubular cristae and large lipid droplets in common with features of most steroid-secreting cells. In the former two, i.e. smooth-surfaced endoplasmic reticulum and mitochondria, various steroidogenic enzymes are located. However, no steroidogenic enzymes are reported in the lipid droplets which are biochemically complicated mixture of neutral fat, fatty acid, cholesterol and their derivatives. Lipid droplets are dissolved by the use of lipid solvent in dehydration procedure in the routine electron microscopic preparation, therefore, the biochemical steps of steroidogenesis is unable to be followed ultrastructurally and details of the steroidogenic processes have been ascertained mainely by the biochemical methods.
The knowledges of ultrastructural observation in lipid droplets are very few in contrast to many enzymological or ultrastructural studies of smooth-surfaced endoplasmic reticulum
*松 隈 秀 峻
and mitochondria. Especially, the histogenesis of the lipid droplets has not been clarifyed.
The observations in this study were focused for the early phase in formation of lipid droplets and attempted to analyze the lipid droplets quantitatively by the stereological methods with computer aid.
It is well known that the relative amount of lipid droplets varies with the change of adrenal function. Also, the amount of lipid droplets is affected by cholesterol-fat feeding. Adrenal cholesterol is a precursor of adrenocortical hormones 12), and blood-borne cholesterol of hepatic or dietary origin can play a major precursor in rats28). Several authors') 1o)22)29 have observed the morphological or biochemical changes of adrenal cortex by intake of cholesterol. Their experiments of cholesterol feeding extended over a long period of time, and showed an increase in demonstrable lipid, cholesterol contents or enlargement of the size of adrenocortical cells. But, a few ultrastructural features of lipid droplets have been analyzed quantitatively.
MATERIALS AND METHODS
Animals. Seventy-five male Wistar rats weighing 70 to 180 g (mean 114 g) were used. Rats were divided into three groups. The first group, as control group consisting of 25 rats, was fed ad libitum a standard food stock diet (Oriental Yeast Co, Tokyo).
The second and third group, as experimental group consisting of respectively the same number of rats, were fed a high-fat, low-protein and cholesterol supplemented diet.
Diets and Feeding. The composition of these experimental diets was followed Ashworth et a121. The diet consists of corn starch, 38% ; minerals*, 6% ; alpha-wheat meal, 10% ; powder of filter paper, 8%; granulated sugar, 5% ; and vitamin mixture**, 2% by weight. The above composition was common with three groups. Furthermore, in the control group, vitamin-free casein, 25% ; lard as fat, 6% ; without cholesterol supple- ment diet was employed. The second group received vitamin-free casein, 15%; lard, 15.5% ; and cholesterol supplement, 5% ; in the third group, 15% ; 15% ; and 1% respec- tively. Each five rats of each group were sacrificed at 3, 6, 12, 18 and 24 hours after the start of the feeding.
*Each 100 g of the minerals supplemented ; K , 745.6 mg ; P, 612.5 mg ; Ca, 411.1 mg ; Na, 290.7 mg ; Mg, 80.6 mg ; Fe, 35.2 mg ; Zn, 3.0 mg ; Mn,
2.5 mg; I, 0.5 mg; Cu, 0.5 mg.
**Each 100 g of the vitamin mixture contained vitamin A , 1,000 IU; vitamin D3 200 IU ; vitamin B1, 2.4 mg ; vitamin B2, 8.0 mg ; vitamin B6, 1.6 mg ; vitamin
B12, 0.001 mg ; vitamin C, 60.0 mg ; vitamin E, 10.0 mg ; vitamin K3, 10.4
mg ; Biotin, 0.04 mg : Folic acid, 0.4 mg ; Ca-pantotenate, 10.0 mg ; paraami
nobutyric acid, 10.0 mg ; Niacin, 12.0 mg ; Inocitol, 12.0 mg and choline-Cl,
400 mg.
Electron microscopy. At the time of killing rats were, under ether anesthesia, perfused through abdominal aorta with a 1.4% solution of glutaraldehyde in phosphate
buffer for 20 minutes. After removal the adrenal glands were postfixed with a 1.0%
osmium tetroxide solution in a phosphate buffer, dehydrated by passage through an increasing concentration of acetone, and embedded in Epon 812. Semi-thin sections were cut from all blocks and stained with toluidine-blue to verify the zonation of the adrenal cortex. Ultrathin sections were cut on Poter-Blum MT-2 ultramicrotome, contrasted with uranyl acetate and lead citrate23) and observed under the JEM-7A electron microscopy (JEOL, Tokyo). Micrographs were taken at a magnification of X3,000 from each zone of all sections and enlarged photographically to x9,000.
Zonal discrimination of the adrenal cortex. The adrenal cortex is consist of three major zones. Identification of this zonation is the basic problem in quantitative method S25) . The zona glomerulosa is easily identified on semithin epon sections stained with toluidine- blue. This zone is close to the capsule and lipid droplets of this zone are seen clear vacuoles by this staining. The zona fasciculata consists of 30 to 40 layers of cells. This zone is sub-divided even into outer and inner layers by the difference of lipid distribution
between the outer and inner layers. Lipid droplets are more abundant in the outer layer than in the inner layer. The zona reticularis comprises the cells in network in 6 to 10 layers and close to adrenal medulla. But a precise differentiation between the inner layer of the zona fasciculata and the zona reticularis is difficult. Furthermore, zonal discrimi- nation was based on the ultrastructural features of the cells of each zone.
Stereological procedure. For the purpose of knowing the relative volume of lipid droplets to cytoplasm and spherical size distribution of lipid droplets, electron micrographs with final magnification of x9,000 were quantitatively analized as followings. On these randomly sampled electron micrographs of adrenocortical cells in each zone of each group, the area of the each sliced lipid droplets and of cytoplasm were measured by a modular system for semiautomatic quantitative evaluation of images (MOP-AMO3, Kontron Mes- sgrate GMBH, West Germany). The relative volume of lipid droplets to cytoplasm was obtained from the relative area of sliced lipid droplets to cut-surface of cytoplasm on electron micrographs by MOP-system and computer according to the Delesse's principle3)7>
that volumetric composition is equivalent to the planimetric density of profiles on random sections. Also, the frequency distribution of the area of the lipid droplets which was obtained by MOP-system and computer was transformed into three-dimensional frequency distribution of spherical diameter of the lipid droplets based upon the Saltykov's principle",) with computer aid 16) . The distribution of the number of lipid droplets per unit volume
is
a
~;u(k,i)N6(i)/2Ar
i=k
where Na(i) is the frequency of the sliced lipid droplets belonging to ri(=iAr , k`i<l) of the radius of the cut surface, 5(k, i) is Saltykov's coefficient .
RESULTS (1) Ultrastructural observation
In conclusion, there were no significantly qualitative differences between the control group and two experimental groups with respect to the ultrastructural features.
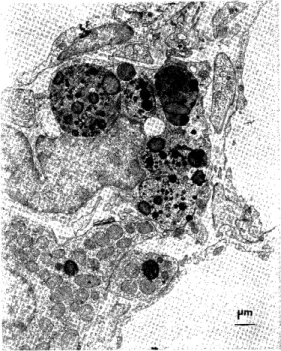
Zona glomerulosa. The lipid droplets were homogenous with low electron density in the central or most portion and with osmiophilic rim in the peripheral portion of the lipid droplets (Fig. 1). The interface of the lipid droplet and cytoplasm was relatively marked, although sometimes the interface without electron-dense rim was unclear. No remarkable membranous materials were observed. Sometimes, the lipid droplets were surrounded by smooth-surfaced endoplasmic reticulum in tubular appearance. Occasionally, there was a tendency of lipid droplets to agglutinate. Then, the boundary with each other of lipid droplets was disappeared (Fig. 1) or was defined by a single layer of membranous structure. No continuation or transformation of lipid droplets into smooth- surfaced endoplasmic reticulum or mitochondria was discernible. The vague and small deposition of lipid droplets were observed at all points (Fig. 3). In the vicinity of these vague and small lipid droplets, a few of smooth-surfaced endoplasmic reticulum were seen.
Some lipid droplets with a large diameter which were close to the cytoplasmic membrane bulged it, these lipid droplets fused with the cytoplasmic membrane, and opened into subendothelial space, at which the cytoplasmic membrane was scalloped (Fig. 1). The mitochondria, which were relatively few, varied in shape from round to elongated and had tubular cristae and dense mitochondrial matrix (Fig. 2). Myelin figures derived from outer membrane of the mitochondria had a tendency to protrude in the mitochondria-lipid droplet interface. The conglutination of mitochondria with lipid droplets followed by vanishing of outer membrane of the mitochondria. The smooth-surfaced endoplasmic reticulum were scattered as intracytoplasmic small vesicules. Some of them were metamor- phosed into tubular sacs and arranged in a single layer at short distance from each other surrounding a large lipid droplets (Fig. 3).
Outer zona fasciculata. The number of lipid droplets was varied from cell to cell , and also varied according to the intracytoplasmic portion. The lipid droplets with high electron density were observed as well as those with low electron density (Fig . 4). When lipid droplets were small and a few, they showed a tendency to have high electron density . Some of large lipid droplets showed a crack-like appearance (Fig . 5) or associated with irregularly woven membranous structures or with lamellated or concentrically arranged stacks (Fig. 5, Inset). The lipid droplets with these additional features were often admixed with glycogen particles (Fig. 6) . Some of the lamellated stacks abutted on mitochondria of which the external membrane was disappeared . The mitochondria were more numerous, which had a round shape and were tightly packed with vesicular cristae . Rarely, intramitochondrial granules, which were homogenous electron-dense materials
, were observed. It seemed that the number of mitochondria was inverse ratio to the number of lipid droplets, as Rhodin24) remarked. The smooth-surfaced endoplasmic reticulum
,
Fig 1. The adrenocortical cell of the zona glomerulosa in the control rat. The lipid
droplets (L) with osmiophilic rim in the
periphery have low electron density. The cytoplasmic membrane shows scalloped
shape (asterisk).
Fig 2. General appearance of the zona glome- rulosa in the control rat. The lipid
droplets are crowded. The mitochondria
are relatively few and vary in shape.
Myelin figure is observed (arrow).
Fig 3. The zona glomerulosa of the second group (6 hours). The smooth-surfaced endopla-
smic reticulum are arranged in a single
layer surrounding a lipid droplet (arrows) .
The vague and small deposition of lipid
droplet (SL) is observed.
Fig 4. The outer zona fasciculata of control rat.
The lipid droplets with high electron
density are observed as well as those
with low electron density.
Fig 5. The outer zona fasciculata of the control rat. Some of large lipid droplets showed
a crack-like appearance or associated
with concentrically lamellated stacks
(inset).
Fig 6. The outer zona fasciculata of the third group (24 hours). The lipid droplets
with irregularly woven membranous stru-
ctures are admixed with glycogen par-
ticles (arrows).
Fig 7. The inner zona fasciculata of the second group (3 hours). The lipid droplets are
varied in size and number. A crystal-
shaped, angular body (arrows) appears
in this layer.
Fig 8. The inner zona fasciculata of the second group (24 hours). Aggregation of par-
ticulate glycogen (Gly) and lysosome
(Ly) are observed.
Fig 9. The zona reticularis of the third group (6 hours). The numerous mitochondria
posses the tubular or vesicular cristae.
Intramitochondrial granules (arrows)
are more frequently observed.
Fig 10. The zona reticularis of the second group (24 hours). A histiocyte is located in
a subendothelial space and contains big
lipofuscin pigments.
which had the same appearance as those in the zona glomerulosa, were more numerous.
Additionally, aggregation of particulate glycogen was observed especially close to the cracked or partially lamellated lipid droplets. The lysosomes were near the cytoplasmic surface with microvilli in the subendothelial space.
Inner zona fasciculata. The lipid droplets were varied in size and number. The additional features of the lipid droplets, i. e. a crack-like appearance, woven membranous lamellated or concentrically arranged stacks, were observed as well as the outer zona fasciculata. A crystal-shaped, angular body appeared in this layer (Fig. 7). Aggregation of particulate glycogen and lysosomes were more observed (Fig. 8).
Zona reticularis. The lipid droplets were a few and varied in size (Fig. 9). The density of them was moderate or high. All lipid droplets of this zone were closely topo- graphical relation to smooth-surfaced endoplasmic reticulum. The numerous mitochondria possessed the tubular or vesicular cristae. Intramitochondrial granules were more frequently observed (Fig. 9). The continuation of the mitochondria to lipid droplet was also found.
The smooth-surfaced endoplasmic reticulum were most abundant in this zone. The ultrastructural features of the parenchymal cells were also characterized by a large amount of particulate glycogen, lysosome, polyribosomes and peroxisomes. In this zone, histiocytes were located in a subendothelial space near the adrenal medulla. They contained big lipofuscin pigments (Fig. 10).
(2) Stereological analysis of lipid droplets.
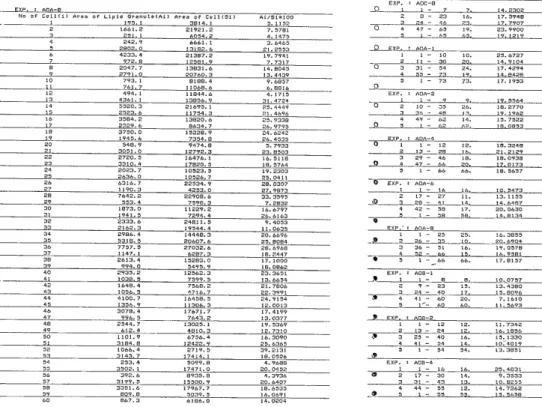
Relative volume of lipid droplets to cytoplasm. A part of the list of relative area of lipid droplets to cytoplasm on electron micrographs is shown in Fig. 11. Fig. 12 shows the time traversing of relative volume of lipid droplets to cytoplasm. No significant alteration with the course of time was observed respect to the amount of lipid droplets, and also no significant difference of the amount between the control group and two experimental groups was observed. The difference of the relative volumetric composition of lipid droplets in cytoplasm among each zone is able to be recognized irrespective the difference of the experimental regimens. It is to say that the relative volumetric composi- tion of lipid droplets to cytoplasm is 26.88L2.75, 17.78±1.80, 11.97-h2.78 and 13.34±
2.88,°0 in zona glomerulosa, outer zona fasciculata, inner zona fasciculata and zona reti- cularis, respectively, where ± signs denote the weighted standard deviation for each time interval in the control group.
The spherical size distribution of the lipid droplets. The spherical size distribution of lipid droplets is shown in Fig. 13, 14 and 15 in form of % ratio for the whole frac- tions. That size ditribution of each zone in the control group is shown in Fig. 13. In the zona glomerulosa, major peaks were presented from approximately 1.0 to 2.0 pm.
Each distribution curve which compose the major peaks is bimodial or trimodial. In the
_EXP qOA-8
No of Cell(i) Area of Lipitl GranulelAi> Area of Ce... ) Ai/Si+t100
1 195.1 3814.1 5.1152
1661.2 21921.2 7.5781
3 ^31 1 6054.2 4 1475 _
4 242
.9 6661.1 3.6465
3 2802.0 1'3182 6 ^1 ^553
6 4233.4 21387.2 19.7941
7 972.8 12581 9 7.7317
B 2047.7 13631.6 14.8045
9 2791.0 20760.3 13.4439
30 793.1 8188.4 9.6857
11 761.7 11068.6 6.8816 _
12 494.1 11844.6 4.1715
13 4361.1 13856 9 31 4724
14 5520.3 21695. 1 25.4449
15 2523.6 11754 3 21:4696
16 3584.2 13820.6 25.9338
17 2329.6 8634.7 26.9795
16 3750.0 15228.9 24.6242
19 1945.6 7354.8 26.4535 _
20 548.9 9474.8 5.7933
21 3051.0 12792 3 23 8503
22 2720.5 16476.1 16.5118
23 3310.4 17820.5 18.5764
24 2023.7 10523.5 19.2303
25 2636.0 10526.7 25 0411
26 6316.7 22534.9 28.0307
27 1190.3 4253:0 27:9B73
_
28 7642.2 22909.6 33.3595
29 553.4 7598.3 7.2832
30 1873,0 11229.2 16.6797
31 1941.5 7294.4 26.6163
32 2333.6 24811.5 9.4053
33 2162.3 19544 4 11 0635
34 2986.4 14448.3 20.6696
35 5318.5 20607.6 25.8064
36 7757.9 27032.6 28.6968
37 1147.1 6287.3 18. 447
38 2613.4 15283.0 17.1000
39 994.0 5495.9 10.0962
40 2935.2 12562.3 23.3651
41 1038.5 7599:5 13.6654
42 1648.4 7568.2 217806
43 1056.5 4716.7 2.3991 _
44 4100
.7 16458.5 24.9154
45 3356.9 I1306.3 12 0013
46 3076.4 17671.7 17.4199
47 996.5 7643.2 13.0377
48 2544.7 13025.1 19.5369
49 612.4 4810.3 12.7310
50 1101.9 6756.4 16.3090
51 3184.8 12422.9 25.6365
52 1066.4 2719.5 39.2131
53 3143.7 17414.1 18.0526 _
54 253.4 5099.8 4.9688
55 3502.1 17471.0 20.0452
56 392.6 8935.8 4.3936
57 3199.5 15900.9 20.6407
58 3351.6 17967.7 18.6535
59 809.8 5039.5 16.0691
60 867.3 6186.0 14.0204
EXP. : AOC-8
Q 1 1 7 7 14 ^30^
O - 23 16. 17.3948
3 ?4 - 46 23, 17.7907
O
4 47 - 65 19. 23. 9YD0
5 I -_65 G5. 19.1219 _
O EXXP : AOA-1
1 1 - 30 10. 25.6727
_ O 2 I1 - 30 20. 14.9104 _
3 31 - 54 24. 17.4294
4 55 - 73 19. 14.8428
5 1 - 73 13. 17.3953
n
EXP. AOA-2
I 1 - 9 9, 19.5564
2 10 - 35 26. 18.2770
3 36 - 48 13. 19.1962
4 49 - 62 14. 19.7522
O 5 1 - 62 62. 18.0853
EXP. AOA-4
O 1 1 - 12 12. 18.3248
2 13=28 16. 21.2129
3 29 - 46 18. 18.0938
0 4 47 - 66 2O 17,0173
3 1 - 66 66. 18.5657
0 EXP. : AOA-6
1 1 - 16 16. 10.5473
2 17 - 27 11. 13.1155
l4 3 28 - 41 14, 14.6487
4 42 - 58 17. 20.0630
5 1 - 58 5©. 14.81 _34 d
EXP.' AOA-3
1 1 - 25 25, 16.3855
O 2.6 - 35 10. 20.6904
3 36 - 51 16. 19.0578
4 52 - 66 15. 16.9381
5 1 - 66 66. 17.8157
EXP. AOB-1
1 1 - 8 _8-10.0737
2 9 - 23 15. 13.4380
3 24 - 40 17. 15.8096
4 41 - 60 20. 7.1610
5 1- 60 60. 11.5693
EXP. : A08-2
1 1 - 12 12. 11.7342
2 13 - 24 12. 16.1896
l~ 3 23 - 40 16. 15.1330
4 41 - 54 14. 10.4019
3 1 - 54 54. 13.3851
EXP. AOB-4
1 1 - 16 16. 29.4831
2 17 - 30 14. 9.3533
3 31 - 43 13. 10.8255
4 44 - 59 12. 14.7262
Q 5 1 - 55 55. 15.5638
Fig 11. (Left) An example of the list of the input of relative area of the sliced lipid droplets to cytoplasm in each cell on electron micrographs. (Right) An example
of the output of the mean relative area in each rat.
Interval of feeding (hours) Interval of feeding(hours)
Interval of feeding(hours) Interval of feeding (hours) Fig 12. Time traversing of relative volume of lipid droplets to cytoplasm after feeding.
Where, abscissa is interval of feeding, ordinate is relative volume of lipid droplets
to cytoplasm. 0: control group rats. A: the second group (cholesterol 0.5%)
rats. 0: the third group (cholesterol 1.0%) rats.
outer zona fasciculata and inner zona fasciculata, the lipid droplets were distributed from 0.5 to 4.8 um. However, the former had the single peak with sharpness at approximately 1.0 to 1.2 um, and the latter had the same compound peaks as the former but associated with larger varieties of small peaks. In the zona reticularis, the main peaks presented from 0.8 to 1.2 um, and the larger varieties of diameter were conspicuous. The spherical size distributions of the second group (0.5% cholesterol) and the third group (1.0%
cholesterol) were shown in Fig. 14 and 15 respectively. The two experimentally feeding groups showed the same distribution pattern of the spherical diameter of lipid droplets as the control group. Additionally, the characteristics of distribution of lipid droplets in each zone shows in these figures as followings. Zona glomerulosa has moderate variation of diameter of lipid droplets. In outer zona fasciculata, diameter of them mostly converges on narrow range. Lipid droplets of inner zona fasciculata associate with larger varieties of small peaks of diameter. Zona reticularis has wide variation of diameter of lipid
droplets.
Spherical diameter (pm) Spherical diameter (,um)
Spherical diameter (um) Spherical diameter (,um)
Fig 13. Spherical size histogram of lipid droplets in the control group. Where, abscissa and ordinate are diameter lipid droplets and relative frequency respectively.
Spherical diameter (,um) Spherical diameter (pm)
Spherical diameter (,um) Spherical diameter (UM)
Fig 14. Spherical size histogram of lipid droplets in the second group. Where, abscissa and ordinate are diameter of lipid droplets and relative frequency respectively.
Spherical diameter (PM) Spherical diameter (,um)
Spherical diameter (Mm) Spherical diameter (PM) Fig 15. Spherical size histogram of lipid droplets in the third group. Where, abscissa and
ordinate are diameter of lipid droplets and relative frequency respectively.
DISCUSSION
Generally, it has been considered that the adrenal cortex of rats is influenced by choelsterol-fat feeding. BERNICK et al4l. observed the effect of cholesterol-fat feeding in the duration of three days to five months on morphology of selected endocrine glands of rats. They demonstrated histochemically an increased lipid content in the adrenal cortex by prolonged feeding of cholesterol-fat diet to rats, and when the animals were removed from this diet and replaced on the natural stock diet for six weeks, there was a loss of the sudanophilic droplets and the adrenal glands showed normal lipid distribution. They concluded from these results that the adrenal cortex of rats was influenced by cholesterol- fat feeding. FORBES et all'). gave cholesterol without vehicle of fat as the dietary additive to rabbits for periods from 10 to 16 weeks. Adrenal weight was approximately double, but the number of cortical cells was not significanly altered by feeding with cholesterol.
The main effect of cholesterol administration occured in the zona fasciculata which the cells enlarged and had very clear cytoplasm. Administration of ACTH for 9 days induced enlargement of the adrenal gland similar in magnitude to that seen after feeding with cholesterol, but. rabbits that had previously received the cholesterol diet showed no change in their responsiveness to injection of ACTH. They concluded that adrenal enlargement caused by feeding with cholesterol is not due to increased secretion of ACTH and that cholesterol absorved from the gut might well act directly on the adrenal cortex. WEXLER29) reported that the introduction of a high fat diet at an early age inhibited development of hypertension in spontaneously hypertensive rats (SHR). According to his experiments, in SHR fed with the high fat diet after weaning, despite severe hyperlipiemia, hyperglycemia and adequate corticosterone levels, zona glomerulosa of the adrenal cortex was completely depleted of lipid. He suggested that the high fat diet caused hypopituitarism followed inhibition of development of hypertension.
On the other hand, OSTWALD221 analyzed adrenal lipid which were separated into cholesterol ester, triglycerides and phospholipids of guinea pigs and rats fed with contain- ing 1% cholesterol for 45 to 60 days. Cholesterol feeding had no significant effect on the total lipid level of adrenals in either species, although the tendency of an increase in total lipids in female rats only was observed. Also, cholesterol feeding had no effect on the size of adrenals, although guinea pig adrenals were enlarged by such regimen.
Besides the observaion of adrenals in the present study, the change of the liver in the same rats was reported previously"). Electron microscopically, fat droplets accumulated in a glycogen area of hepatocytes on and after 6 hours of experiment. Neutral lipid was demonstrated histochemically on and after 12 hours. In the present study, the total volume of lipid droplets in adrenal cortex was unchanged within 24 hours. CHRISTIAN et al. 6), as a model for Wolman's disease and cholesteryl ester storage disease, fed guinea pigs with a diet containing 10% cottonseal oil with 1% cholesterol for 2 to 11 weeks. The weights of liver and adrenals were higher in the group of animals fed with fat only than in the group of animals fed with cholesterol-fat. Biochemically, determination of free cholesterol, total cholesterol, cholesteryl ester, triglyceride and phospholipids in liver was carried out.
They showed that there was a great accumulation of lipid in the guinea pig liver and that cholesterol ester accounted for most of this increase. They considered that the great accumulation in livers of guinea pigs with overloading of cholesterol could be regarded as a reasonable way of handling the enormous amount of cholesterol stored in the body. In the present study, any quantitative alteration of lipid droplets was not detected within 24 hours in contraindication of the change of liver as mentioned above. The discrepancy in lipid accumulation in the adrenal cortex and liver also suggests the role of the liver in regula- tion of cholesterol mobilization or stability of the amount of adrenocortical lipid droplets.
It has been shown that even a mild dietary defiency of protein disturbes the en- docrine balance". ENWONWU et al". fed rats with a diet of low-protein (0.5% lac- toalbumin) for 12 weeks. The ultrastructural change of the adrenal cortex in protein- deficient rats was the marked increase in number of lipid droplets. MUNROI7) con- sidered that ultrastructural changes observed in the adrenal cortex of protein-calorie- dificient rats might result from the effect of the diet on the pituitary gland. However, it is difficult to account simultaneously for the reciprocal relation between the effect o f the low-protein diet on the pituitary-adrenal axis and the effect of hyposynthesis of lipoprotein due to protein deficiency on the hepato-adrenal axis. Recently, it has been known that circulating lipoprotein have a role of supplying cholesterol to adrenal cortex 1)9). In the adrenal cortex, regulation of sterol synthesis is carried out mainly by HDL (high density lipoprotein)'). However, the further dynamic analysis of lipoprotein in relation to cholesterol metabolism in the adrenal cortex and liver is necessary.
In regard to the morphogenesis of lipid droplets in adrenal cortex, YAMORI et a130) remarked the close interelationships between lipid droplets and mitochondria. They classified lipid droplets into four groups according to shape, size and electron density, and considered three possibilities of mechanism of lipid droplet formation. The first
was the initial formation of lipid droplets which occur inside the mitochondria by accu- mulation of lipid substance. The second was the possibility of a deposition of lipid in vacuoles which were thought to be produced by cystic protrusion of mitochondrial mem- branes. The third was the possibility of formation of in vacuoles derived from mito- chondria themselves. YOSHIMURA et al.311 observed two kinds of lipid droplets in the rat adrenals ; one of smooth-surfaced endoplasmic reticulum origin and the other one of mitochondria) origin. The former lipid droplets were exclusively round in shape which were considered as products of degeneration. The latter were mostly irregular which increased in number when cellular function was inhibited. In the present study, no definite findings of the formation of lipid droplets were detected. The larger lipid droplets had the topographically close interrelationships with smooth-surfaced endoplas- mic reticulum and mitochondria. However, some vague and small deposition of lipid droplets had not any interrelationships with smooth-surfaced endoplasmic and mitochon- dria as shown in Fig. 3. These lipid droplets may suggests three possibilities. The first is the possibility that they are the initial forms of the larger lipid droplets. They might not participate in steroidogenesis, as they does not associate with smooth-surfaced endoplasmic reticulum and mitochondria. The second is the possibility that they are the tangential sections of the larger lipid droplets. The third is the possibility of the im- mature products. It is unable to conclude which is the most probable among these three possibilities, because the morphological quantity of lipid droplets in this study is stable irrespective experimentally feeding.
The zona glomerulosa of the adrenal cortex of both control and experimental groups in this study had so numerous lipid droplets. Therefore, the clear separation of the zona glomerulosa from the zona fasciculata was easy on light microscopic level.
The stereological data on the intracellular organelles of the adrenal cortex have been reported by some authors'1 13)19)20)21)25) . In the zona glomerulosa of normal rats, the re- lative volume of lipid droplets to cytoplasm was, in previous reports, 7.9%25) , 6 9%13) , 6-10 %21) or 16 %19) which were obtained according to Delesse's principle'). In the present study, it was 26.88±2.75% which were much more higher than the data in the previous studies. The cause of the discrepancies between the present data and previous data is unknown.
The influence of the processes for preparation and sampling methods requires further examination. In the zona faciculata, which was not subdivided into the outer and inner layers in the previous reports, 8.3%11)25), 23%13), 10-15%21) or 27%19) of the cytoplasmic volume was the relative volume of lipid droplets. These data are ap- proximate to those of the outer or inner zona faciculata in the present study. In the zona reticularis, previous report25) on the relative volume of lipid droplets was 8.7 %.
NICKERSON20) studied on the zona reticularis of aging SHR and Wistar-Kyoto rats (WKY). Relative volume of lipid droplets was approximately 13 % and 19 % respec- tively. Large lipid droplets were often observed in the zona reticularis of both control and experimental groups in this study. This appearance might disturb random sampling
and cause the scattering of the present data as the result. Also, the difference of . spe- cies, strain and age should be considered especially in the zona reticularis.
In this study, each zone was characterized by the spherical size distribution o f lipid droplets, and the size distribution was independent upon the experimental feeding within 24 hours. The changing of size of lipid droplets in some experimental condition have been reported by several authors 11)14)15)18) . Previous reports on the size of lipid droplets were not represented quantitatively. In hyperfunctional state of the adrenal cortex, the size of lipid droplets is smaller 14), on the contrary, hypofunctional adrenal cortex has larger lipid droplets"). The small-sized lipid droplets may be adventageous to quick steroidogenesis on occasion of stress. These small lipid droplets with even size concentrated in the outer zona fasciculata. This fact might denote the possibility of functional zonation of rat adrenal cortex. The further stereological analysis of lipid droplets under the various pathophysiologic condition is required for morphological as- sesing of the adrenal cortex.
ACKNOWLEDGEMENT
The author greatefully acknowledge Professor. H. TSUCHIYAMA and Associate Professor. K. KAWAT, Department of Pathology in Nagasaki University for their sug- gestive and valuable criticism and encouragements. The author would like to express his gratitude to Associate Professor. K. BABA, Department of Pathology and Surgical Pathology in University of Occupational and Environmental Health for his obliging gui- dance in stereological manners. The skilful and kind assistance in the statistical treat- ment of Mr. K. KIMURA, M. Sc., Laboratory of Medical Science, School of Medi- cine Dokkyo University, is acknowledged.
REFERENCES
1) ANDERSEN, J. M. and DIETSCHY, J. M.: Regulation of sterol synthesis in 15 tissues of rat. J. Biol. Chem. 252: 3652-3659, 1977.
2) ASHWORTH, C. T., SANDERS, E. and ARNOLD, B. S.: Hepatic lipid. Arch. Path.
72: 625-636, 1961.
3) BABA, K., KIMURA, K., OKAYASU, S., KIMURA, S. and KANZAKI, Y.: Morpho- metry( fl ), Stereology irrespective of shape of objects. The Cell 9: 68-78, 1977.
4) BERNICK, S. and PATEK, P. R.: Effect of cholesterol feeding on morphology of selected endocrine glands. Arch. Path. 72, 321-330, 1961.
5) BRANSOME, E. D. Jr.: Adrenal cortex. Annual Rev. of Cytology 30: 71-212, 1968.
6) CHRISTIAN, A. D. and HOVIG, T.: The effects of cholesterol/fat feeding on lipid levels and morphological structures in liver, kidney and spleen in guinea pigs. Acta
Path. Mcirobiol. Scand. Sect. A, 85: 1-18, 1977.
7) DELESSE, M. A.: Pour determiner la composition des roches. Ann. des Mines(l'J) 13: 379-389, 1848. cited by 3).