Micro Computed Tomography and Micro X-ray Fluorescence as Tools for the Curation and Scientific Study of Apollo Samples. R. A. Zeigler1, N. V. Almeida2, D. Sykes3, C. L.
Smith2,1NASA Johnson Space Center, 2101 NASA Parkway, Mail Code XI2, Houston, TX 77058, [email protected]. 2Department of Earth Sciences, Natural History Museum, London. 3Imaging and Analysis Center, Natural History Museum, London.
Introduction: From 1969 to 1972, astronauts from six Apollo missions landed on the surface of the Moon and collected 382 kg of rocks, soils, and cores (2196 samples in total). Despite the fact that scien- tists began studying the Apollo samples nearly 50 years ago, new discoveries about how the Moon formed and evolved are still being made. In order to more fully understand the history of the Moon,
“new” samples are needed in order to test the hy- potheses raised by recent studies: (1) new FAN and Mg-suite samples to test the age of formation of the Moon and the timing of magma ocean crystallization;
(2) new evolved lithologies to better understand the timing and mechanism by which tertiary crust forms on the Moon; (3) new igneous samples to better un- derstand the volatile budget on the Moon; and (4) new igneous samples to better constrain the timing and intensity of the lunar dynamo. There are no
“new” large samples within the Apollo collection that remain unstudied. There are a great many large polymict breccias within the Apollo collection that contain lithic clasts of igneous rocks, however. These polymict breccia clasts will be able to address the scientific questions listed above (and innumerable other questions). The issue then becomes how to find and characterize lithic clasts within polymict Apollo breccias without doing undue damage to the samples and without contaminating the samples. The answer to this problem is to use micro computed tomography (micro-CT) and micro x-ray fluorescence (mi- cro-XRF) to map the interiors and exteriors of Apollo polymict breccias.
Methodology: Micro-CT measurements are made by projecting a cone of high energy x-rays through a sample and measuring the attenuation of those x-rays on a CCD detector. This gives a 2D view of the x-ray attenuation within a sample. The sample is then rotated by a fraction of a degree and a new 2D x-ary attenuation snapshot taken. Computer software is then used to combine the many 2D snap- shots taken over a full 360 degree rotation into a 3 dimensional view of the rock. Micro-CT measure- ments have the sensitivity to distinguish most of the major rock forming minerals found in Apollo sam- ples. Given the high energy nature of the x-rays in- volved, samples can be scanned triply bagged in Teflon to preserve their pristine nature. The samples shown in this work were scanned on the Nikon HMX ST 225 System at the Natural History Museum in London. Scans were made at 205-220 kV, 135-160
A beam current, with an effective voxel size of 21-44 microns. Bench top micro-XRF instruments use high energy x-rays to induce fluorescence in the near surface of a sample. They can rapidly scan large
areas (~100 cm2) with a small pixel size (~25 um) and measure the semi-quantitative composition of largely unprepared surfaces for all elements between
Figure 1 (left): (a) Macroscopic image of 14305,483 slab. Area in parts b + c outlined in orange. Field of view is 10 cm wide. (b) X-ray RGB composite image of the surface of 14305,483. K = red, Al = green, Si = blue. White arrows denote pits in the sample. (c) X-ray RGB composite image of the surface of 14305,483. Ca
= red, Mg = green, Fe = blue.
Be and U, often with sensitivity on the order of a
~100 ppm. The micro-XRF scans were made on an EDAX Orbis PC micro-XRF at Washington Univer- sity. Samples were scanned without a protective bag using an accelerating voltage of 45 kV, a beam cur- rent of 800 A, and a beam diameter of 30 m.
Results: To date, we have made micro-CT scans of 10 different Apollo samples. This includes numerous polymict breccias (all regolith breccias unless otherwise noted): 14305,483 (155 g);
14321,1404 (346 g); 15205,0 (136 g); 15405,0 (im- pact-melt breccia; 201 g); and 60639,0 (153 g). The scans have been able to identify lithic and mineral clasts within each breccia. Of particular note is a mid-Ti basalt clast identified within the main mass of 60639 (Fig. 1). This clast was identified previously [1], however the exact size and weight of the clast was unknown. Additionally, many interesting lithic clasts have been identified within the scans of 14321, a breccia known to contain numerous important lithic clasts [2]. In addition to the polymict breccias, sever- al igneous samples were scanned as well (all basalts unless otherwise noted): 10057,19 (132 g);
15555,1039 (66 g); 15556,215 (354 g); 70017,72 (127 g); and 60015,180 (anorthosite, 122 g). The textures of these igneous samples can be seen in the scans, and the volume/distribution of vesicles within the samples is also apparent. Micro-XRF scans were made of sample 14305,483 (Fig. 2). The scans were
done on unbagged sample, however (Teflon absorbs low energy fluorescent x-rays). The scans give the major element composition of numerous clasts on the sawn surface of the breccia. In particular, two areas rich in K and Si were found, suggesting that these are
“new” evolved lithic clasts.
Discussion: For polymict Apollo breccias, mi- cro-CT analyses allow the entire clast population of relatively large samples (up to ~15-20 cm) to be mapped in a few hours. Although definitive identifi- cation of lithologies based solely on micro-CT anal- ysis is not always possible, by combining the mi- cro-CT technique with a more quantitative technique like micro-XRF, definitive lithic clast identification is possible. The micro-CT scans can be used to de- termine where to subdivide a large sample, and then these new clasts made available to scientists for more detailed study. Although this study concentrates on Apollo samples, these techniques are equally valid for use on meteorites. In fact, previous studies have already shown the efficacy of micro-CT work on meteorites [3-5]. This technique is likely to be used on future sample return missions, e.g., OSIRIS-Rex.
References: [1] Delano J. W. (1975) PLSC, vol. 6, 15-47.
[2] Shervais J. W. et al. (1984) Breccia Guidebook No.7 14321. JSC 19492 [3] Keubler K. E. et al. (1999). Icarus 141: 96-106. [4] Almeida N. V. et al. (2014) MAPS 77:
abstract #5033. [5] Smith C. L. (2013) MAPS 76, abstract
#5323.
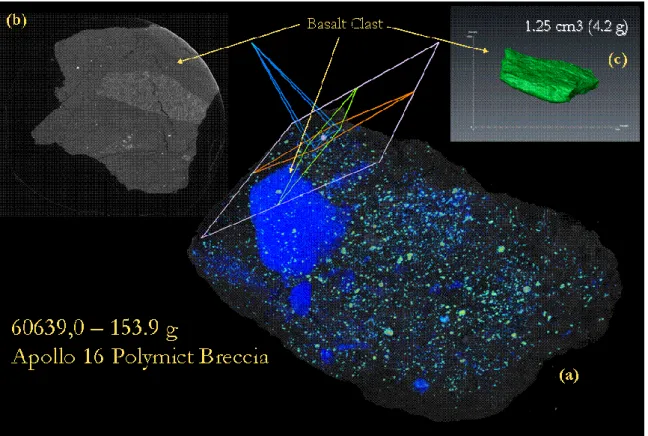
Figure 2: (a) A 3-dimensional view of a micro-CT scan of the main mass of Apollo 16 polymict breccia 60639. The colors within the scan correspond to materials high x-ray attenuation values, and highlight lithic and mineral clasts rich in Fe-bearing minerals (e.g., pyroxene, olivine, ilmenite). The blue clasts are basalt clasts within the breccia.
The whole sample is ~8 cm in the longest dimension. (b) A view of a single cross-sectional slice through the image in (a). Brighter phases are more Fe-rich, similar to a back-scattered electron image. The sub-ophitic texture of the basalt clast is apparent at this scale (c) An isolated view of the largest basalt clast within 60639,0.