Scientific Note
A high-precision continuous measurement system for the atmospheric O
2/N
2ratio at Ny-Ålesund, Svalbard and preliminary observational results
Daisuke Goto1, 2*, Shinji Morimoto1, 3, Shuji Aoki2 and Takakiyo Nakazawa2
スバールバル諸島ニーオルスンにおける大気中
O2/N2比観測のために開発された
高精度連続測定システムと初期観測結果
後藤大輔1, 2*・森本真司1, 3・青木周司2・中澤高清2 (Received January 15, 2013; Accepted January 16, 2013)要旨: スバールバル諸島ニーオルスンにおける大気中O2/N2比の時間変動を明 らかにするため,±4.0 per meg以内の精度で連続測定できるシステムを新たに開 発した.観測サイトが遠隔地にあることを考慮し,① インターネットを利用して 日本からシステムを起動・停止できる,② システムから出力されるデータはイン ターネットを介して日本で監視・取得できる,③ スターリングクーラーを利用し た大気試料の除湿装置を開発し,水トラップの保守を自動化する,④ CO2濃度も 同時に測定できる,⑤ 標準ガスや参照ガスのシリンダーを交換することなく1年 間の連続測定を可能にするといった点に特に注意を払った.このシステムを用い た系統的観測を2012年11月8日に開始した.観測開始後の1カ月間に取得したデー タを解析することによって,本システムの有効性を明らかにするとともに,観測 された特徴的なO2/N2比の時間変動について原因を考察した.
Abstract: With the aim of carrying out detailed monitoring of temporal variations in the atmospheric O2/N2 ratio at Ny-Ålesund, Svalbard, we have developed a new high- precision continuous measurement system, with a precision of better than ±4.0 per meg, using a fuel-cell O2 analyzer. Considering the remoteness of the observation site, special attention was paid to the measurement system, in that: (1) the system can be controlled remotely from Japan using the Internet; (2) all of the data output from the system can be monitored and collected in Japan via the Internet; (3) a specially designed water trap based on a Stirling cooler is employed to automate the removal of water vapor from the sample air; (4) the CO2 concentration can also be measured; and (5) it is possible to operate the system for one year without having to manually replace the high-pressure cylinders of standard gas and reference air. Systematic observation of the atmospheric O2/N2 ratio using the newly developed measurement system began at the site on November 8, 2012. By
1 情報・システム研究機構国立極地研究所.National Institute of Polar Research, Research Organization of Information and Systems, Midori-cho 10–3, Tachikawa, Tokyo 190-8518.
2 東北大学大学院理学研究科大気海洋変動観測研究センター.Center for Atmospheric and Oceanic Studies, Graduate School of Science, Tohoku University, Aramaki, Aoba-ku, Sendai 980-8578.
3 総合研究大学院大学複合科学研究科極域科学専攻.Department of Polar Science, School of Multidisciplinary Sciences, The Graduate University for Advanced Studies (SOKENDAI), Midori-cho 10-3, Tachikawa, Tokyo 190-8518.
* Corresponding author. E-mail: [email protected] 南極資料,Vol. 57,No. 1,17-27,2013
Nankyoku Shiryo^ (Antarctic Record), Vol. 57, No. 1, 17-27, 2013
Ⓒ 2013 National Institute of Polar Research
analyzing the observational results obtained over the first month, the effectiveness of the measurement system was verified, and the causes of characteristic temporal variations in the observed atmospheric O2/N2 ratio were examined.
1. Introduction
The atmospheric O2 concentration is commonly expressed as a deviation in the O2/N2
ratio relative to an arbitrary reference (Keeling and Shertz, 1992):
δ(O2/N2)=[(O2/N2)sample/(O2/N2)reference-1]×106(per meg). (1) As O2 only accounts for 20.946 % of air, 4.8 per meg of δ (O2/N2) corresponds to a change of 1 ppm in the O2 concentration (mole fraction). Simultaneous observations of atmospheric δ (O2/N2) and CO2 provide valuable information regarding the global carbon cycle. For example, data from long-term monitoring of these parameters allows us to estimate land biotic and oceanic CO2 sinks separately (e.g., Ishidoya et al., 2012a, 2012b; Manning and Keeling, 2006). In an attempt to develop a better understanding of the global carbon cycle in terms of atmospheric O2, several laboratories have employed various methods to construct high-precision measurement systems for atmospheric δ (O2/N2), and have conducted simultaneous observations of atmospheric δ (O2/N2) and CO2 concentration using discrete flask sampling with subsequent laboratory analysis (Battle et al., 2006; Bender et al., 2005; Ishidoya et al., 2006, 2008a, 2008b, 2012a, 2012b; Keeling and Sherzts, 1992;
Langenfelds et al., 1999; Manning and Keeling, 2006; Tohjima et al., 2005, 2008). More recently, continuous measurement systems have also been developed (Goto et al., 2013;
Manning et al., 1999; Stephens et al., 2003, 2007; Yamagishi et al., 2008). Using these systems, systematic observations of atmospheric δ (O2/N2) and CO2 concentration have been carried out at fixed ground stations (Goto et al., 2013; van der Laan-Luijkx et al., 2010;
Lueker, 2004; Stephens et al., 2007; Yamagishi et al., 2008), as well as on board ships (Thompson et al., 2008; Yamagishi et al., 2012) and aircraft (Stephens et al., 2009).
However, there have been very few simultaneous observations of atmospheric δ (O2/N2) and CO2 concentration in the polar regions due to the difficulties of site access (Bender et al., 2005; Ishidoya et al., 2012b; Keeling and Sherzts, 1992; Manning and Keeling, 2006), and continuous observation of atmospheric δ (O2/N2) has yet to be carried out in the Arctic.
To facilitate the first continuous measurements of atmospheric δ (O2/N2) in the Arctic, we have developed a new, high-precision measurement system based on a fuel-cell O2
analyzer, which is also equipped with a non-dispersive infrared (NDIR) CO2 analyzer. Using this system, we initiated systematic and continuous observations of atmospheric δ (O2/N2) at Ny-Ålesund (78°55′N, 11°56′E), Svalbard in November 2012. In this paper, we describe the newly developed measurement system, and present our results from the first month of monitoring at the site to demonstrate the effectiveness of the measurement system.
Characteristic temporal variations in atmospheric δ (O2/N2) during this period are also examined.
2. Experimental methods
The new measurement system was installed in a laboratory at the Japanese observatory at Ny-Ålesund, Svalbard (Fig. 1). Ny-Ålesund is a small science town located in a tundra mountain valley, and the Japanese observatory is situated about 2 km WNW of the town center. Since the prevailing wind direction at Ny-Ålesund is ESE, the influence of the town on the observatory is usually insignificant. The monthly mean air temperature is -14℃ in February, but increases to +5℃ in July.
To minimize the influence of changes in ambient temperature, the measurement system was placed in a small space surrounded by vinyl sheets within the laboratory. Figure 2 is a schematic diagram of the measurement system. We used a differential fuel-cell O2 analyzer (Sable Systems International, Oxzilla II) and an NDIR (LiCOR, LI-6252) for the measurements of atmospheric O2 and CO2, respectively. The O2 analyzer has two symmetrical flow paths of air, and each path is equipped with a fuel-cell detector. The net reaction
O2+2 Pb+4H+ → 2H2O+2 Pb2+, (R1) takes place in the fuel cell, which produces an electric current that is linearly proportional to the partial pressure of O2 in the air passing through it. The O2 analyzer continuously measures the difference in output between the two fuel cells. The fundamental design of our continuous measurement system is essentially the same as that of Goto et al. (2013), but several aspects were completely redesigned for use at this remote site, as described below.
Two water traps (T1 and T2) are attached in parallel to the sample air line, with each trap being a U-shaped stainless steel tube with an outer diameter of 1/2 inch. The air inlet consists of a Dekabon tube with an outer diameter of 4 mm and a cylindrical stainless steel protector, one end of which is closed, and the Dekabon tube is inserted into the protector through the closed end. The air inlet was set at a height of 6 m on the western roof of our
Fig. 1. Location of Ny-Ålesund (78°55′N, 11°56′E), Svalbard.
observatory to face the prevailing winds, and the sample air is drawn through the Dekabon tube and into the laboratory using a diaphragm pump. The sampled air is then initially introduced into a 1 l stainless steel buffer volume. By controlling a flow regulation valve, situated at the outlet of the buffer volume, with the signal from a pressure sensor located downstream from the water traps, the inside pressure of one water trap, which is cooled to
-80℃ using a Stirling cooler (TWINBIRD Corp., SC-UE15R), is maintained at 0.1 MPa.
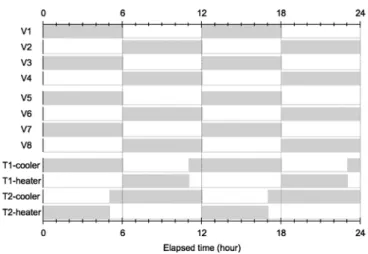
The excess air is discharged at about 2 l/min into the room through the other trap. This trap is heated to 50℃ using a sheet heater wound around its inlet and outlet to remove water remained in the trap. Part of the air flowing through the buffer volume is taken as sample air, and is introduced into the measurement system at a flow rate of 80 ml/min through a stainless steel tube with an outer diameter of 1/8 inch, after removing water vapor by passing it through the trap cooled to -80℃. These two airflows are switched every six hours by controlling solenoid valves V1–V8 (Fig. 2), to change the functions of the two traps; i.e., the opened valves with odd numbers and the closed valves with even numbers are closed and opened, respectively, and the cooled T1 trap and the heated T2 trap are heated and cooled, respectively. As shown in Fig. 3, the system is programmed so that the heating of the trap to be used next is stopped, and its cooling commences, one hour before the flows of air are switched, to cool the trap to -80℃ in advance. In addition, the solenoid valve V9 is also opened for one hour before the flows of air are switched to prevent the introduction of wet air into the pre-cooled trap. This drying system for the sample air makes it possible to operate our O2 measurement system over a long period without the need to manually replace the trap.
It is crucial for the precise measurement of atmospheric δ (O2/N2) that the air pressure in the fuel cells is stabilized. To achieve this, a precise differential pressure gauge is set
Fig. 2. Schematic diagram of the newly developed continuous measurement system for the atmospheric O2 /N2 ratio and CO2 concentration.
between each outlet of the O2 analyzer and a pressure reference volume filled with air at 20 kPa, and a flow regulation valve located at the inlet of the analyzer is controlled by using its signal to minimize pressure differences between the air in the reference volume and the air in the flow path (Goto et al., 2013). When the measurement system is shut down or started up, it is necessary to depressurize or pressurize the reference volume. In our system, by controlling the solenoid valve (Ve or Vf) via the Internet from Japan, the reference volume can be pressurized or depressurized. This functionality is extremely useful, and allows the remote control of our measurement system.
The output data from the O2 and CO2 analyzers are recorded onto the hard disk of an in situ system control/management personal computer, and also collected in Japan via the Internet. To confirm the condition of the system, the inside and outside temperatures of the O2 analyzer, the room temperature, the flow rate of each gas, pressure fluctuations in each flow path of the O2 analyzer, and the inside pressure of the reference volume can be monitored in Japan. We also used a web camera to monitor the system in Japan.
A large amount of reference air is required to operate the O2 measurement system for a long period, because the reference air always flows through one fuel cell at a rate of 80 ml/
min. In our system, six 48 l high-pressure cylinders filled with the reference air are used to allow the measurement of atmospheric δ (O2/N2) for one year without the need to manually exchange the cylinders. Three of the six cylinders are connected to one port of an automatic changeover valve, and the remainder to the other port. If the pressure in one port of the changeover valve falls below 1.0 MPa, the flow is automatically switched to the other port.
As mentioned below, by testing the combination of the reference air cylinders with different values of δ (O2/N2), we found that the cylinders to be connected to the same port should contain air with similar values. If reference air with significantly different δ (O2/N2) values are connected to one port, the δ (O2/N2) value of the mixed air is highly variable, which leads to unstable observed values of atmospheric δ (O2/N2).
Fig. 3. Operation timing of solenoid valves (V1⊖V8 in Fig. 2), and the coolers and heaters (around T1 or T2 in Fig. 2) of the sample-air dryer. Gray areas indicate that the solenoid valves are opened and the cooler or heater is activated.
As our measurement procedures, as well as the standard gases and their preparation, have been described in detail elsewhere (Goto et al., 2013), only a brief description is presented here. High and low standard gases, and dried sample air, are introduced into one flow path of the O2 analyzer in order, while the reference air always flows through the other path. To compensate for the different output drifts of the two fuel cells, the two flow paths are alternately switched every three minutes using a six-port valve, and the difference between the output signals before and after the switching is read as a measure of the partial pressure difference of O2 between the sample air (or the standard gas) and the reference air.
To calibrate the O2 analyzer, the high and low standard gases are introduced every hour into the analyzer, each gas flowing for six minutes with the alternation of the flow paths occurring three minutes after introduction. The high and low standard gases, calibrated against our primary standard, are chosen so that the atmospheric δ (O2/N2) to be measured falls between their values. The δ (O2/N2) value of the sample air is determined from the analyzer outputs of the sample and standard gases, assuming a linear relationship between the analyzer output and the δ (O2/N2) value. The analytical precision of our O2 measurement system was estimated to be ±1.4–1.9 per meg by analyzing the same air repeatedly in the air-conditioned laboratory.
As mentioned above, our measurement system is equipped with an NDIR. Its sample cell is connected to one outlet of the O2 analyzer by a stainless steel tube. Therefore, the high standard gas, the reference air, the low standard gas, and the reference air are introduced into the sample cell for three minutes in sequence, and subsequently the sample air, and then the reference air flow through the cell. The high and low standard gases also include the different amounts of CO2, so that each gas acts as a CO2 standard gas. The analytical precision of the CO2 concentration is ±0.03–0.05 ppm. The measured values of the CO2 concentration are temporally interpolated linearly to estimate the corresponding value at the time when δ (O2/N2) is measured.
3. Preliminary results
Hourly mean values of atmospheric δ (O2/N2) and CO2 concentration obtained from continuous observations at Ny-Ålesund between November 8 and December 8, 2012 are shown in Fig. 4 a) and b). The standard deviations (1 σ) of the hourly δ (O2/N2) means are also shown in the figure. As mentioned in section 2, the analytical precision of our measurement system was estimated to be ±1.4–1.9 per meg for δ (O2/N2). However, Fig. 4 a) shows that the standard deviation is around 3–5 per meg for the period November 27–
December 8, when small fluctuations of δ (O2/N2) were observed with an average of 4.0±
1.4 per meg. Such a decrease in analytical precision is probably due to the fact that our laboratory at Ny-Ålesund is not completely air-conditioned, so that the room temperature is relatively easily affected by the low and variable outside air temperatures. This problem is likely to be lessened during the warm season, when it is expected that the standard deviation will decrease. Periods with standard deviations larger than 5.0 per meg are also occasionally seen in Fig. 4. For example, standard deviations of about 15 and 10 per meg are seen on November 9 and November 22–25, respectively. These large standard deviations were generated in association with the meteorological conditions at the observation site. The air
temperature at Ny-Ålesund, the room temperature, and the standard deviation of the hourly mean inside temperatures of the O2 analyzer are shown in Fig. 4 c), d), and e), respectively.
By comparing the standard deviations of δ (O2/N2) with the results shown in these figures, it is thought that the fuel-cell output is strongly affected by the inside temperature of the analyzer, which is correlated with the room and air temperatures. The inside temperature of the O2 analyzer tends to be unstable when the room temperature is lowered to approximately 15℃, while the inside temperature is stable within ±0.02℃ when the room temperature varies around 20℃. As mentioned above, our measurement system is situated in a space surrounded by vinyl sheets to minimize the influence of changes in the room temperature, and there is also a panel heater in the laboratory. These preliminary results strongly suggest that further stabilization of the room temperature is needed. Therefore, we intend to install another heater as soon as possible to enable us to conduct high-precision measurements of atmospheric δ (O2/N2) at all times.
Extraordinarily large standard deviations of over 30 per meg also occurred between November 13 and 15, despite relatively small fluctuations in the inside temperature of the O2 analyzer. As described in section 2, six reference air cylinders are connected to our O2
measurement system. Three of these have δ (O2/N2) values of about -1500 per meg, while the remainder are around -1900 per meg. We commenced monitoring on November 8 using the port of the changeover valve to which the reference air cylinders with -1500 per
Fig. 4. Plots of a) hourly means of the atmospheric δ(O2/N2) and their standard deviations, and b) those of the atmospheric CO2 concentration observed at Ny-Ålesund over the period from November 8 to December 8, 2012. Also shown are c) air temperature, d) laboratory temperature, and e) standard deviations (S.D.) of the temperature inside the O2 analyzer.
meg were connected, and short-term variability of the measured δ (O2/N2) value was found to be relatively small. To examine the combination of the reference air cylinders with different δ (O2/N2) values, measurements were made between November 13 and 14 after connecting the reference air cylinders with -1500 per meg and -1900 per meg together to that port. Following this change in the combination of the reference air, the measured values of atmospheric δ (O2/N2) were temporally scattered, yielding large standard deviations. This phenomenon is thought to occur due to non-uniform mixing of the reference air with different δ (O2/N2) values in the tube between the changeover valve and the O2 analyzer.
Monitoring was then restarted on November 16 after undoing the combination of the reference air, and low standard deviations were observed again. The results of this testing indicate that the reference air with similar values of δ (O2/N2) should be connected to one port of the changeover valve, or that the δ (O2/N2) values of all the reference air to be used should be adjusted to similar levels in advance. Another solution would be to insert a buffering volume into the tube between the changeover valve and the six-port valve, to ensure sufficient mixing of the reference air.
As shown in Fig. 4 a) and b), two characteristic events were observed on November 11–12 and 22–23. During the former period, δ (O2/N2) increased rapidly by about 90 per meg and then decreased by about 60 per meg over a short period, while no clear change was observed in the CO2 concentration. It is known that three processes; i.e., (1) fossil fuel burning, (2) respiration and photosynthesis of the terrestrial biosphere, and (3) gas exchange between the atmosphere and the ocean, are the main causes of variations in atmospheric δ (O2/N2) and CO2 concentration. Atmospheric δ (O2/N2) and CO2 concentration are negatively correlated when processes (1) or (2) occur. In contrast, neither variable shows a close relationship during process (3), because the time period required for equilibration of O2 to be attained between the atmosphere and the ocean is only a few weeks, whereas that for CO2 is about one year. Considering this, the event observed at Ny-Ålesund on November 11–12 was probably related to the transportation of an air mass influenced by O2 emission from the ocean. In this connection, Lueker (2004) found from continuous O2 observations at Trinidad Head, California that atmospheric δ (O2/N2) decreased when strong coastal upwelling events occurred, due to the uptake of atmospheric O2 by the ocean. Similarly, observations at Cape Ochi-ishi, northern Japan by Yamagishi et al. (2008) also showed that atmospheric potential oxygen (Stephens et al., 1998), which is controlled mainly by air–sea O2 exchange, largely varied with time in association with O2 emission from strong phytoplankton blooms in the Okhotsk Sea. However, neither study observed any clear variations in the atmospheric CO2 concentration during the respective O2 events.
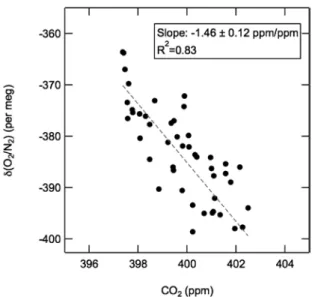
With respect to the event on November 22–23, the δ (O2/N2) value decreased by about 50 per meg and then returned to its original level, while the CO2 concentration increased by about 6 ppm and then decreased by almost the same amount. Figure 5 shows a negative correlation between δ (O2/N2) and the CO2 concentration for this event; the -O2 : CO2
exchange ratio, defined as the slope of a linear regression line between the measured values of δ (O2/N2) and CO2 concentration, is calculated to 1.46±0.12 ppm/ppm. It is known that the -O2 : CO2 exchange ratio depends on the process that controls their variation. For example, the-O2 : CO2 exchange ratio associated with fossil fuel burning is estimated to be 1.83–2.00 ppm/ppm for natural gas, 1.52–1.56 ppm/ppm for gasoline, 1.39–1.44 ppm/ppm for oil, and 1.17 ppm/ppm for coal (Keeling, 1988). Severinghaus (1995) also proposed a-
O2 : CO2 exchange ratio of 1.10±0.05 ppm/ppm for terrestrial biospheric activities. Since the observed ratio of 1.46±0.12 ppm/ppm is close to those expected from the consumption of oil and gasoline, we suggest that the event observed on November 22–23 was caused by the influence of fossil fuel burning in urban areas. We are currently analyzing these observed events in more detail.
4. Summary
To study temporal variations of atmospheric δ (O2/N2) in the Arctic region in detail, as well as to contribute to a better understanding of the global carbon cycle, we have developed a new high-precision continuous measurement system. Considering its intended use at a very remote site, the measurement system was designed to incorporate some convenient and indispensable functions: (1) the operation and monitoring of the system, as well as collection of the output data from the O2 and CO2 analyzers, can be controlled from Japan via the Internet; (2) by employing a specially designed trap for drying the sample air, as well as by connecting eight cylinders (one high standard gas, one low standard gas, and six reference air) to the measurement system, the system can monitor continuously for one year without the need for any additional manual maintenance; and (3) simultaneous measurements of atmospheric δ (O2/N2) and CO2 concentration are performed at precisions of better than ±4.0 per meg and ±0.05 ppm, respectively.
Using this measurement system, systematic and continuous observations of atmospheric δ (O2/N2) were initiated at Ny-Ålesund, Svalbard in November 2012, which is the first continuous observation project in the Arctic region. From observational results obtained during the first month, we found that measured values of atmospheric δ (O2/N2) are
Fig. 5. Correlation between atmospheric δ(O2/N2) and CO2 concentration observed at Ny-Ålesund on November 22⊖23, 2012. Linear regression line (dashed) is also shown.
usually stable, with small standard deviations of 5.0 per meg or less, indicating the high performance of the measurement system, but the values temporally scatter at low room temperatures below about 15℃. To reduce this scattering of the measured values, the temperature environment of the laboratory must be stabilized as soon as possible. Two characteristic events related to changes in atmospheric δ (O2/N2) were also observed on November 11–12 and 22–23. By considering the relationship between the measured values of δ (O2/N2) and CO2 concentration, we found that the former event was attributable to air–
sea O2 exchange, while fossil fuel burning was responsible for the latter event.
If we are to determine the nature of temporal variations in atmospheric δ (O2/N2) in the Arctic, and develop a better understanding of the global carbon cycle, long-term operation of this new high-precision monitoring system will be indispensable.
Acknowledgements
We are grateful to Dr. Shohei Murayama and Dr. Shigeyuki Ishidoya for their helpful advice regarding the air drying system. This study was partly supported by the GRENE Arctic Climate Change Research Project and the MEXT-subsidized project “Formation of a Virtual Laboratory for Diagnosing the Earth's Climate System”.
References
Battle, M., Fletcher, S.M., Bender, M.L., Keeling, R.F., Manning, A.C., Gruber, N, Tans, P.P., Hendrics, M.B., Ho, D.T., Simonds, C., Mika, R. and Paplawsky, B. (2006): Atmospheric potential oxygen: New observations ant their implications for some atmospheric and oceanic models, Global Biogeochem. Cy., 20, GB1010, doi:
10.1029/2005GB002534.
Bender, M.L., Ho, D.T., Hendricks, M.B., Mika, R., Battle, M.O., Tans, P.P., Conway, T.J., Sturtevant, B. and Cassar, N. (2005): Atmospheric O2/N2 changes, 1993–2002: Implications for the partitioning of fossil fuel CO2 sequestration. Global Biogeochem. Cy., 19, GB4017, doi: 10.1029/2004GB002410.
Goto, D., Morimoto, S., Ishidoya, S., Ogi, A., Aoki, S. and Nakazawa, T. (2013): Development of a high precision continuous measurement system for the atmospheric O2/N2 ratio and its application at Aobayama, Sendai, Japan. J. Meteorol. Soc. Jpn, 91, doi: 10.2151/jmsj. 2013–206.
Ishidoya, S., Sugawara, S., Hashida, G., Morimoto, S., Aoki, S., Nakazawa, T. and Yamanouchi, T. (2006): Vertical profiles of the O2/N2 ratio in the stratosphere over Japan and Antarctica. Geophys. Res. Lett., 33, L13701, doi:
10.1029/2006GL025886.
Ishidoya, S., Sugawara, S., Morimoto, S., Aoki S. and Nakazawa, T. (2008a): Gravitational separation of major atmospheric components of nitrogen and oxygen in the stratosphere. Geophys. Res. Lett., 35, L03811, doi:
10.1029/2007GL030456.
Ishidoya, S., Morimoto, S., Sugawara, S., Watai, T., Machida, T., Aoki, S., Nakazawa, T. and Yamanouchi, T.
(2008b): Gravitational separation suggested by O2/N2, δ15N of N2, δ18O of O2, Ar/N2 observed in the lowermost part of the stratosphere at northern middle and high latitudes in the early spring of 2002. Geophys. Res. Lett., 35, L03812, doi: 10.1029/2007 GL031526.
Ishidoya, S., Aoki, S., Goto, D., Nakazawa, T., Taguchi, S. and Patra, P.K. (2012a): Time and space variations of the O2/N2 ratio in the troposphere over Japan and estimation of the global CO2 budget for the period 2000–
2010. Tellus, 64B, 18964, doi: 10.3402/tellusb.v64i0.18964.
Ishidoya, S., Morimoto, S., Aoki, S., Taguchi, S., Goto, D., Murayama, M. and Nakazawa, T. (2012b): Oceanic and terrestrial biospheric CO2 uptake estimated from atmospheric potential oxygen observed at Ny-Ålesund, Svalbard and Syowa, Antarctica. Tellus, 64B, 18924, doi: 10.3402/tellusb.v64i0.18924.
Keeling, R.F. (1988): Development of an interferometric oxygen analyzer for precise measurement of the atmospheric O2 mole fraction. Cambridge, Harvard University, 179 leaves. Ph. D. thesis.
for the global carbon cycle. Nature, 358, 723–727, doi: 10.1038/358723a0.
van der Laan-Luijkx, I.T, Neubert, R.E.M., van der Laan, S. and Meijer, H.A.J. (2010): Continuous measurements of the atmospheric oxygen and carbon dioxide on a North Sea gas platform. Atmos. Meas. Tech., 3, 113–125, doi: 10.5194/amt-3-113-2010.
Langenfelds, R.L., Francey, R., Steele, L.P., Battle, M., Keeling, R.F. and Budd, W.F. (1999): Partitioning of the global fossil CO2 sink using a 19-year trend in atmospheric O2. Geophys. Res. Lett., 26, 1897–1900, doi:
10.1029/1999GL900466.
Lueker, T. J. (2004): Coastal upwelling fluxes of O2, N2O, and CO2 assessed from continuous atmospheric observations at Trinidad, California. Biogeosciences, 1, 101–111.
Manning, A.C. and Keeling, R.F. (2006): Global oceanic and land biotic carbon sinks from the Scripps stmospheric oxygen flask sampling network. Tellus, 58B, 95–116, doi: 10.1111/j.1600-0889.2006.00175.x.
Manning, A.C., Keeling, R.F. and Severinghaus, J.P. (1999): Precise atmospheric oxygen measurements with a paramagnetic oxygen analyzer. Global Biogeochem. Cy., 13, 1107–1115, doi: 10.1029/1999GB900054.
Severinghaus, J.P. (1995): Studies of the terrestrial O2 and carbon cycles in sand dune gases and in Biosphere 2.
New York, Columbia University, 159 p. Ph. D. thesis.
Stephens, B.B., Keeling, R.F., Heimann, M., Six, K.D., Murnane, R. and Calderia, K. (1998): Testing global ocean carbon cycles models using measurements of atmospheric O2 and CO2 concentrations. Global Biogeochem.
Cy., 12, 213–230.
Stephens, B.B., Keeling, R.F. and Paplawsky, W.J. (2003): Shipboard measurements of atmospheric oxygen using a vacuum-ultraviolet absorption technique. Tellus, 55B, 857–878, doi: 10.1046/j.1435-6935.2003.00075.x.
Stephens, B.B., Bakwin, P.S., Tans, P.P., TecLaw, R.M. and Baumann, D. (2007): Application of a differential Fuel- Cell Analyzer for Measurung Atmospheric Oxygen Variations. J. Atmos. Ocean. Tech., 24, 82–94.
Stephens, B.B., Sherzts, S.R., Watt, A.S., Bent, J.D., Keeling, R.F., Wofsy, S.C., Daube, B.C., Jiménez, R., Kort, E.A. and Mikaloff-Fletcher, S.E. (2009): Airborne observation of atmospheric O2 and CO2 on regional to global scales. 8th International Carbon Dioxide Conference: September 13–19, Jena, Germany: abstracts.
(CD-ROM)
Thompson, R.L., Gloor, M., Manning, A.C., Lowe, D.C., Rödenbeck, C. and Le Quéré, C. (2008): Variability in atmospheric O2 and CO2 concentrations in the southern Pacific Ocean and their comparison with model estimates. J. Geophys. Res., 113, G02025, doi: 10.1029/2007JG000554.
Tohjima, Y., Mukai, H., Machida, T., Nojiri, Y. and Gloor, M. (2005): First measurements of the latitudinal atmospheric O2 and CO2 distributions across the western Pacific. Geophys. Res. Lett., 32, L17805., doi:
10.1029/2005GL033311.
Tohjima, Y., Mukai, H., Nojiri, Y., Yamagishi, H. and Machida, T. (2008): Atmospheric O2/N2 measurements at two Japanese sites: esimation of global oceanic and land biotic carbon sinks and analysis of the variations in atmospheric potential oxygen (APO). Tellus, 60B, 213–225., doi: 10.1111/j.1600-0889.2007.00334.x.
Yamagishi, H., Thojima, Y., Mukai, H. and Sasaoka, K. (2008): Detection of regional scale sea-to-air oxygen emission related to spring bloom near Japan by using in-situ measurements of the atmospheric oxygen/
nitrogen ratio. Atmos. Chem. Phys., 8, 3325–3335.
Yamagihsi, H., Tohjima, Y., Mukai, H., Nojiri, Y., Miyazaki, C. and Katsumata, K. (2012): Observation of atmospheric oxygen/nitrogen ratio aboard a cargo ship using gas chromatography/thermal conductivity detector. J. Geophys. Res., 117, D04309, doi: 10.1029/2011JD016939.