Fujio TAKEUTCHI 49
Read-out of the DIRAC newSFD using F1-TDC-ADC
Fujio TAKEUTCHI Faculty of Computer Science and Engineering,
Kyoto Sangyo University, Kyoto, Japan
Abstract
The newly developed F1-TDC-ADC device allows to read out many of the detectors in the DIRAC spectrometer. It has a feature of multihit readout, and it allows to read out temporal and pulse-height information of all of the hits. NewSFD x plane is now read out with this device. In 2008, newSFD planes were installed in the DIRAC spectrometer, and used in the physics experiment. We report in the present paper on the effi ciency and the timing resolution of x plane read out using this new device. After applying the offl ine PSC algorithm, the effi ciency of the plane was found to be 97.8
% and the apparent multiplicity for the special events including 2 hits predicted with DC was about 4. The timing resolution of the plane was found to be 464.1 ps, thus it is much improved from 660 ps obtained using the LeCroy 3377 TDC. The F1-TDC-ADC is demostrated to be useful for the correction of the walk. Even a better timing result is expected after a better tuning of the VH.
1. Introduction
The special feature of the newSFD x plane in the DIRAC spectrometer is its read-out using the newly constructed F1-TDC-ADC. This device was designed and built by A. Kharpukin and tested at T11 beam line in 2006. It is now used to read out the full surface of the newSFD x plane. The old SFD x plane was read out with PSC and LeCroy 3377 TDC. The main drawback of 3377 is its coarse timing resolution. The PSC [1] is effi cient in rejecting background hits when it is well tuned, but it can kill too many double hits which are essential in DIRAC experiment if the threshold is set too high. To avoid these problems, the new readout device was designed. It acts as an ordinary discriminator, but it gives information about the timing and the pulse-height of multiple hits. The timing resolution is 120 ps/chan, inherent to the F1 device. The pulse-height information allows to set an off-line threshold, and also to apply a offl ine PSC algorithm to the obtained events.
The newSFD x plane was built in 2006 and was tested in the same year. In 2007 it was installed in the DIRAC spectrometer, but only a partial data were obtained about its performance [2]. In summer 2008 the plane was fully read out by using an ordinary DIRAC event trigger, together with other two planes, y and u. This is a short report on the performance of the new scifi planes. The data analysis has been executed using run 8005 obtained in the summer 2008.
2. ADC information - Effi ciency of newSFD
2.1 Introduction and Event Selection
Among the events taken with the trigger “2008trigmix”, events which have only one track in each backward DC were selected. The real reaction point in the target is calculated later, using the information from scifi detectors, but for the evaluation of the scifi detector effi ciency, the scifi cannot be used. Therefore we assume that the reaction took place at the center of the target, and make a reconstruction of the track in the front-end detector area. The intersection of this track with the scifi planes is the "projected hits from DC", but it is already known that the predicted hit by using this projection and the real hit differ in position some times as much as several cm. Events including projected hits near the border of the scifi plane might have the real hits outside the fi ducial area, and thus we cannot use these events for the evaluation of the effi ciency. Therefore we chose sample events whose predicted hits are both within ± 2.5 cm from the center of the plane.
2.2 Effi ciency evaluating Algorithm Triple points (triplets)
The 3 planes, x, y and u are ver y close each other in z direction. Therefore there is a relationship between the three coordinates measured with the three planes for one track.
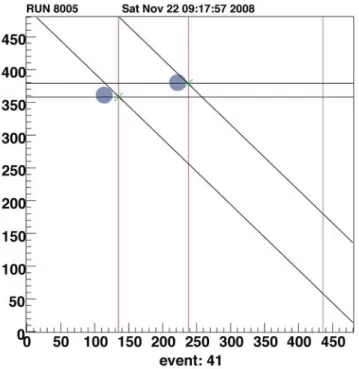
Figure 1 shows the situation of a typical event. The vertical, horizontal and oblique lines show the coordinate of the hits measured with the 3 planes. The abscissa and the ordinate show the channel numbers in x and y planes. The real size of one channel is 0.205 mm. When the vertical, horizontal and the oblique lines meet within a certain distance, then the intersection is marked with a green cross symbol. Those green crosses are very probably real hits. The gray circles show the predicted, and thus projected hits from DC. Thus in this specifi c event, the hits predicted, and the real hits agree well, or in other word, the correspondence between the predicted hits and the real hits is clearly found with a 100% effi ciency. (Here, the effi ciency refers to that of each plane.) Figure 2 shows a typical event with a high multiplicity (of hits). High multiplicity makes the detection of the correspondence between the predicted hits and the real hits diffi cult. Still it seems
Fujio TAKEUTCHI 51
Fig. 1 A typical low multiplicity event. The vertical, horizontal and oblique lines show the coordinate of the hits measured with the 3 planes. The abscissa and the ordinate show the channel numbers in x and y planes.
Triplets (see text) are indicated with green cross symbol. The gray circles show the predicted, and thus projected hits from DC.
Fig. 2 A typical high multiplicity event.
that the relationship between the measurements with 3 planes, concerning hits shown with green crosses, is reliable. Therefore we use these points with green crosses, which we call "triplets" as a starting point in evaluating the effi ciency of the planes.
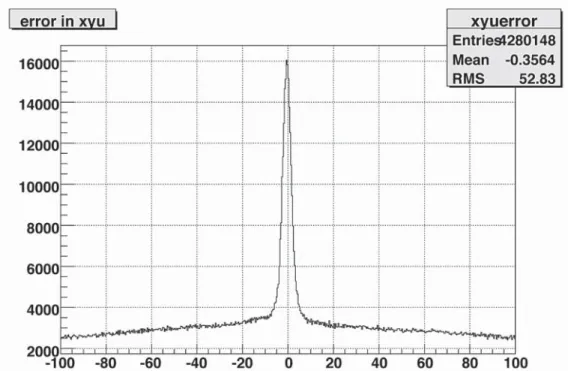
When forming the triplets, we still have to accommodate a certain error within the relationship between 3 measurements. This is due to the multiple scatterings, fi nite angles of the tracks with respect to the z axis, and the fi nite granularity of each plane. In Fig. 3, we show the distribution of the difference between u coordinate and the sum of x and y coordinates, which should be nearly 0. We see a narrow peak in the center. The width of the peak is about a few channels. The large background is caused by the fact that, to make this display easily, we took all the combinations of x , y and u coordinates measured. Therefore there are many uncorrelated combinations. We can see that if we take the allowance limit to be ± 10 channels, then we will not drop good triplets in the analysis. The fact that this shart peak is observed shows that the existence of these triplets will be a great help to evaluate the effi ciency of the plane.
Pulse-height dependence of the effi ciency of the x plane
The introduction of the F1-TDC-ADC device now allows to measure the pulse height corresponding to the energy loss of each particle crossing the scifi plane. Since one can later apply an arbitrary offl ine threshold to the hits, the hardware threshold is set to as low as 10 mV. This threshold was chosen so as to reject obvious noises [2]. Figure 4 shows the distribution of the pulse-height of the detected hits on x plane. The abscissa is the F1-ADC channels read out from the device. F1-ADC does not register events with pulse-height zero (pedestal) from its nature, one cannot see it in the fi gure. The huge peak between channels 360 and 370 is a single photoelectron peak. The pulse-heights recorded include those corresponding to the single photoelectrons caused by the cross talks either at the level of the photocathode or the distance cross talk between channels. [1]. The width of the single photoelecron peak, observed in each channel, is much smaller, but it looks wide here because the normalization of the zero and the gain of the (ADC and scifi ) channels is not done here.
2.3 Offl ine PSC
Then, the question arises as to at which level should we set the offl ine threshold? It cannot be determined by looking at the effi ciency, as the effi ciency itself is the object of study here. Until now, with the hardware PSC, we tuned it so that the hit multiplicity for a single track does not exceed 1.05. However, this multiplicity of 1.05 is not applicable to our case, even if we assume that the background level at T8 is the same as at T11, because we have always at least two tracks.
Fujio TAKEUTCHI 53
Fig. 3 Distribution of the difference between u coordinate and the sum of x and y coordinates. We see a narrow peak in the center.
Fig. 4 Pulse height information of hits obtained from F1-TDC-ADC. (newSFD x plane)
Therefore we have decided that for x plane, we apply the offl ine PSC algorithm, and require the resulting multiplicity to be the same as that of y or u plane, which are both equipped with the real PSC tuned already well at T11 beam line. One of the problems in this procedure is that the channel corresponding to the pulse-height zero (pedestal) is not known. (If we set this value to be too low, then all the hits disappear after the application of the offl ine PSC.) From Fig. 4, we somehow arbitrarily set the position of zero (pedestal) to be at channel 350.
2.4 Effi ciency of 3 planes
As stated above, the existence of triplets gives a good standard for the effi ciency evaluation.
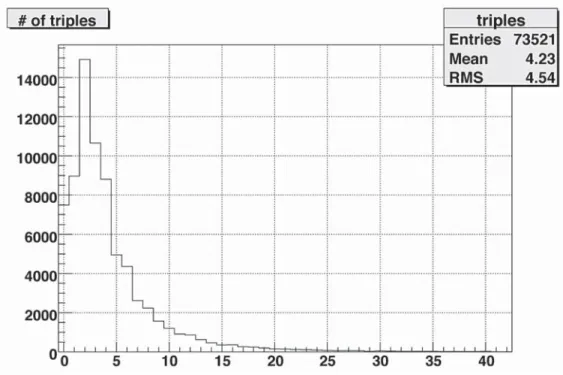
Therefore if there is a triplet within a certain distance from the DC projection, then we consider that event to be effi cient event, effi ciency for all 3 planes. But the number of triplets is as high as 4 in average, as is shown in Fig. 5. Therefore it is important to choose an appropriate “certain distance”
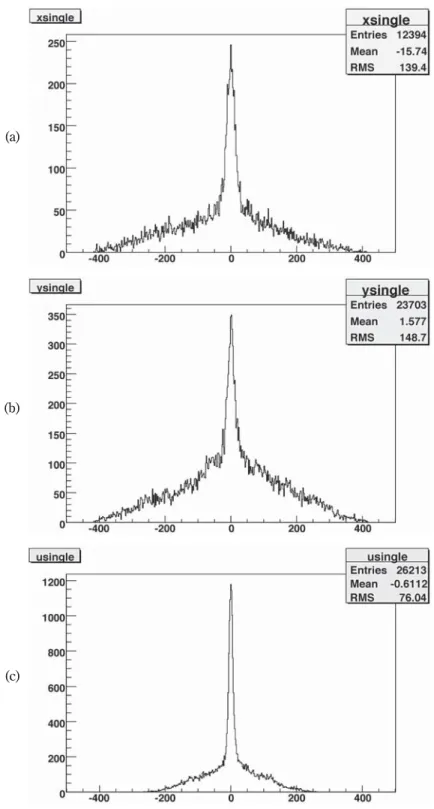
for this procedure. We plotted the distances for all the combinations of triplets and DC projections in Fig. 6. The width of the peaks (RMS) are 14.6 channels (about 3 mm) in x and y planes, and 6.7 channels in u plane. Take 3 times these values, and consider ± 45 channels, for x, and y plane, and ±21 for u to be tolerable distances from the projection. We consider that if the distance is larger than 63.64 channels (1.3 cm) which is 㲋 ̄2 times 45, then we consider them to be random
Fig. 5 Number of triplets per event in the selected events.
Fujio TAKEUTCHI 55
Fig. 6 Distances between the triplets and the predicted hits for (a) x plane, (b) y plane, (c) u plane. All the combination of triplets and the predicted hits are included in the display. This makes the base very large.
(a)
(b)
(c)
background.
With this method, however, it is possible to make only a classifi cation of “effi cient events”.
To evaluate the effi ciency, we need to identify partially effi cient events which involve ineffi cient plane. Therefore we fi rst removed all the predicted hits which have well-established corresponding triplets. Then we further assumed that a hit to which a plane is ineffi cient never produces a triplet.
Thus we removed all the hits which are members of triplets found. This procedure reduces substantially the number of hits. After that, if a predicted hit has hits in 2 out of 3 planes, then we identifi ed the plane which failed to register the hit to be an ineffi cient plane. In the rare cases, one fi nds hits on all three plane within the distance, yet the hits do not form a triplet. In that case, we do not know which plane is responsible for such a phenomenon, thus we dropped such event from the samples. In this algorithm, we treated the two predicted hits by DC separately.
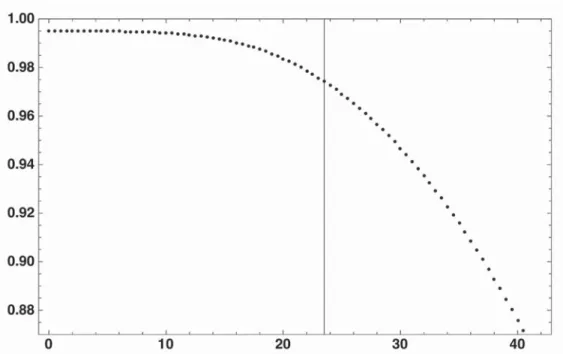
Figure 7 shows the effi ciency thus calculated as a function of the offl ine PSC threshold. The offl ine PSC output is defi ned as,
Ai – ( Ai-1 + Ai+1)/2
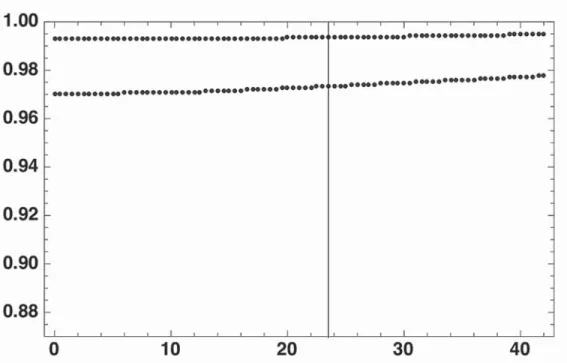
where Ai-1, Ai, Ai+1 are the pulse heights of the three adjacent channels (i-1, i, i+1), from which 350 is subtracted. On the other hand, the offl ine PSC threshold dependence of the multiplicity varies as shown in Fig. 8. In the fi gure, the multiplicity of the y and u planes which are tuned at T11 is also shown. For example, the offl ine PSC threshold at which the multiplicity of x plane is identical to that of y plane is 23.5. And the effi ciency shown in Fig. 7 for this threshold is found to be 0.97785, which is the effi ciency of x plane determined with this algorithm.
In principle, the effi ciency of the y and u planes do not depend on the offl ine PSC threshold. In reality it changes slightly as shown in Fig. 9, and this shows the incompleteness of this algorithm.
The effi ciency of the y and u planes at offl ine PSC threshold 23.5 are 0.97614 and 0.99212.
The following table shows the summar y of the efficiency and multiplicity at offline PSC threshold of 23.5
x plane y plane u plane
Effi ciency 0.9778 0.9761 0.9921
Multiplicity* 3.992 3.994 3.639
* For events with two projected hits. See text
2.5 Effi ciency in a simple discriminator mode
If x plane is read out with discriminator mode without the offl ine PSC algorithm being applied, the effi ciency evaluated changes as shown in Fig. 10.
Fujio TAKEUTCHI 57
Fig. 7 The PSC threshold dependence of the effi ciency of newSFD x plane, when offl ine PSC algorithm is applied to the hits. The vertical line represents the threshold of 23.5.
Fig. 8 The PSC threshold dependence of the multiplicity of newSFD x plane, when offl ine PSC algorithm is applied to the hits. The vertical line represents the threshold of 23.5. The multiplicity of y and u planes are also shown.
Fig. 9 In principle, the effi ciency of u (above) plane and y (below) plane do not change with the offl ine PSC threshold. The incompleteness of the algorithm change them slightly.
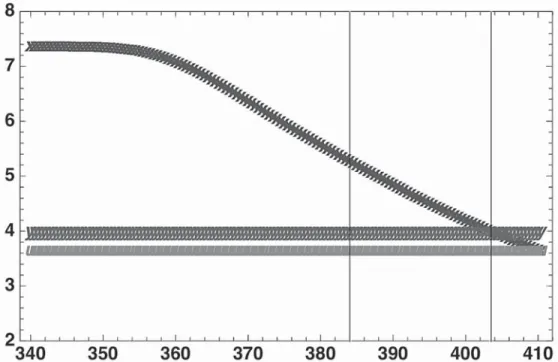
Fig. 10 Threshold dependence of the efficiency of newSFD x plane when simple discriminator mode is applied. See text about the two vertical lines.
Fujio TAKEUTCHI 59
Here, the value of the threshold is the direct read out of the F1-ADC (without subtracting 350).
For the same range of thresholds, the multiplicity for x plane is shown in Fig. 11. The multiplicity of x plane becomes identical to that of y plane at the threshold of 403.5. At that threshold, the effi ciency is as low as 0.8529. It is evident that the multiplicity in the simple discriminator mode is higher. For example, if we look for the threshold for x plane when its effi ciency is 0.9778 (the effi ciency found above), then the threshold is 384.0, and that gives a multiplicity of 5.272 for the multiplicity of x plane, evidently much larger than 4.
In conclusion, the ordinary read out of x plane should be done with the offl ine PSC algorithm.
The most appropriate threshold would be close to 23.5. If, however, there is a doubtful hit (that means hit diffi cult to determine either it is single or double), then this device allows to study more in detail the ADC (and TDC) information of all the related channels. This is a big advantage of this read out method.
3. TDC information - Timing of newSFD
We analyzed the 2008 data from the viewpoint of the timing. The device F1-TDC-ADC
Fig. 11 Threshold dependence of the multiplicity of newSFD x plane when simple discriminator mode is applied. See text about the two vertical lines. Multiplicities for the y (above) and u (below) planes are also plotted.
should improve the timing of the newSFD with its better timing resolution. Also this devices gives information about the pulse-height of each hit as mentioned above, therefore, by using that information, we should make a walk correction and improve further the newSFD timing. Generally speaking, a good track detector gives poor timing information, and a good timing counter gives a poor spatial information. In that sense, newSFD, usable in a high-intensity beam, is unique having a good spatial resolution and also having a moderate timing resolution. So to improve the timing of that counter adds to a very important advantage for the experiment which uses that counter. As mentioned in Sec. 2, we have information about the 2 projected hits from DC. At the same time, we have the information about the timing recorded by VH of these particles reconstructed with DC.
The events we used include mixed particles, but mainly pions. The pions have variety of momenta.
Thus to make a more precise analysis of the timing later, we probably have to use the electrons- positron trigger events.
3.1 Trigger timing
The trigger of the events is mainly based on the t2VH signal. But with respect to t2VH, the trigger signal has a jitter of about 370 ps RMS. Also there are events which include decays. Fig. 12 shows the timing of t2VH as a function of the trigger timing. The timing of t1VH is wide spread, as shown in
Fig. 12 Timing of t2VH as a function of the trigger timing. The trigger timing is mainly determined by t2VH.
Fujio TAKEUTCHI 61
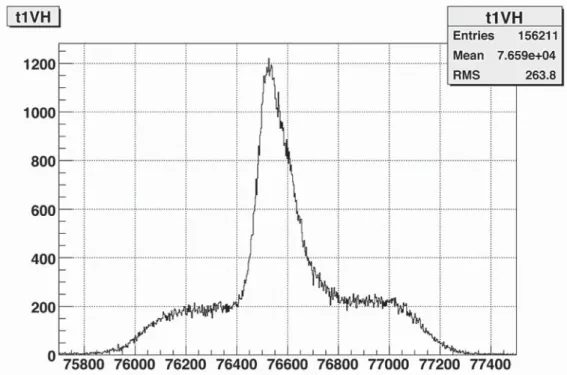
Fig. 13 Timing of t1VH as a function of the trigger timing.
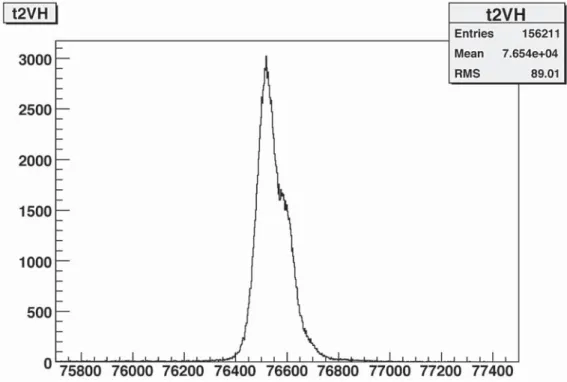
Fig. 14 The distribution in the difference between t1VH and t2VH of the triggered events.
Fig. 13. This is again plotted as a function of the trigger timing. The timing gate between t1VH and t2VH is widely open to take accurate data about the accidental coincidence events, as shown in Fig.
14. The narrow peak in the middle is the coincident events. The width of this peak depends on the tuning of the VH hodoscopes which consist of many slabs. The timing alignment of these slabs, and the walk correction on VH (as VH is rather long) determine the width of this peak in the middle. At present, the width of the peak is 277 ps RMS.
3.2 Analysis of the timing of the hits on newSFD
We assume that the timing of the hits predicted by DC is either t1VH or t2VH. We neglect the time of fl ight of the pions. As there can be ambiguities in assigning the hits on the plane to the hits predicted by DC, we have decided not to use the positional information and the temporal information from DC at the same time. That means we do not know when there are many hits on the plane, which ones correspond to t1VH and which ones to t2VH. Naturally many particles originate from one interaction in the target, several particles detected by the plane may have almost equal timings, and this makes the analysis more diffi cult.
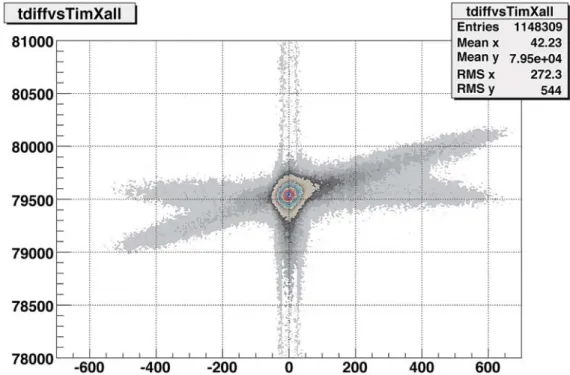
Fig. 15 Timing read out using F1-TDC-ADC of the hits on newSFD x plane as a function of the time difference t1VH - t2VH. Hits on the horizontal line in the middle are those which don't depend on t1VH - t2VH, therefore hits related with the t2VH. The events spread on the oblique line are on the contrary those which are related with t1VH. One can notice a large peak in the middle of coincident events at zero time difference.
Fujio TAKEUTCHI 63
Figure 15 shows the timing read out using F1-TDC-ADC of the hits on x plane as a function of the time difference t1VH - t2VH. Hits on the horizontal line in the middle are those which don't depend on t1VH - t2VH, therefore hits related with the t2VH. The events spread on the oblique line are on the contrary those which are related with t1VH. One can notice a large peak in the middle of coincident events at zero time difference. Thus to fi nd out the timing resolution of the hits on the plane, 1) One can select events with the condition that t1VH and t2VH are almost equal. Thus one assumes that hits in the peak in Fig. 15 should have all the same timing, and one finds out the timing resolution from that spread.
2) One can select events with the condition that t1VH and t2VH are very different. Events lie in these regions, the line is split into 2 separate lines in Fig. 15. One can roughly classify the hits to those with t1VH timing and those with t2VH timing; compare each group with each VH timing and fi nd out the spread, namely the resolution.
Case 1) allows to use more events and analysis looks easier. But the order of magnitude of the timing resolution to be found (hundreds of ps) is much smaller than the width of the peak in Fig.
15. Therefore a tight cut on | t1VH – t2VH | as small as 25 ps was applied to the events. In the case of 2), we made analysis in two separate cases. One is for t1VH – t2VH < -300 ns, and the other is for t1VH – t2VH > 400 ns.
3.2.1 Events with equal t1VH and t2VH
Under the event selection condition such as | t1VH – t2VH | < 25 ps, the hit timing on x plane of the selected events show the distribution shown in Fig. 16. One can notice a huge tail on the slower side. The F1-TDC-ADC is essentially a leading-edge discriminator, therefore, the smaller pulses should give later timing. This phenomenon is know as "walk" (the term used in the R&D of the constant-fraction discriminator). Figure 17 demonstrates very clearly this phenomenon, in which the abscissa is the hit timing, and the ordinate is the pulse height read out using F1-TDC-ADC. The correction of the walk has been tried out, and Fig. 18 shows the result. One can see that the walk is very much improved. The projection to the abscissa, shown in Fig. 19 can be compared with Fig.
16. Improvement is clear. So far events treated are all the hit events on x plane regardless of the pulse height. As it was mentioned above, the offl ine threshold is set purposely low for this plane.
Now we apply an offl ine PSC threshold of 23.5 chan., which gave the best result in the effi ciency analysis in Sec. 2. The result is shown in Fig. 20 (pulse-height expansion) and Fig. 21 (timing spread). The difference between Fig. 21 (a) and (b) is, in (a) all the events are assumed to belong to t1VH, thus displayed in terms of t1VH, whereas in (b) all the events are assumed to belong to t2VH, displayed in terms of t2VH. Although the difference of t1VH and t2VH is small, half of the hits should
Fig. 16 Hit timing read out with F1-TDC-ADC on newSFD x plane of all the events fulfi lling | t1VH – t2VH | < 25 ps.
One notices a large tail on the slower side which is cased by the small pulses (walk).
Fig. 17 This fi gure demonstrates very clearly the pulse height dependence of the hit timing read out with F1- TDC-ADC on newSFD x plane. Abscissa is the hit timing, and the ordinate is the pulse height read out using F1-TDC-ADC.
Fujio TAKEUTCHI 65
Fig. 18 Same fi gure as Fig. 17, but after the walk correction. The effect is very clear.
Fig. 19 Walk-corrected timing distribution (cf. Fig 16).
be dependent on t1VH and the rest on t2VH. The peak width obtained in the case of (a) is 462.5 ps, whereas in the case of (b), it was 465.7 ps. The average of the two cases is 464.1 ps.
3.2.2 Events with t1VH smaller than t2VH
In this case, the hits on x plane are split in two groups. Fig. 22 (a) shows the t1VH dependence of these hits, whereas Fig. 22 (b) shows the t2VH dependence of the hits. In the case of Fig. 22, the left peak, hits dependent on t1VH becomes narrow, whereas peak on the right side, hits dependent on t2VH is broader. The trend is just inversed in the case of Fig. 22 (b). It should be noted that the events in the left peak in Fig. 22 (a) are also in the left peak in Fig. 22 (b). Same is true also for the right peak. After applying the walk correction to the selected hits with offl ine PSC threshold, the width found for the left peak was 496.8 ps, and the right peak was 538.3 ps.
3.2.3 Events with t1VH larger than t2VH
The procedure, in this case is more or less the same as in the previous section. Figs. 23 (a) and Fig. 20 Same as Fig. 18, but offl ine PSC threshold of 23.5 chan. is applied.
Fujio TAKEUTCHI 67
Fig. 21 Timing read out with F1-TDC-ADC of the events shown in Fig. 20 (above offl ine PSC threshold of 23.5 chan.) as a function of t1VH (a), and t1VH (b).
(b) (a)
Fig. 22 Hit timing read out with F1-TDC-ADC on newSFD x plane of all the events fulfi lling t1VH < t2VH -300ns and above the offl ine PSC threshold 23.5 chan. Displayed as a function of t1VH (a), and t1VH (b).
(a)
(b)
Fujio TAKEUTCHI 69
Fig. 23 Hit timing read out with F1-TDC-ADC on newSFD x plane of all the events fulfi lling t1VH > t2VH +400ns and above the offl ine PSC threshold 23.5 chan. Displayed as a function of t1VH (a), and t1VH (b).
(a)
(b)
(b) show the t1VH and t2VH dependence of the hits found in this category of events. After applying the walk correction to the selected hits with offl ine PSC threshold, the width found for the left peak was 561.0 ps, and the right peak was 557.2 ps.
3.3 Timing of the newSFD
The results on the newSFD x plane timing is summarized in the table.
time resolution (ps RMS)
x plane above PSC threshold 23.5 chan.
x plane
all hits y plane u plane
| t1VH – t2VH | < 25 ps 464.1 ( average, see text) 560.0 666.5 675.3 t1VH < t2VH - 300ns 517.6 ( average, see text) 689.9 723.1 732.1 t1VH > t2VH + 400ns 559.1 ( average, see text) 741.2 788.6 780.7
However, several comments should be added to these results. The most reliable result coming from the events with small difference in t1VH and t2VH is found to be 460 ps (RMS). This is clearly better than the result read out with LeCroy 3377 TDC. But the absolute value of this width is critically dependent on the goodness of the VH tuning. As mentioned above, the timing of VH depends on the alignment of the slabs, and the correction of the walk involved in each. We used the VH timing fi xed in September 2009, and it is expected to be improved later. Then our result also will be improved.
In this analysis, we used events obtained with a mixed trigger. This includes pions with different momenta. To be more accurate, one has to make a cut on the pion momenta, or rather use events with e+e- trigger.
Another improvement of the analysis can be done by combining the spatial and temporal information about the DC predicted events. As shown in the effi ciency analysis, the assignment of the observed hits to the DC predicted hits seems acceptable. Then the correspondence between the VH timing and the hits on the newSFD plane must be clearer. The reason we did not do this analysis at this stage, is that we wanted to wait until the timing of the VH itself is improved.
3.4 Appendix: Timing of the y and u planes
This is not related with the F1-TDC-ADC device, but we analyzed also the timing of the newSFD y plane and u plane, both read out with PSC and LeCroy 3377 TDC. For the analysis we used events having 2 predicted hits in the region where | t1VH – t2VH | < 25 ps.
The t1VH, and t2VH dependences of the hits on newSFD y plane are shown in Figs. 24 (a) and (b).
As we have learned in Sec. 3.2 that the long tail on the left side is due to the walk in the low pulse-
Fujio TAKEUTCHI 71
Fig. 24 The t1VH (a), and t2VH (b) dependences of the hits on newSFD y plane fulfi lling | t1VH – t2VH | < 25 ps.
(a)
(b)
Fig. 25 The t1VH (a), and t2VH (b) dependences of the hits on u plane fulfi lling | t1VH – t2VH | < 25 ps.
(a)
(b)
Fujio TAKEUTCHI 73
height region. As we have no pulse-height information about these hits, the correction of it is not possible. The obtained timing width is 673.6 ps in the case of (a) and 659.4 ps in the case of (b).
They are not far from the value obtained before of 660 ps.
As for u plane, The t1VH, and t2VH dependences of the hits are shown in Figs. 25 (a) and (b). The obtained timing width is 671.2 ps in the case of (a) and 679.4. ps in the case of (b). In average, it was 675.3 ps and was slightly worse than in our former measurement.
4. Conclusion
It seemed that the pulse-height information obtained from the F1-TDC-ADC in the test at T11 beam line to be inferior to the one obtained with LeCroy 2249W ADC {2}. But the persent analysis shows us that the moderate pulse-height information obtained with this device is sufficient to study more in detail the hits on newSFD. Although at this stage, the event rate per column on the newSFD is not very high, if, in the future, DIRAC accepts more intense primary beam, then the multihit feature of the F1-TDC-ADC device will become more useful. This feature, namely this device allows to register pulse-height and time information of all the multiple hits, will allow this device to be used widely in the high-energy experiment world.
It was already shown that the pulse-height information allows to make the walk correction to improve the timing of the hits on newSFD. This will add to the quality and the usefulness of the already excellent detector such as newSFD.
References
[1] A. Gorin, S. Horikawa, K. Kuroda, I. Manuilov, K. Okada, A. Ryazantsev, A. Siderov and F. Takeutchi; High resolution scintillating-fi bre hodoscope and its readout using peak-sensing algorithm; Nucl. Instr. Meth., A 566, 500-515, 2006
[2] F. Takeutchi and S. Horikawa; Read-out using F1-TDC-ADC of the newSFD X plane (and dE/dx counter), Bull. Res. Inst. of Adv. Tech, Kyoto Sangyo University VII 2008 pp125-144