THE PCT METHOD AND ITS APPLICATION
by
Takashi IDEMITSU'
Akira WATANABE"
(Received October 31, 1975)
SYNOPSIS
It is vitally important to find the safety method of execution works for the prevention of construction disasters which are increasing lately with works growing large in scale and complex.
The authors deviced the new erection method of bridge, attaching great importance to the safety in work. In the new method, the lower main cable is needed besides the main cable of the former cable erection method. The two main cables are connected by several hanging cables in which the spring type tension meters and the chainblocks are inserted and the truss is formed. By operating these instruments, the desired pretension is introduced into the truss and this is called Pretensioned Cable Truss (abbreviated PCT).
The new method was successfully applied to the erectio4 of several bridges in Japan. Some of them faced with typhoon of 30--35 m/sec, but no troubleoccurred.i' Now, the PCT can be expected to work as a bridge itself, because it is very stable against wind load and its deflection due to live 1oad is also small. Hence, the authors attempted to design a PCT bridge and gave an outline of the design method, moreover, constructed a simple model PCT bridge and carried on the loading test.
This paper deals with both theoretical and experimental studies on the PCT method as well as its application to the PCT bridge.
1. INTRODUCTION
Characteristics of the PCT method and the PCT bridge are summarized as
follows. (Fig. 1)
* MEng., Associate Professor, Kyushu Institute of Technology.
**Dr.Eng., Professor, Kyushu Institute of Technology.
d/7NN
1111 le
c ll :/ ...1/ ...t/ l
J"" ki'"'`L.
a: Upper cable b: Lower cable
c: Hanging cable d: Tensioning apparatus e: Suspended cross beam f: Tension meter
g: Tower h: Anchor block
i: Abutment j: Metallic anchorage
k: Camber adjust member l: Member of truss
afd
b e
Fig.1 The PCT method for erection of bridges.
(D The PCT method enables us to carry out safety inspection on the most dangerous load for hanging cables, upper and lower cables and anchor in advance of the beginning of the work, therefore the safety against disaster is extremely high.
(D The new erection system is generally composed of two PCT in parallel and suspended cross beams are laid across them. This device enables the work in suspended state to be safety one as if it were on the ground and to progress the work very smoothly.
@ Because of the pretension introduced beforehand, the cable under loading point acts as compression member, thereby, alleviating the rate of burden on upper cable and checking the increase of tension of the upper cable due to the acted load.
@ Because of all these merits mentioned above, the cost can be reduced a great
deal.
@ Though the PCT bridge is one of the suspension bridge without stiffening girder, it is very stable against wind and its deflection due to live load is small.
2. METHOD OF ANALYSIS OF THE PCT
2. 1 Approximate Analysis 2. 1.1 Preliminary Indoor Tests
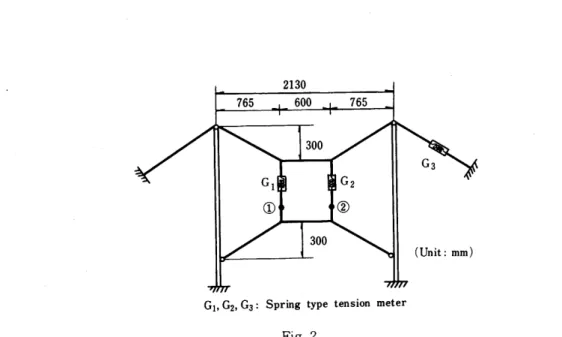
Fig.2 shows the wire truss which were experimented with a view to clarify the
2130
765600765
300
Gl
@
G2
@
G3
(Unit:mm) 300
Gi,G2,G3: Spring type tension meter Fig. 2
basic characteristics of the PCT. For tower Åë1" metal pipe was used and for wire, piano wire. In this case, pretension of each hanging cable was 5kg. When load was laid on the points (D and (2) in the order of lkg, 2kg, 3kg and 4kg, the reading of spring balances Gi, G2 and G3 was as given in Table 1, from which we can see that the rate of burden upon the upper cable is not proportioned to the acted load, which is considerably small.
Table 1 Basic test results
Readingofspringbalance Loadactedonboth
points1and2 Gi(kg) G2(kg) G3(kg)
Pretensiononly 5.00 5.00 .21.5
1kg 5.00 5.10 21.5
2kg 5.10 5.10 21.5
3kg 5.15 5.15 21.5
4kg 5.30 5.30 21.5
Reducing efficiency (B) =(4.0-O.3)/4.0=O.93
It was also beyond general understanding that the backstay tension G3 of anchoring point which was 21.5kg before loading remains almost same, that is 21.6kg even after loading upon each cable by 4kg.
From the fact that the very small rate of the acted load was shared to the upper cable, the authors considered the rest rate of the load had to be shared to the lower cable, and named the very rate as "Reducing efficiency".
Table 1 shows the tension increase of O.3kg in Gi and G2 for 4kg increase of
acted load. Therefore the reducing efficiency (B) is evaluated as below.
B=(4.0 - O.3)/4.0 == 3.7/4.0 - O.93 •••••••••••••••-•-••••••••••-•••••••--•••••••••(1)
Manganin wlre
24.6 24.8
l=:lso 35.5
f`Å~32
64 :o924.8
Tensioning devices Loading point (Unit: cm)
Fig. 3
The authors also carried out fundamental study on the PCT (Fig.3) made of manganin wires which played as the member of truss as well as an electric strain gage. The smaller -fu/ft was, the higher reducing efficiency could be attained.
A
Tensile rigidity
xu eu RA=e.il./+Xell/xiG
ei Rc== ,,/ei./+X,Ul/ .}G
" =P•G
c
Fig. 4
2. 1.2 Basic way to slove the PCT
Fig.4 shows the column fixed at its upper and lower ends which is subjected
to load G at point B. Let us take E as the modulus of elasticity, A as the area
of cross section and x as the tensile rigidity(x=EA). The load shared by supports
A and C are represented by the following equations.
RA = e./x.e +t/ itt/xt 'G•''••'•••••'•••••••••••••••••• ••••••••••••••••••••••• ••••••••(2)
th •G-••-•--•-•-••--•-••--•-•-•-•-•--•••--•-•-•(3) Rc= e./xu+et/xt
The reducing efficiency mentioned above is obtained as below.
B= e./.e.ilXa/., -•-•-•-•-•-•--••--•-•-•-•--•-•-•-•••-•-•-•-•(4)
It is needless to say that the higher eu/xu or the smaller eL/xt is, the higher B is resulted and therefore, the allotment rate of load upon point A is alleviated.
The PCT can be replaced by such a column as shown in Fig.4 substantially.
For even a cable can serve as compression member against the load as long as prestress remains in the cable.
Spring balance, hanging cable, sags of upper and lower cables and others are alsc able to conducted into the equivalent column considering the relationship between the load and the deformation.
If the reducing efficiency of the column is known, the load shared by upper and loKver cables will be determined. Hence the analysis of the PCT becomes very
simple.
2. 1.3 Calculation of Tensile Rigidity
(D Sag: This calculation is carried out on the assumption that pretensioning load, live and dead loads are uniformly distributed over the whole span. The sag fo at the midspan section and the sag Yo at an arbitrary section are increased to f=
fo+AfandY=Yo+AY respectively under the uniform load q as shown in Fig.5.
Therefore, the equation of the cable can be expressed as follows.
Yo=4fo(lx-x2)/l2 '''•'''''''''''''''''''''''''''"'•''''''"'''''''''''''''''''''•''''''''''(5)
Y =4f(lx-x2)/l2 •••••••••••••••-•••••••••••••-•••••••••••••••••••••••••••••••••••••••••••••(6)
q
o
[[[[[[[[[[[[[[[[[[[[[[D
ts NNY
N Yof .-....,-.-
Ay df
l
x
y
Fig. 5
Consequently, AY/Yo becomes a constant of Af/fo at every point of the cable.
And the sag having the length Yo can be taken as an elastic body with strain AY/
Yo due to the uniform load q•I. Hence, the tensile rigidity of the sag(xg)will be q•l•f/Af. Here, Af is obtained from the elongation of the upper cable and the change of span length due to the movement of tower heads under the uniform load.
Thus the xg is given as below.
128n3( 5 - 24n2 )
Xg= ls(1+:I!6Ln2)+(ls-4on2+2ssn4)`Xsecl20•Cb 'X"C ''''''''''"'"'''''''""''''(7)
where, n=f/l. Cb, 0: length and angle of inclination of backstay cable respectively, xc: tensile rigidity of upper cable.
@ Spring balance: The tensile rigidity of spring balance of length S is xfs=KS Here, K is spring constant. If the number of hanging cables is N, the spring balance is usually inserted to every hanging cable, therefore, the tensile rigidity of whole spring balance will become N•xs•
@ Hanging cables: The tensile rigidity of the whole hanging cable will become N•xo=NEoAo, where Eo and Ao are modulus of elasticity and area of crosssection of the hanging cable respectively.
2. 1.4 Equivalent Column and Reducing Efficiency
By using the values of tensile rigidity for sag, spring balances, and hanging cables as calculated before, the equivalent column is obtained as shown in Fig.6.
Tensile A Length
rigidity
(2/3)fu
Xgu .---N-.-J. ForA--B
xu N'xs s
xgu N' xs N' xo Loading point B
(Cross beam)
For B--C
xi N'xo Li xi=(2/3)fLt ei Xgi (2/3)ft Xgt N• Xo
C
Fig.6 Equivalent column of the PCT
The combined tensile rigidity for A-B and for B-C are given by equations(8)
and (9).
ForA'B Xu=(2/.3.lfu+/SU..+Ne-.u, (8)
L,
For B'C X`= (x2.f3)ft +eN-ix, "'"'"'"'"'"•'""''"''''''"''''''•(9)
Thus the reducing efficiency of the column is obtained.
B : L./L."./X+u L,/., •••--•••••••••••••••••••••••••••-••••••ao)
where,
Lu/xu == (2/3)fu/xgu+S/Nxs+e-u/Nxo Lt/xt = (2/3)ft/xgt+e-t/Nxo
2. 1.5 Analysis of the PCT subjected to Vertical and Horizontal loads When the concentrated Ioad G(=gl, g: dead and live load uniformly acting on the PCT)is acting on the equivalent column having pretension P(=NP)as shown in Fig.7. The 1oad shared to the supports A and B are P+(1-B) G and P- B•G respectively. Therefore, the uniform load to be acted along the upper and the lower cables become q.=[P+(1-B)G]/l and qi= [P-BG] /l respectively. Using these loads, tensile stress, deformation and other of the cables can be calculated by the ordinary cable analysis. It is better to multiply q. by(1+1/N)in the case when the number of hanging cable is comparatively few.
p P+ (1-B) •G
Xu B
xt
Lu
Ll
B
G
L'u
L't
C1 Cl .-B.
P
(a) (b)
Fig.7 Equivalent column subjected to vertical load
The loads due to wind and earthquake so called horizontal loads are assumed to be acted uniformly over the whole member of the PCT. It is supposed that the affected area of the cables by wind is small and the weight of the whole cable is not so heavy. Therefore, the authors assumed that the horizontal loads act only on the cross beam.
P+ (1-B) 'G+d Pu A
Lu
---d-- B
L"
L2
y
Ll
P-B•G+aPl
Fig.8 Equivalent column subjected to horizontal load
Fig.8 shows the equivalent column with displacement due to the wind load acting at the cross beam at B. From the theoretical and the experimental results, the tension increase of the upper and the lower cables are found to be almost same i.e. APu#APt Let it be APw and from the conditions of equilibrium and
compatibility, the following equations can be obtained.
w- twÅë (gb+AP.) -•••-•--••-•-•-•--•--••-••----••---••••aD
Where,
Åë= 2(L'1. + Ll, ){x.+p+L('l-B)G + x, +Li`-BG}
L'u
Åë=P+(1MB+L'. +L't )G
If AP. is obtained from equation aD,uniform load of q.=AP.(1+1/N)/l will
become to act on the upper cable. The tension increase per hanging cable will
become AP./N. Moreover, displacement X can also be calculated easily. Similarly,
the problems against earthquahe can be solved.
2. 1.6 Loss of Pretension due to Temperature Change
The change of tension of the cables due to temperature change may become comparatively large and affects on the determination of the amount of pretension to be introduced to the cables. The change in pretension APt due to temperature change is obtained as below.
Apt=ii:31.ll.l"sal.i.l"t'i,aSlli:.Iae.-ft.'e-.')fi.'.(Z-l)3.lt'.,aaitilli,l2,a,'ki,.agistt ('2)
where, ao, as, agu, agt, aT: Coefficients of thermal expansion of hanging cable, spring balance, upper sag, lower sag respectively, hT: height of tower.
The change in tension per hanging cable will become APt=APt/N.
2.2 Accurate analysis 2. 2.1 Basic theory2)
In the state shown by the solid line in Fig.9, let x, y, z be the coordinates of the node i of a structure. The direction cosines of a member ij on x, y, z axes then become as
aw=
[?ll,]=-il(:tl,:-ltl,] (i3)
The member ij, subjected to the force NiJ•, is in a state of equilibrium, and then is deformed and displaced by inclement of load acting on the structure.
Consequently, the force acting on this member changes from Ni,• to NiJ•+ANiJ- and the new state of equilibrium, shown with broken line in Fig.9 occurs.
Y
K/ 4x; liJ'
N'tN
x
N
Z. N
Å~ e'*
41.
x
21' ÅrÅq 4th ti z
Fig. 9
In this state, components of displacement Adi of the node i is expressed as below.
.d,=(A. Xyl) .."..""...."."..."".".m"."•- (14) LAziJ
Now, let us define Adi,• as Adi,•=Adi-Adj. The elongation Ali,- of the member due to this deformation is then indicated in the following equation by using Adi,k
A lij = -l;l' !i" w iJ•x ii '''"'•••'•'"'"''''''''''"'''( 15)
where tu,j=2azi' ,A., dzj +AdtYi' C., diJ ••••••••• (i6)
x,,•=1- ca iJ'(1- to2iJ'(1- WsiJ'(s- a)iJ'(7-211tL.,,))))•••••••••••••••••• ( 17)
Here, *is the sign of transposed matrix. Generally, the value of xi,• is almost equal to 1.0. But, using the `flow chart shown in Fig. 10 and giving a moderate value to m, it is easy to converge xi,• to the constant value allowed by the precision peculiar to the computer.
2(r+1) b=bw
Fig. 10
Let us take EA as the tensile rigidity, loi,• as the length under standard temperature and no stress, Alti,• as the elongation due to change of temperature, and define Fij as FiJ•=EA/loiJ-•
The increment of force ANi,• by additional load can be expressed by equation-
(18).
AN,,-=F,,• (Al,,•-Al,,,•) •••••••••••••••••••••••••••••••••••••••••••••••••••••••••••••-••••••(18)
Total potential energyAi,• stored in the member ij during the change from the state of initial equilibrium to the new one become as follows.
A,,•=AU,,•+O,,•- (fi,,+An,,•) •-•••••••••••••••••••••••••••••••••••••••••••••••••••••••••(19)
where AUij : strain energy due to additional stress Ui,-: strain energy due to initial stress
fii,•: potential energy loss of initial nodal force AHi,•: potential energy loss of additional nodal force
when only axial loads are acting on members, the following equation is obtained.
A,,=Å}AFI\jZJ +N,,iAl,,•-Ad,*j(D,j+AD,j)••••••••••••••••••••••••••••••(20)
where D,,•:vector of initial force acting on nodei of the member ij ADi,•: vector of additional force acting on the node i
The structural system after deformation is also a new state of equilibrium, so the extremal value of Ai,i must exist.
Therefore, -ii-12d`"',,=g2/'"I,(N,j+AN,j)-(Di,i+ADi,•)=O•••••••••••••••••••••(21) Consequently, equation (22) is obtained by doing DiJ•==Ni,•aiJ•
{F tJx iJ•a i,•a :•, + pt i,( e- x i,a i,•a fJ) +F i'27i,pt Z" x ,ja i,• A d i] } A d ij = A D ,, + A D tir • •( 22)
where ADtiJ•=:Fi,Alti,aij : term of thermal load
-N,j+AN,j .
. parameter of axial load PiJ- l,j+Ali,•
e :unit matrix (3x3)
This unit equation (22)is eXact, because both the compatibility of displacement and the equilibrium of forces are 'sqtisfied entirely. In the theory of small deformation method, equation (22) becomes as follows.
Fiiai,a,"i,• Adi,-=ADi,•+ADti,•••-••••••••••••••••••••••••••••-•••••••••••••••-••••••••••••••(23)
Moreover, in case of approximate solution, the high graded terms of displacement are omitted and it appears as equation (24).
IFi,•ai,•ai,+'+pti,• (e-ai,Ja'i,•)I Ad,,•=AD,,•+AD,,,• ••••••••••••••••••••••••••••••••-•(24) However, the following equation should be applied to pti,• in equation (24).
pt.= NiJ'+l,e. NiJ •-•••••••••••••••••••••••••••••••••••••••••••••••••••••••-••-••••••• (2s)
Let AiJ-, BiJ• be as expressed in equations (26), (27) respectively.
Ai,•=Fi,•xi,•ai,•a'i,•+pti,- (e-xi,•ai,-a"i,•) •••••••••••••••••••••••••••••••••-•••••••••••••-••(26)
B"= Fi'2i7ipt, i' xwa"Ad'zJ '''''''•'''''''''''""'"'''''''''•''•''•'''''''''''''''''''" (27)
By using these, the equation (24) becomes as below.
(A,,•+B,,•) (Ad,-Ad,)=AD,.•+AD,,,• ••••••••••-•••••••••••••••••••••••••••••••••••(28)
Now, be ADi the vector of additional force acted on the node i, the following equation is expressed by definition.
EAD,,•==AD,••••••••••••••••••••••••••••••••••••••••••••••••••••••••••••••••••••••••••••••••••••••(29)
J
Suppose we let j in equation (29) apply to nodes connected with the node i by turns. Then we get several equations. If these are gathered into a single matrix equation, we have
(K.+K.)Ad :AD+AD, ••-•••••••••••••••••••••-•••••-•••(30)
where KA=
Ad=
.sA,j
-Aki XA,j
,KB==
-A ih '•.
. .EA nJ
Ad, Ad,
1•
Adn
, AD= AD, AD, l
ADn
.E B,j
.XB,, EB,j 2B,, ••.
. "SBnj
,AD, ==
;XAD,,j
.: A D ,2j
i
EADtnj
2. 2.2 Iteration system for exact solution
The unit equation (22) and the stiffness equation which is composed of it are completely exact, but are non-liner.
In this computation, the approximate solution obtained by applying equation(24) as aunitequation is of great use for initial value of this non-linear finite deformation method.
At first, keeping KB=O, xi,-=1.0 and changing the value of pti,•, the iterative calculation is. done until the value of ANi,• converge and the approximate solution is obtained. Of caurse, in order to obtain this solution, the following equation should be used as the force equation of members.
ANi,•=Fi.• lai,i"Adi.•-Altijl ••••••••••••••••••••••••••••••-•••••••••-•••••••••••••••••••••(31)
Then, "i,-, tuij, and xi,- is calculated with this approximate value of ANi,n
Moreover, KA, KB can be composed again with those value. Consequently, the following equation can be calculated.
Ad = (K.+K.)-i(AD+AD,)••••••••••••••••••••••••••••••••••••••••••••-•••••••••-(32)
This solution of Ad become an approximate value for the next iterative calculation.
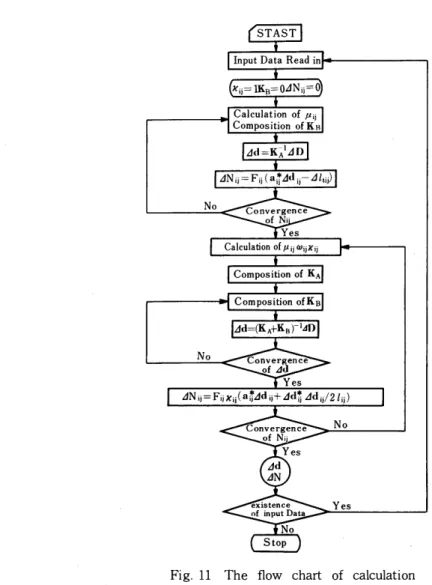
The flow chart of this calculation is presented in Fig.11. Usually, zero is given
to initial value of ANi,J. However, when the structure is unstable and we must
calculate from the state under non-stress, a considered value (not equal to zero) should
be assumed. In case of PCT3), we consider as the initial state the moment when
the designed value of pretension has been .introduced. Therefore, the amount of
pretension and the coordinates of nodes at the pretensioned state must be selected
for initial values.
STAST
InputDataReadin xij=IKB==OdNii=:O
Calculationofpij CompositionofKB
Ad=:K-
,iAD
ANij=Fij(ai'jddij-dltij)
No Convergence
ofNi' Yes
Calculationofptijwijxij
CompositionofKA CompositionofKB bd=(KA+KB)-idD
No Convergence
ofAd Yes
nNij=Fijxij(a,'•jAdij+ztd:•jAdii/2lij)
Convergence No
ofNij Yes dd AN
existenceYes
ofinputData
No Stop
Fig. 11 The flow chart of calculation
As a result of the computation of the moderate type of PCT by this method, the difference between the linear solution and the non-linear one calculated iteratively is very small. Consequently, it may safely be said about the calculation of moderate PCT that a linear solution can be considered as a strict solution.
3. SAFETY ERECTION METHOD OF BRIDGE BY COMPOSING THE PCT
3.1 Essentials for Safety Inspection
The outline of the PCT method has already presented previously in chapter 1.
Here, some of the details will be given.
Since the maximum tensile stress of upper cable is produced at the top of the
tower, extra cable is connected as shown in Fig. 12 which helps prevent the complete
destruction of the PCT only releasing the pretension even if the cablebroke at the
very point.
t
Extra cable
Fig. 12
Safety is assured even after the anchor block began to slide during the pretensioning process, only releasing the pretension as stated above (Fig.13).
.,-, lh.
e sN NN
QP
Fig. 13
3.2 Comparison between the Results Obtained from the Bridge Test and the Theoretical Ones
The first, second and the third tests were carried out in 1964, September on the
JYO BRIDGE, in 1966, August on the OBARU BRIDGE and in 1968 on the NEGOYA BRIDGE respectively.
The types of first and second bridges were warren truss and the rest was four span continuous truss. For the former two, one span PCT were used and the two span PCT for the third one. The dimension, amount of pretension and others are tabulated in Table 2.
Table 3 presents the results obtained in the bridge tests and calculated values.
The theoretical values of reducing efficiency agree well with the value obtained from the bridge test which proves that this simplified analysis is practically applicable to the design of the PCT.
3.3 Other Merits of this Method to be Emphasized
In this method, pretension of higher than the tension due to the design load plus
design prestress is firstly introduced to the cable. And then it is released to the
design prestress, therefore, during this work, if there is no trouble in the system,
automatically its safety will be proved. The workers will be free from fear of
Table 2
Nameofbridge TheJYb TheOBARU TheNEGOYA
Pretensionperhangingcable(kg) 4000 1270 4000
Spanlengthlu(m)' 76.000 74.600 50.400 Midspansagfu(m) 8.000 8.033 8.000
Tensilerigidityxc(kg) 1.608Å~lo7 1.608Å~107 1.005Å~107
Upper
cable LengthofbackstayCb(m)
cable 27.909 21.720 55.000
Main
cable
IcnaC bl
lienationofbackstayseco 1.155 1.166 1.200
Spanlengthlt(m) 70.010 70.460 50.400
Lower
cable Midspansagft(m) 8.000 4.500 26.000
Tensilerigidityxc(kg) 1.608X10⁷ 1.608Å~107 1.005Å~lo7
No.ofhangingcablesN 9 9 7
iaVnegriaigeciaebnigetshOfUPPere.(m)
4.310 3,400 1.500
Hanging
cable hA
aYnegriaigeclaebnlgetshoflowere,(m)
4.245 2.100 9.000
Tensilerigidityxo(kg) 1.552Å~lo6 1.552Å~lo6 1.848Å~lo6
bL
aeln ag ntch eOfSPrings(m) 1.800
Spring
balance Springconstantk(kg/m) 5.078Å~104
Tensilerigibityxs(kg) 9.140Å~lo4
Tcwer HeightoftowerhT(m) 14.200 14.200 12.000
Table 3 Field test results
NameofBridge TheJYb TheOBARU TheNEGOYA
Rretensionperhangingcable(kg) 4000 1270 4000
Actedloadonthecable(kg) 2610 2350 3500
Meanreadingvalueofspringbalance(kg) 4620 2500 4460
Measured O.762 O.477 O.869
Reducingefficiency
Calculated O.727 O.456 O.867
disasters and the work will be improved considerably even in the site of strong wind.
Once this PCT faced with typhoon having the wind velocity of about 35m/sec, but
no trouble occurred.
The PCT were such designed that they can stand the wind of 55m/sec and the temperature change of Å}20Åé by considering the site condition. In general, the tension increase for each case can be considered as less than 100/o, because the PCT is a temporary structure. Moreover, the period to be used will be comparatively
short.
4. THE PCT BRIDGE4)
4.1 The Method of Design of the PCT Bridge
The PCT was deviced to attain the safety erection of the bridges. However, the PCT is very stable against wind load and the deflection due to live load is also very small. Therefore, the PCT can be expected to work as bridge itself.
Generaliy, the rigidity of suspension bridges having heavy dead load can be expected to some extent even when the stiffening girder or truss is not used. And the PCT can be applied to such suspension bridges to decrease heavy dead load by means of introduciong prestress into the cable. Therefore, the authors attempted to design a simple PCT bridge and give an outline hereinafter.
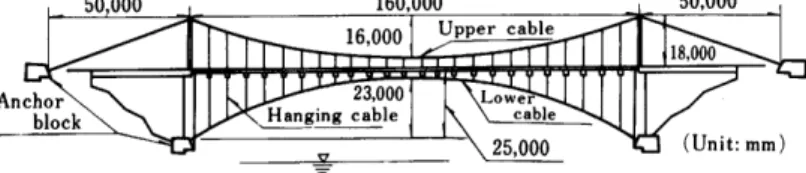
Side view of the PCT bridge is shown in Fig.14. As described above, no stiffening girder is needed. And, in this design the PC precast plates are placed over the cross beams side by side to form the bridge floor.
50,OOO 16,OOO 160,OOO50,OOO Uppercable
18,OOO
chor
block Hanging
23,OOO
cable Lowe
rcable25,OOO (Unit:mm)
Fig. 14 Side view of the PCT bridge
Determination of the amount of prestress shouid be done on the basis of improving the torsional rigidity against the lateral buckling. The critical wind velocity (V,.)whichleads the structures to fail casing lateral buckling is represented the following equation agreeably to Dr.HIRAI'S proposal.
vzr- 4T'(lill.lilllX!.IIIEIiill{ip.b.i3 ••••-•••••••••••••••••••••••••••••••••••••••t•••••••••••••••••••(33)
where, pt 2 == 1 + s/i2g •( s+CD) /4 rr2CD EJ= EI +l2H/2 .2
GK = GK + nZbZEJ /l2
CD, EI, GK : drag coefficient, flexural rigidity, torsional rigidity of stiffening girder
respectively. s :lift curve slope, H: horizontal tension of the maincable, l: span
length, b: width, p :density of air. As the PCT bridge has no stiffening girder,
EI and GK will be zero.
Therefore, the critical wind velocity for this design will become.
vzr- lil(clllllllil..i;Pi2 •••••••••••••••••••••••••••••••• ••••••••t•••••••••••••••••••••(34)
According to the specification on the design of the bridge against wind load, the critical wind velocity should be more than 1.7 times the designed wind velocity.
If s, CD, l-and design wind velocity are given, from equation (34), H will be obtained standing even for the critical state. In this design, V..==71.lm/sec, CD==O.12,
s=6.0, p=Q125Kg•secZ/m`, t=160m were used The obtained H was equal to 979 tons. In the PCT bridge, both upper and lower cables resist the torsion at the same
time. Therefore, the sum of the H of each cable should be greater than the value obtained above. Consequently, the needed pretension in each hanger is given
by equation (35).
Psl (N8+Hl)l'f.f+"'ff`, ••••--••-•--••--•-•-••••-••-•••-•-•-•-•-(3s)
Substituting H=979t, N=24, f.==16m, ft==23m into equation(35),Ps will come out to be 18.5t or more. By considering the release of tension of cables due to the temperature change, the pretension to be introduced into each hanging cables was determined to be 30t.
The section area of each cable was determined considering not only the required pretension but also the tension increase due to live load, change to temperature and wind load etc.
By the way, the determination of the reducing efficiency (B) should be taken up.
In the case when the PCT is used as the temporary structure to erect the bridge, the higher value of B is desired. However, in the case when it is used to bridge itself, the recommendable value for B is about O.5 to help prevent the unbalance of tension for the upper and lower cables which suppose to lead unstability against horizontal load.
For this bridge, the theoretical value of B was O.53. Therefore, 470/o of the surn of dead and live loads was supposed to be carried by the upper cable.
The release of tension of each hanging cable was calculated as 9.5t for the temperature change 300C. This is the reason why the pretension of 30t for each cable was determined previously. In other words, it was to satisfy the equation of [ 30-9.5= 20 .5 t År 18 .5 t ] .
The increase of tension of each hanging cable due to wind load was calculated as O.19t which was not so influential.
The calculation of vertical deflection due to live load was done by the large
deformation method. When uniformly distributed load is acted only on the half span
of the bridge, the maximum deflection obtained to be 45cm which satisfies the limit
of l/350 specified.
4
• Upper cable Tension meter•
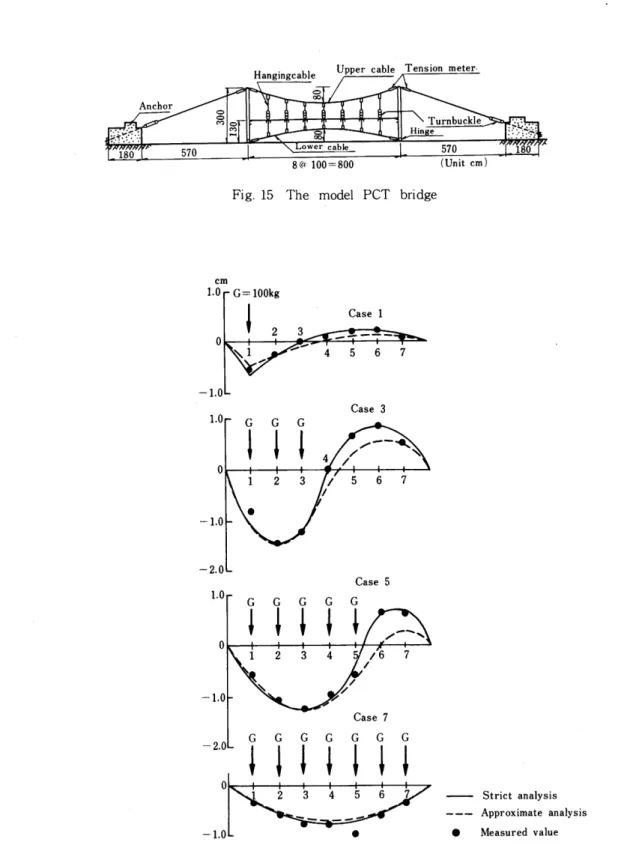
8(a) 100==800 (Unit cm) Fig. 15 The model PCT bridge
cm LO
o
- 1.0 1.0
o
-1.0
-2.0 1.0
o
",1 7 4567
GGG 1ll Case 3 -.'Al 4/ N"
Case 5
GGGGG
z
"7 -1.0 pr
Case 7
GGGGGGG -2.0 "i""
o
2 3 4 5 6 7 Strict analysis
h. ..., -•--- Approximate analysis
-LO e e Measured value
Fig. 16 VeFtical displacement at the cross beams due to the eccentric uniform loaging and
uniform loading
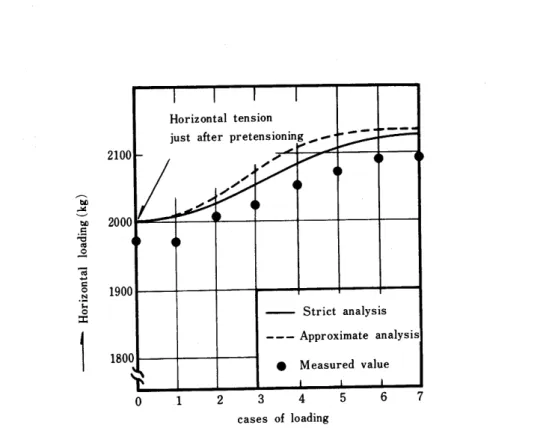
2100
Ait)
i ua 2000
.=...
v
es