Ec onom
i c i m
pac t s of ec onom
i c c or r i dor s i n
M
ongol i a : an appl i c at i on of I D
E- G
SM
著者
Kum
agai Sat or u, G
okan Tos hi t aka, Keol a
Soukni l anh
権利
Copyr i ght s 日本貿易振興機構(ジェトロ)アジア
経済研究所 / I ns t i t ut e of D
evel opi ng
Ec onom
i es , J apan Ext er nal Tr ade O
r gani z at i on
( I D
E- J ETRO
) ht t p: / / w
w
w
. i de. go. j p
j our nal or
publ i c at i on t i t l e
I D
E D
i s c us s i on Paper
vol um
e
701
year
2018- 03
INSTITUTE OF DEVELOPING ECONOMIES
IDE Discussion Papers are preliminary materials circulated to stimulate discussions and critical comments
Keywords: Simulation, new economic geography, Mongolia JEL classification: R12, R13, R42
1 Director, Economic Geography Study Group, Development Studies Center, IDE-JETRO ([email protected])
IDE DISCUSSION PAPER No. 701
Economic Impacts of Economic
Corridors in Mongolia: An Application of
IDE-GSM
Satoru KUMAGAI
1,Toshitaka GOKAN
2and Sou
k
nilanh KEOLA
3March 2018
Abstract
In this paper, we tried to estimate the economic impacts of the Central Asia Regional
Economic Cooperation (CAREC) Economic Corridor 4a, 4b, and 4c projects, which
enhance the connectivity between Mongolia and its surrounding countries, using a
computational general equilibrium model based on spatial economics. The estimation
results show that the economic impacts for Corridor 4b, which connects China and
Russia through Ulaanbaatar, the capital of Mongolia, are the highest compared with
the other two corridors. Apart from Mongolia, Corridor 4b also economically
impacts China, EU, and Russia; thus, cooperation among these four parties might be
a suitable arrangement for development. The evaluation of large-scale economic
2 Researcher, Economic Geography Study Group, Development Studies Center, IDE-JETRO ([email protected])
3 Researcher, Bangkok Research Center, IDE-JETRO([email protected])
The Institute of Developing Economies (IDE) is a semigovernmental,
nonpartisan, nonprofit research institute, founded in 1958. The Institute
merged with the Japan External Trade Organization (JETRO) on July 1,
1998. The Institute conducts basic and comprehensive studies on economic
and related affairs in all developing countries and regions, including Asia,
the Middle East, Africa, Latin America, Oceania, and Eastern Europe.
The views expressed in this publication are those of the author(s). Publication
does not imply endorsement by the Institute of Developing Economies of any of the
views expressed within.
INSTITUTE OF DEVELOPING ECONOMIES (IDE), JETRO 3-2-2, WAKABA,MIHAMA-KU,CHIBA-SHI
CHIBA 261-8545, JAPAN
©2018 by Institute of Developing Economies, JETRO
No part of this publication may be reproduced without the prior permission of
Economic Impacts of Economic Corridors in Mongolia: An
Application of IDE-GSM
Satoru Kumagai, Toshitaka Gokan and Souknilanh Keola
Abstract
In this paper, we tried to estimate the economic impacts of the Central Asia Regional
Economic Cooperation (CAREC) Economic Corridor 4a, 4b, and 4c projects, which
enhance the connectivity between Mongolia and its surrounding countries, using
IDE-GSM, a computational general equilibrium model based on spatial economics. The
estimation results show that the economic impacts for Corridor 4b, which connects China
and Russia through Ulaanbaatar, the capital of Mongolia, are the highest compared with
the other two corridors. Apart from Mongolia, Corridor 4b also economically impacts
China, EU, and Russia; thus, cooperation among these four parties might be a suitable
arrangement for development. The evaluation of large-scale economic development of
corridors is not very easy without proper evaluation tools. This paper shows the efficacy
of this simulation-based policy analysis to shape better development plans for Mongolia.
Introduction
Infrastructure development as well as logistics enhancement is one of the most
important drivers for economic development, especially for countries that are land-locked
and where waterways cannot be used as a main mode of transport. To pursue higher
economic development with less inequality in land-locked Mongolia, the improvement
of land transport is crucial.
This paper tries to provide some policy implications for better transport infrastructure
in Mongolia by using the Geographical Simulation Model developed by IDE-JETRO
(IDE-GSM). IDE-GSM is a simulation model based on spatial economics and is also
known as new economic geography (NEG). It can be used as a tool for policy makers to
decide what kinds of trade and transport measures (TTFMs) are required for target regions
and how to prioritize them. The model has an original economic model with a general
and 12,000 routes, and several parameters obtained by econometric techniques. It covers
the provinces or cities of 18 countries/economies in East Asia—Bangladesh, Brunei
Darussalam, Cambodia, China, Hong Kong, India, Indonesia, Japan, Korea, Lao PDR,
Macao, Myanmar, Malaysia, the Philippines, Singapore, Taiwan, Thailand, and
Vietnam—as well as eight Central and Western Asian countries and Russia and Mongolia.
The model makes prediction of the spatial structure of economic activities and estimation
of the economic impacts of various TTFMs on each region at the sub-national level
possible.
This paper is structured as follows: Section 1 briefly introduces the structure of
IDE-GSM; Section 2 constructs the baseline scenario, explains its assumptions, and describes
each development scenario for Mongolia used in the empirical analysis; Section 3 shows
the results of numerical analysis on each scenario; and Section 4 analyses the economic
impacts of the corridors and proposes some policy implications. The last section
concludes the paper with a future research agenda.
1. The structure of IDE-GSM
IDE-GSM can be regarded as a combination of data, the estimation of parameters, a
model for NEG, and a simulation procedure to analyze the impact of specific TTFMs on
regional economies in East Asia at a sub-national level.
Primarily based on official statistics, we derive the gross regional product (GRP) for
the agricultural, mining, service sectors and five manufacturing sectors in 2010. The five
manufacturing sectors are food processing, garments and textiles, electronics, automotive,
and other manufacturing. Population and area of arable land for each region are compiled
from official statistical sources. Figure 1 shows the GRP per capita for each region in
2010.
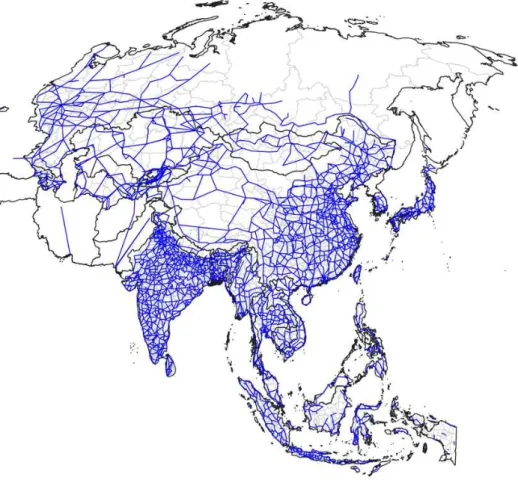
The geography of our simulation model consists of connected points in more than
2,000 regions. The number of routes included in the simulation is more than 10,000 (land:
6,500; sea: 950; air: 2,050; and railway: 450). The route data comprise the start city, end
city, distance between the cities, the speed of the vehicle running on the route, etc. The
land routes between cities are based mainly on the “Asian Highway” database of the
United Nations Economic and Social Commission for Asia and the Pacific (UNESCAP).
then the distances between cities in a straight line are employed.
Figure 2 shows the land route networks incorporated in IDE-GSM. The data on air
and sea routes are compiled from Nihon Kaiun Shukaijo (1983) and the dataset assembled
by the team of the Logistics Institute-Asia Pacific (TLIAP), and 950 sea routes and 2,050
air routes are selectively included in the model. The railway data are adopted from various
sources, such as maps and the official websites of railway companies.
Furthermore, we estimated the costs per kilometer in US dollars (USD) and domestic
and international loading costs for air transport, marine transport, trucking and railway
transport, and also the parameters on the modal choice between three transport modes by
econometric techniques.
Figure 1: GRDP per Capita in East Asia, 2010
Figure 2: Land Route Network Data in the IDE-GSM
Source: Authors
An NEG model in IDE-GSM provides the source of the spatial dynamics on
populations and industries. The original NEG model, the Core-Periphery (CP) model by
Krugman (1991), uses numerical solutions to show its fundamental characteristics. The
basic CP model features a two-location/two-goods model, setting one good (typically
assumed as an agricultural good) as numeraire, which is produced by a constant returns
to scale technology and incurs zero transport costs while the other good is produced by
increasing returns to scale technology (typically assumed as manufacturing goods) and
incurs positive transport costs. IDE-GSM was developed based on this CP model.
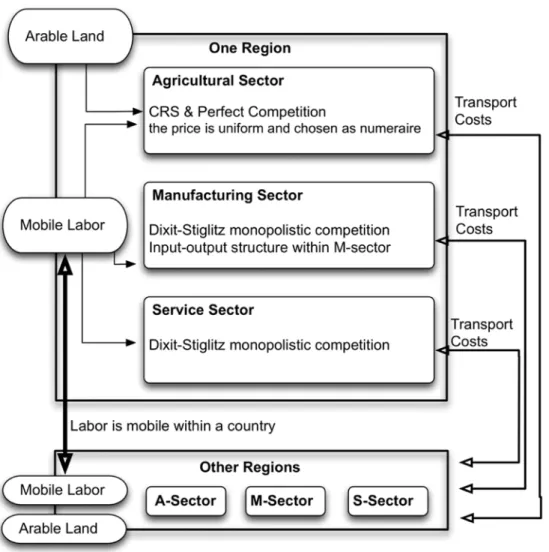
The economy in IDE-GSM features two endowments: labor and land. Labor is
mobile within a country, but is prohibited to migrate to other countries. Further, labor can
choose the industry to work in. Land, which is unequally dispersed in all regions, is jointly
All products in the three sectors are tradable. Transport costs are supposed to be of the
iceberg type to omit the transport sector. That is, if one unit of product is sent from one
region to another, the unit with less than one portion arrives. Depending on the lost portion,
the supplier sets an additional charge on the mill price of transported goods. The increase
in price compared with the mill price is regarded as the transport cost. Transport costs
within the same region are considered negligible.
Figure 3: Model Structure
Source: Isono et al. (2015)
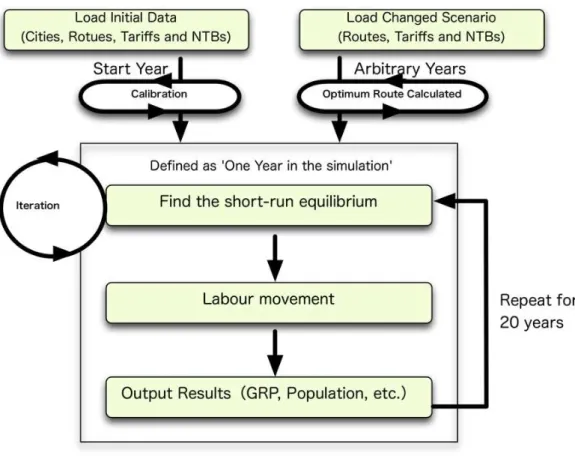
The dynamics for the spatial distribution of populations and industries in the
long-term by IDE-GSM are illustrated in Figure 4. First, with a given distribution of
equilibrium is obtained. Observing the achieved equilibrium, workers migrate between
regions and choose industries in which to work, according to the differences in real wages.
Workers move to sectors that offer higher real wage rates in the same region and move to
regions that offer higher real wages within the same country. As a result, another
distribution of workers and economic activities emerges. With this new distribution and
predicted population growth, the next short-run equilibrium is obtained for the following
year and counted in terms of migration speed, where we again observe migration. These
computations are repeated for typically 20 years, e.g., from 2010 to 2030.
Figure 4: Simulation Procedures
Source: Isono et al. (2015)
2. Scenarios
alternative scenarios (Figure 5). The baseline scenario assumes minimal additional
infrastructure development after 2010. The alternative scenario assumes the completion
of corridors in 2020 and beyond. We compare and show the differences between GDP
(for countries) or GRP (for sub-national regions), based on alternative scenarios, against
GDP (for countries) or GRP (for sub-national regions) of baseline scenarios for the year
2030. If a country/region under alternative scenarios has a higher (or lower) GDP/GRP
than under the baseline scenario, then we regard this surplus (or deficit) as a positive (or
negative) economic impact of the corridor developments.
Figure 5: Evaluation of Economic Impacts by Countries or Sub-national Regions
Source: Adapted from Isono and Ishido (2016)
In the baseline scenario, we assume a kind of business-as-usual situation. The
following assumptions are maintained in all scenarios, including the baseline case, even
if they are not explicitly states in a specific scenario:
• The national population of each country is assumed to increase at the rate forecasted
by the United Nations Population Division until 2030.
• International labor migration is prohibited.
• Tariffs, non-tariff barriers, and services barriers change based on FTA/economic
partnership agreements (EPAs) currently in effect and according to the phased-in
tariff reduction schedule by the FTAs/EPAs and Hayakawa and Kimura (2015).
• We give different exogenous growth rates for the technological parameters for each 2010
2020
Baseline Scenario Alternative Scenario
2030 GDP’ or GRP’/ GDP or GRP
country to calibrate the GDP growth trend from 2010 to 2020, which is estimated
and provided by the International Monetary Fund.
It should be noted that even if trade and transport facilitation measures negatively
impact a region’s economy according to the simulation scenario, this does not necessarily
mean that the region is worse off than the current situation. Most of the countries in Asia
are expected to grow faster in the next few decades and the negative economic impacts
offset part of the gains from the expected economic growth. For any alternative scenario,
we change the settings relating to the logistics infrastructure and/or other parameters
pertaining to trade and production.
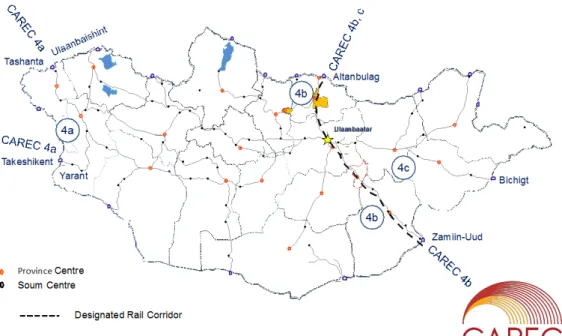
Figure 6 shows the three economic corridors that are simulated in this paper, namely,
CAREC 4a, 4b, and 4c corridors. CAREC Corridor 4a connects China and Russia through
the western part of Mongolia. In this scenario, we suppose that the road specified as
CAREC Corridor 4a are implemented and completed in 2020. CAREC Corridor 4b
connects China and Russia through Ulaanbaatar, the capital of Mongolia. In this scenario,
we suppose that the road specified as CAREC Corridor 4b is implemented and completed
in 2020. CAREC Corridor 4c connects Bichig and Ulaanbaatar. In this scenario, we
suppose that the road specified as CAREC Corridor 4c is implemented and completed in
2020. We also run an “All” scenario to implement the three corridors specified above all
together and completed in 2020.
We suppose the following improvements are implemented along each corridor
specified above:
• Highway: Raise the average speed of the specified roads in the corridor from
19.25km/h to 38.5km/h
• Railway: Raise the average speed of the specified railways in the corridor from
19.1km/h to 40.0km/h
• Customs Facilitations: In addition to highway and railway development, we
conduct customs facilitation in the simulation by reducing by half the time and
Figure 6: Three Economic Corridors in Mongolia
Source: Ministry of Road and Transport of Mongolia
3. Results on the Simulation
3.1 Corridor 4a
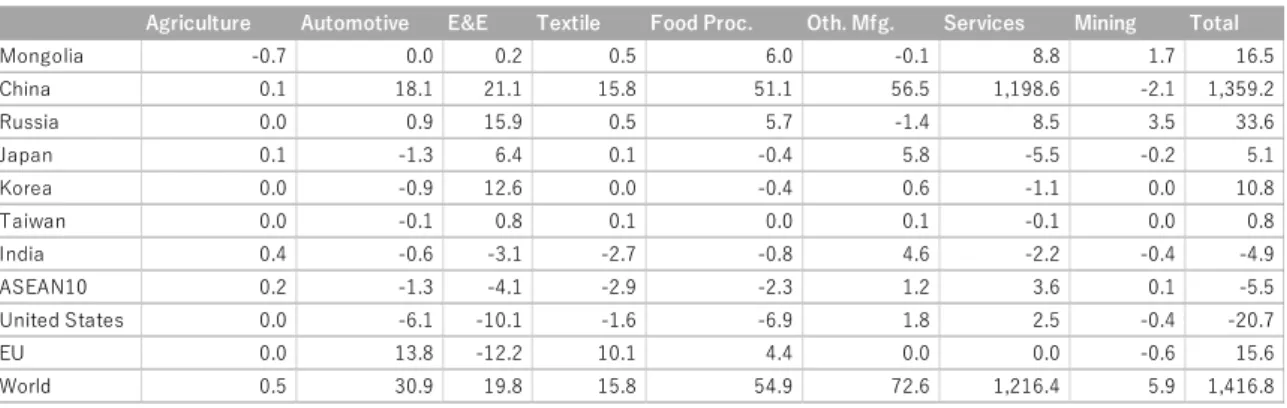
Table 1 shows the economic impacts by country and by industry for the Corridor 4a
scenario. For Mongolia, the economic impacts are highest in services (USD 8.8 million)
followed by the food processing industry (USD 6.0 million) and mining sector (USD 1.7
million). It should be noted that the impact is for the year 2030 and against the baseline
scenario. According to the model, the impact begins at the year of completion of
infrastructure in the alternative scenario or 2020 for the Corridor 4a scenario, and
continues onward. The total impact should be considered as an aggregation of these
impacts. By country, China benefits most from Corridor 4a. Most of the economic impacts
come from services (USD 1,198.6 million) followed by the other manufacturing (USD
Table 1: Economic Impact of Corridor 4a (2030, against baseline, million USD)
Source: Estimated by IDE-GSM
Figure 7 shows the geographical representation of economic impacts from Corridor
4a in 2030 compared with the baseline scenario. Red (blue) regions have positive
(negative) impacts from the development, in terms of impact density in economic impacts
per square kilometer. For Mongolia, the economic impacts appear mainly in the western
side of the country. The positive economic impacts are observed in northeast and
northwestern China, whereas other parts of China have some negative impacts from the
development.
Figure 7: Economic Impact of Corridor 4a (2030, against baseline, impact density)
Source: Estimated by IDE-GSM
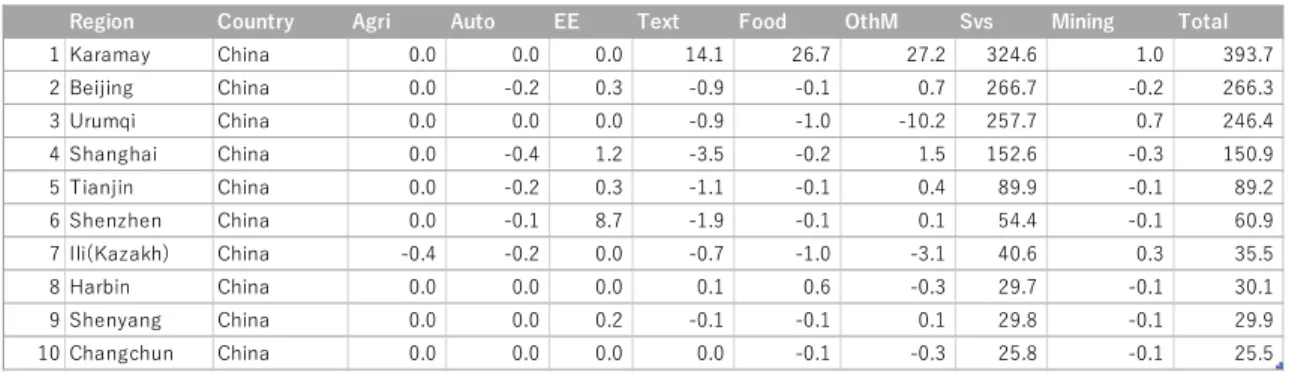
region most benefited from Corridor 4a is Karamay, China, with the impacts of USD
393.7 million followed by Beijing, China (USD 266.3 million) and Urumqi, China (USD
246.4 million). No Mongolian region appeared on the top 10 list. For most regions the
positive impacts are forecasted in services, although, positive impacts are expected in
textile, food, and other manufacturing in the top gainer region, Karamay in China.
Table 2: Top 10 gainers from Corridor 4a (2030, against baseline, million USD)
Source: Estimated by IDE-GSM
3.2 Corridor 4B
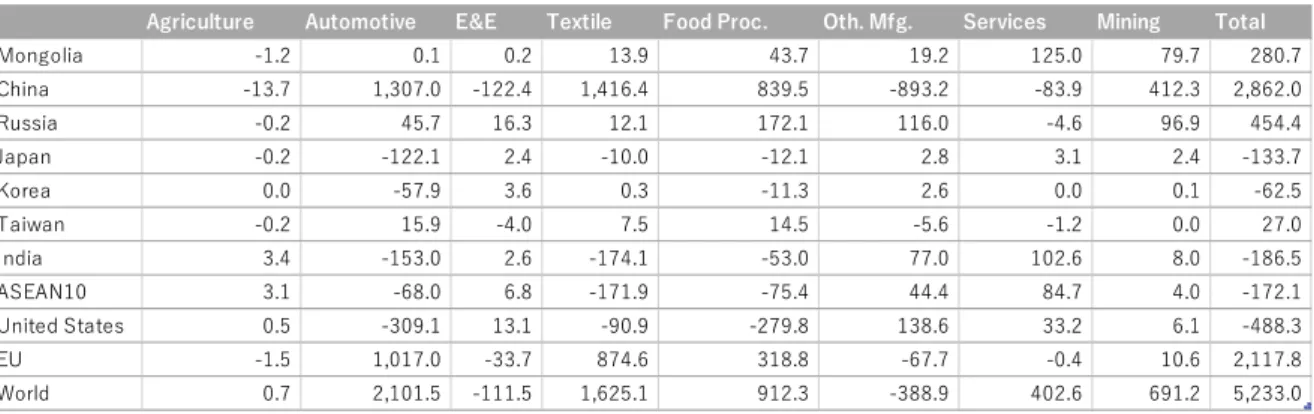
Table 3 shows the economic impacts by industry for the Corridor 4b scenario. The
total global impacts of the Corridor 4b scenario are about five times larger than that of
the Corridor 4a scenario in 2030. The impact for Mongolia is also relatively large, next
only to China, the EU, and Russia among selected countries and regions in Table 3. For
Mongolia, the economic impacts are highest in services (USD 125.0 million) followed by
the mining sector (USD 79.7 million) and the food processing industry (USD 43.7
million). In other words, while benefits for Mongolia are mainly expected in services in
the Corridor 4a scenario, substantial impacts are also forecasted for manufacturing and
mining industries in the Corridor 4b scenario. In simulation analyses using IDE-GSM in
general, positive impacts on manufacturing are often forecasted on infrastructure that
locates in or connects with the capital city of a country, which in turn tends to host a larger
share of non-agricultural activities. By country, the economic impacts are the largest for
China (USD 2,862.0 million) followed by the EU (USD 2,117.8 million) and Russia
(USD 454.4 million). Furthermore, negative impacts are forecasted for Japan, Korea,
Table 3: Economic Impact of Corridor 4b (2030, against baseline, million USD)
Source: Estimated by IDE-GSM
Figure 8 is a geographical representation of economic impacts from Corridor 4b in
2030 compared with the baseline scenario. For Mongolia, the economic impacts appear
mainly along the corridor. The positive economic impacts are observed in north to east
China, whereas other parts of China have some negative impacts from the development.
The regions along the Trans-Siberian Railway in Russia benefit from the corridor. At a
glance, the positive impacts are forecasted along Corridor 4b, where one branch stretches
southward to the southern coastline of China and the other extends westward all the way
to the western part of Russia.
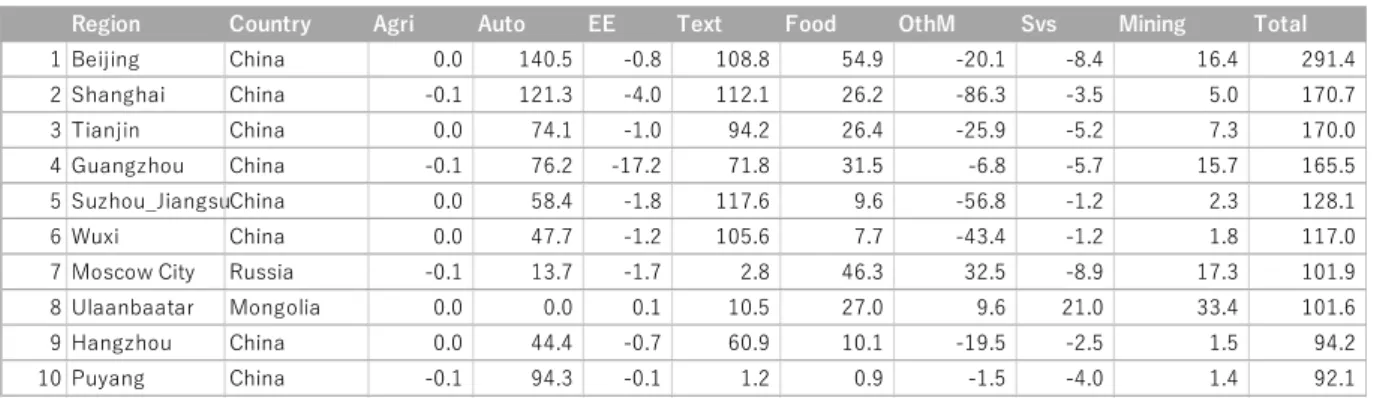
Table 4 shows the top 10 gainer regions under the Corridor 4b scenario. The region
most benefited from the corridor is Beijing, China, with the impact of USD 291.4 million
followed by Shanghai, China (USD 170.7 million) and Tianjin, China (USD 170.0
million). Nonetheless, Mongolian regions, namely, Ulanbaatar, placed 8th with the
impacts of USD 101.6 million. If one focuses on services, then the impacts are highest in
the Mongolian capital city of Ulaanbaatar while the rest of the top 10 gainer regions
expect negative impacts. Impacts on the mining and food industries are also relatively
Figure 8: Economic Impact of Corridor 4b (2030, against baseline, impact density)
Source: Estimated by IDE-GSM
Table 4: Top 10 gainers from Corridor 4b (2030, against baseline, million USD)
Source: Estimated by IDE-GSM
3.3 Corridor 4C
Table 5 shows the economic impacts by industry for the Corridor 4c scenario. This
scenario involves Ulaanbaatar, the capital city of Mongolia, so one may expect relatively
large impacts for Mongolia, as stated in the previous section. The result suggests that the
aggregated impact by country is relatively large in Mongolia among selected countries
and regions in Table 5, though far behind China. For Mongolia, the economic impacts are
the highest in services (USD 25.7 million) followed by mining sector (USD 9.9 million)
and the food processing industry (USD 9.6 million). For China, the economic impacts are
the highest in services (USD 385.0 million) followed by other manufacturing (USD 61.6
Table 5: Economic Impact of Corridor 4c (2030, against baseline, million USD)
Source: Estimated by IDE-GSM
Figure 9 is a geographical representation of economic impacts from Corridor 4c in
2030 compared with the baseline scenario. For Mongolia, the economic impacts appear
mainly in the eastern part of the country. The positive economic impacts are observed in
northeast China and Xinjiang Uyghur Autonomous Region, whereas other parts of China
have slightly negative impacts from the development. At a glance, the impacts forecasted
along Corridor 4c extend eastward to the northeastern part of China and, to a lesser extent,
to western Mongolia.
Table 6 shows the top 10 gainer regions by Corridor 4c. Karamay, China, gains most
from the development, with the impacts of USD 171.9 million. The second largest
impacts are on Urumqi, China (USD 158.1 million) then Harbin, China (USD 87.3
million).
Source: Estimated by IDE-GSM
Table 6: Top 10 gainers from Corridor 4c (2030, against baseline, million USD)
Source: Estimated by IDE-GSM
3.4 All Corridors
Table 7 shows the economic impacts by industry for the All Corridors scenario. For
Mongolia, the economic impacts are highest in services (USD 155.5 million) followed by
the mining sector (USD 85.6 million) and food processing industry (USD 51.4 million).
By country, China (USD 4,889.1 million) has the largest positive impacts from the
development and the EU (USD 2,094.8 million) follows. By industry, the textile and
automotive sectors in China and the EU benefit most followed by services and the food
processing sector.
Table 7: Economic Impact of All Corridors (2030, against baseline, million USD)
Source: Estimated by IDE-GSM.
in 2030 compared with the baseline scenario. For Mongolia, most of the regions benefit
from the development. The positive economic impacts are observed in north to east China
as well as Xinjiang Uyghur Autonomous Region, whereas other parts of China have some
negative impacts from the development. The regions along the Trans-Siberian Railway in
Russia benefit from the corridor.
Table 8 shows the top 10 gainer regions by the All Corridors scenario. Karamay,
China, gains most from the scenario, with the impact of USD 480.4 million. The next
largest impacts are on Beijing, China (USD 469.1 million) then Urumqi, China (USD
439.6 million). For Mongolian regions, Ulanbaatar placed 8th with the impacts of USD
109.4 million.
Figure 10: Economic Impact of All Corridors (2030, against baseline, impact density)
Source: Estimated by IDE-GSM
Table 8: Top 10 gainers from All Corridors (2030, against baseline, million USD)
4. Analysis and Policy Implications
Table 9 compares the economic impacts by country and scenario. For Mongolia, the
economic benefits are the largest for the All Corridors scenario (USD 325.0 million).
Among the three corridors, the economic impacts are the largest for Corridor 4b (USD
280.7) followed by Corridors 4c (USD 47.8 million) and 4a (USD 16.5 million). The
economic impacts for Corridor 4b are the largest for China (USD 2,862.0 million) and
the EU (USD 2,117.8 million) as well as Russia (USD 454.4 million). The development
of Corridor 4b benefits a large number of countries and is, thus, eligible to be developed
as an international development project with China, the EU, and Russia.
Table 9: Economic Impact by scenario (2030, against baseline, million USD)
Source: Estimated by IDE-GSM
As provided in Table 3, the development of the corridor benefits automotive and
textile industries most, especially for China and the EU. Utilization of the Trans-Siberian
Railway seems to be a key; thus, the cooperation of Russia is also indispensable. For
Mongolia, the service sector and food processing and textile industries seem to have some
potential to benefit from the corridor. The industrial development policy for these sectors
may complement the Corridor 4b project to unlock the potential.
For Corridor 4a, most of the economic benefits go to China; thus, China may have
Mongolia, thus the cooperation of these two countries might be desirable for the
development.
5. Conclusion
In this paper, we tried to estimate the economic impacts of Corridors 4a, 4b, and 4c
projects by IDE-GSM, a computational general equilibrium model based on spatial
economics. The estimation results show that the economic impacts are the highest for
Corridor 4b compared with the other two corridors. The economic impacts of Corridor
4b are large for China, the EU, and Russia, other than Mongolia; therefore, cooperation
including these four parties might be a suitable arrangement for the development.
The evaluation of large-scale economic corridor developments is not very easy
without a proper tool like IDE-GSM. This paper shows the usefulness of this
simulation-based policy analysis and we hope the analyses provided here will be valuable input to
References
Bosker, M., Brakman, S., Garretsen, H., Schramm, M., 2010. Adding geography to the
new economic geography: bridging the gap between theory and empirics. Journal of
Economic Geography, 10(6), 793-823.
Cormen, T.H., Leiserson, C.E., Rivest, R.L., Clifford, S., 2001. Introduction to
Algorithms, MIT Press.
Fingleton, Bernard. 2006. The new economic geography versus urban economics: an
evaluation using local wage rates in Great Britain. Oxford Economic Papers 58.
501-530.
Fujita, M. and Mori, T. 2005. Frontiers of the New Economic Geography. Journal of
Public Economic Theory 5, 279-304.
JETRO. 2013. Zai-Azia-Oseania Nikkei Kigyo Gittai Chosa
(http://www.jetro.go.jp/jfile/report/07001539/0700153901a.pdf)
Head, K., and Mayer, T. 2000. Non-Europe: the magnitude and causes of market
fragmentation in the EU. Weltwirtschaftliches Archiv, 136(2), 284-314.
Hummels, D., 1999. Toward a geography of trade costs. GTAP Working Paper No. 17.
Isono, I., Kumagai, S., Hayakawa, K., Keola, S., Tsubota, K., Gokan, T. 2016.
Comparing the economic impacts of Asian integration by computational
simulation analysis, IDE-Discussion Paper No. 567.
Isono, I., and Ishido, H. 2016. Service liberalization in Lao PDR (No. 559). Institute of
Developing Economies, Japan External Trade Organization (JETRO).
Krugman, P. 1991. Increasing Returns and Economic Geography, Journal of Political
Economy, 99, 483-99.
Krugman, P. 1993, On the number and location of cities. European Economic Review,
37(2), 293-298.
Kumagai, S., K. Hayakawa, I. Isono, S. Keola and K. Tsubota. 2013. Geographical
Simulation Analysis for Logistics Enhancement in Asia. Economic Modelling 34,
145–153.
Kumagai, S., and Isono, I. 2011. Economic Impacts of Enhanced ASEAN-India
The Comprehensive Asia Development Plan, Phase II.
Nihon Kaiun Shukaijo. 1983. Distance Tables for World Shipping (Eighth edition).
Nihon Kaiun Shukaijo.
Puga, D. 1999. The rise and fall of regional inequality. European Economic Review 43,
303-334.
Stelder, D., 2005. Where do cities form? A geographical agglomeration model for
Europe. Journal of Regional Science, 45(4), 657-679.
Teixeira, A. C. 2006. Transport policies in light of the new economic geography: The