2017〜2019年度 関西大学研究拠点形成支援経費研 究成果報告書
著者 工藤 宏人, 宮前 翼, 上田 正人, 村山 憲弘, 林
順一, 松岡 光昭, 横山 佳帆, 大倉 滉平, 内藤 牧 男, 下山 大輔, 関谷 亮, 灰野 岳晴, 池田 勝彦, 森 重雄, 土井 研児, 北垣 壽, 寺内 俊太郎, 五十 井 浩平, 白杉 文香, 丸山 徹, Tamaki
Mitsuyoshi, Nakamura Keisuke, Nakamura Gou, 齋 藤 隆太, 仲村 利樹, 柳谷 仁志, Sakai Takahiro, 中本 光二, 山口 莉嘉, 藤田 智香, 福永 真理, 塩 月 康平, 竹田 紘也, 山本 洋揮, 古澤 孝弘, 渡邊 健夫, 大隈 修, 前 一廣, 鈴木 一誓, 柿沼 綾子, 小俣 孝久, 坂本 貴則, 今坂 怜史, 石井 甫泰, 荒 木 貞夫, 山本 秀樹, 大堀 静也, 小川 大貴,
Kitagawa Kouta, 関 あずさ, Sonoc Alexandru, Jeswiet Jacob, 芝田 隼次
発行年 2020
権利 2‑1 ネットワークポリマー事務局の許諾を得て公開
しています。
2‑4 日本金属学会の許諾を得て公開しています。
2‑6 This is a post‑peer‑review, pre‑copyedit version of an article published in
International Journal of Metalcasting. The final authenticated version is available online at
http://dx.doi.org/10.1007/s40962‑019‑00310‑7.
2‑7 This is a post‑peer‑review, pre‑copyedit version of an article published in
International Journal of Metalcasting. The final authenticated version is available online at:
http://dx.doi.org/10.1007/s40962‑018‑00292‑y.
2‑13 This is the accepted version of the article, which has been published in final form at DOI 10.1016/j.micromeso.2018.07.005.
2‑14 (C)フォトポリマー学会 この資料は著者最終 ...
URL http://hdl.handle.net/10112/00020715
Title
INFLUENCE OF TELLURIUM ADDITION TO SPHEROIDAL GRAPHITE CAST IRON ON THE NUMBER OF GRAPHITE PARTICLES
Ryuta Saito1, Toru Maruyama*2, Toshiki Nakamura1, Hitoshi Yanagitani3, Takahiro Sakai3, Kouji Nakamoto3
1Graduate School of Kansai Univ., Dept. of Chemistry and Mater. Engineering, 3-3-35Yamate-cho, Suita, Japan
2Kansai Univ., Dept. of Chemistry and Mater. Engineering, 3-3-35 Yamate-cho, Suita, Japan
3Kurimoto Ltd., Kagaya Factory, 2-1-64 Izumi, Suminoe-ku, Osaka, Japan
*Corresponding address: [email protected]
Abstruct
Influences of magnesium content on the actions of tellurium to graphite nodule count and chilling tendency in spheroidal graphite cast iron is investigated. Casting samples with 30 mm in diameter were prepared by lab size induction furnace melting. On castings with two levels (0.020mass% and 0.035mass%) of magnesium content, tellurium content was changed from 0 to 45 mass ppm. With additions of small amount of tellurium, the graphite nodule count increases and the chill ratio decreases. In the 0.020mass%Mg samples, the deterioration of the spheroidal shape is intensified with excess content of tellurium, and the critical amount is 20 mass ppm. In the 0.035mass%Mg samples, the chilling tendency become pronounced as the tellurium content is larger than the critical content of 24 mass ppm, even though the degree of spheroidization is sufficiently large. The cooling rate of the 0.035mass%Mg sample with 10ppmTe decreases at the beginning of the eutectic reaction, and there was no chill in the microstructure with the maximum graphite nodule count. Although it is rarely found by EPMA (electron probe microanalyzer) analysis, inclusions in the center of a spheroidal graphite consist of Mg, Ca, S and Te.
keywords
Spheroidal graphite cast iron, graphite particles, Tellurium, Magnesium, spheroidization, chilling tendency
Introduction
It is known that the action of tellurium in cast iron is spheroidization inhibition [1] and chilling [2, 3] like sulfur, and there are few cases where it is positively added to cast iron. Horie [1] reports that tellurium inhibits spheroidization because it consumes magnesium as a spheroidizing element, like sulfur. Furthermore, it is considered that the reactions to consume magnesium are formation
reactions of MgS in the case of sulfur and MgTe in the case of tellurium.
On the other hand, sulfur in a spheroidal graphite cast iron is an important element, and if sulfur content in cast iron is too high, it will inhibit spheroidization. However, if the content is, it too little will cause the number of graphite particles to decrease and the chill amount to increase [4]. That is, sulfur is a essential element for increasing the number of graphite particles. Since tellurium is a homologous element with sulfur in the periodic table, its action is expected to be similar to sulfur.
However, there is almost no report on the influence of tellurium on the number of graphite particles in spheroidal graphite cast iron.
Nakamura, el al. reported the results of investigating the number of graphite particles in a spheroidal graphite cast iron sample to which a small amount of tellurium was added by permanent mold casting [5]. According to the report, the number of graphite particles decreased with increasing tellurium content after being increased, and the tellurium content with the maximum number of graphite particles decreased as the magnesium content increased. In this study, we report the results of casting experiments to clarify the influence of tellurium on the number of graphite particles in spheroidal graphite cast iron cast into a sand mold whose cooling rate is slower than that of a permanent mold.
Experimental procedure Sample preparation
Table 1 shows the nominal compositions of the sample. The nominal composition of the sample is Fe -3.6%C -1.7%Si -0.3%Mn (% is all mass%), and the target amount of Mg is 0.035 mass%
(Hereafter these samples are described as 0.035 Mg) and 0.020 mass% (Hereafter these samples are described as 0.020 Mg).The target amount of tellurium was set to 10 ppm, 20 ppm, 30 ppm and 40 ppm. As raw materials, electrolytic iron, Fe - 75% Si alloy, pure manganese and a carburizing agent were used, and granular pure tellurium was used as tellurium additive. As inoculant, an Fe - 70.6%
Si - 1.6% Ba - 1.4 Ca% alloy was used. An Fe -44.8%Si -5.2%Mg -2%RE alloy was used as a spheroidizing agent.
A 30 kVA high frequency induction furnace was used for melting. The total amount of molten metal was 4.0 kg, and the tapping temperature was 1550 ° C. A sandwich method was used for spheroidizing treatment. The electrolytic iron, the Fe - Si alloy, the pure manganese and the
carburizing agent were heated in the melting crucible. The pure tellurium and the inoculant were added in a sandwich method together with spheroidizer. The amount of the inoculant was set at 0.3%
for the total molten metal amount. The temperature of the molten metal after the spheroidizing treatment was about 1350 ° C. The molten metal was poured into a sand mold (shell mold) to obtain φ 25 mm of a casting into which a K type thermocouple was inserted. A thermocouple of a wire diameter of 0.2 mm covered with a quartz tube having about 3mm in outer diameter was installed at a center position in the casting diameter direction and at 60 mm from the bottom surface of the mold.
Sample evaluations
The optical microstructures in the cross section of the fabricated sand molded castings were observed. The number of graphite particles, the spheroidization ratio, and the chill structure ratio were measured. Graphite morphology was observed from the microstructure without etched and the matrix structure was observed from the microstructure etched by 3% Nital. For the measurement the graphite particle number, the graphite particles having over 5μm in an equivalent-circle diameter in an optical microstructure without etching magnified 50 times were measured. According to JIS G 5502 (equivalent to ISO 1083), the spheroidization ratio was measured. The chill structure ratio was measured from etched microstructure. For measurements of the graphite particle number, the spheroidization ratio and the chill structure ratio, 6 pictures of microstructure a magnified 100 times were measured. Elemental distribution in a spheroidal graphite was investigated using an electron probe microanalyzer (EPMA). Measured elements were Fe, C, Si, S, Mg, Ca and Te. The process of solidification was analyzed from the cooling curve during solidification and the cooling rate curve differentiated with respect to time.
Results and Discussion Chemical composition
Table 2 shows the chemical compositions of the samples. The contents of Mg and Te were close to the target. Since the amount of the spheroidizing agent (Fe - Si - Mg - RE) for the 0.035Mg samples was larger due to the target amount of Mg, the contents of Ce and La in the 0.035 Mg samples was larger than those in the 0.020 Mg samples.
Optical microstructure
Fig. 1 shows the optical microstructures without etching of as-cast specimens. The values in the 1st line in the figure shows the target Te amount, the values of left side in parentheses shows Te content in the 0.020 Mg sample and values of right side in parentheses shows Te content in the 0.035 Mg sample. In the 0.020 Mg sample, a tendency of slight increase in the number of graphite particles due to addition of Te was confirmed. It was also found that the graphite shape changed from the spherical shape to the compacted vermicular shape in the sample with 36ppm Te. It is considered that free Mg was consumed as a result of the addition of Te and therefore the amount of free Mg required for spheroidizing graphite was insufficient [1]. Morita et al. reported that the graphite shape of spheroidal graphite cast iron containing 0.054% Mg changed to non-spherical shape with 65ppm of Te content [6]. According to results of the 0.020Mg sample and Morita`s report, it is considered that the critical tellurium amount to inhibit spheroidization decreases with decreasing magnesium content. The number of graphite particles in the 0.035 Mg sample sharply increased with Te addition.
In the sample containing 10 ppm of Te, the number of graphite particles became the maximum. The number of graphite particles decreased drastically in samples with Te content of 24 ppm or more. In the 0.035Mg sample, since the graphite shape did not change from the spherical shape, the optimum Te amount for the Mg amount of 0.035mass% is about 10ppm due to the maximum number of graphite particles, and graphitization inhibition might occur more than 35ppm of Te content. The optical microstructure with etching of the as-cast specimens are shown in Fig. 2. In the 0.020 Mg sample, a very small amount of chill was observed regardless of the Te content. In these samples, it is considered that there is almost no influence of tellurium on the chill amount.In the 0.035 Mg sample, it was revealed that the amount of chill was reduced with the addition of a small amount of Tellurium. Also, in the 10ppm sample involving the maximum number of graphite particles, almost no chill structure was observed. When the tellurium content was 24 ppm or more, the chill amount increased with increasing Te content, and in the sample containing 35ppm of tellurium, a large amount of chill structure was observed. As results in Figs.1 and 2, in 0.035 mass% Mg, adequate tellurium content was 10 ppm and the content larger than 24 ppm was excessive. Morita et al.
reported bull's eye structures were observed in the samples containing 0.045% of Mg and 50 to 1000 ppm of Te, However in the samples containing 0.056% of Mg, it was reported that spheroidal graphite, quasi-flake graphite and cementite were observed [6]. The tellurium amount to inhibit graphitization may depend on the amount of magnesium.
Thermal analysis
The thermal analysis curve of the Te free 0.035 Mg sample is shown in Fig.3. Two peaks were observed in the cooling rate curve in Fig.3(b). The release of heat involving the first peak at 1152℃
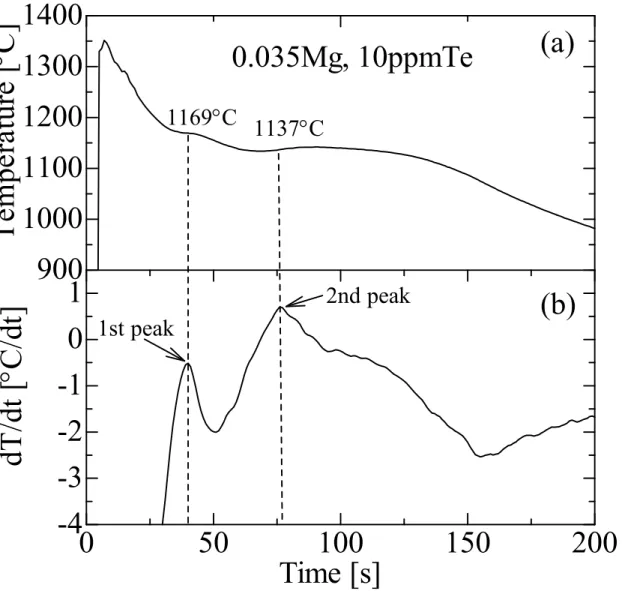
was due to austenite crystallization. The release of heat involving the second peak at 1125℃ was due to the stable eutectic solidification (austenite and graphite) and the metastable eutectic solidification (austenite and cementite). Fig.4 shows the thermal analysis curve of 0.035Mg sample containing 10ppm of Te. As well as the Te free sample, two peaks were observed in the cooling rate curve in Fig.4(b). The first peak was at 1169 ° C, and it may correspond to the start of the primary autenite solidification because it is higher than the eutectic temperature. The second peak was at 1137 ° C, which may correspond to the stable eutectic solidification though the temperature was lower than the equilibrium temperature because almost no chill was observed from the microstructure in Fig. 2. The cooling rate at the second peak showed a positive value, corresponding to temperature rise due to the recalescence. From a shape of the cooling rate curve, it is considered that the eutectic solidification time was relatively long because the convex width in this peak is large.
It is suggested that a large amount of graphite was crystallized during the eutectic solidification, and this result agrees with the result that the graphite particle number was large as showed in Fig.2. Fig.5 shows the thermal analysis curve of 0.035Mg sample containing 35 ppm of Te. As well as in Figs.
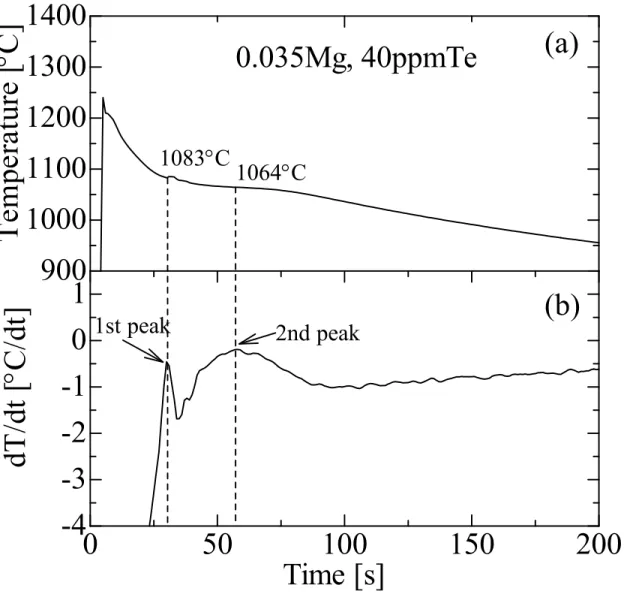
4 and 5, two peaks due to latent heat release were observed in the cooling rate curve. The temperatures of the first and second peaks were 1083 ° C and 1064 ° C, respectively, which were considerably lower than the equilibrium eutectic temperature. Because of a large amount of cementite in the microstructure, it is considered that the second peak with the latent heat release may show latent heat release due to the metastable eutectic solidification. The first peak may be correspond to be latent heat release due to primary austenite solidification or the eutectic solidification of austenite and graphite.
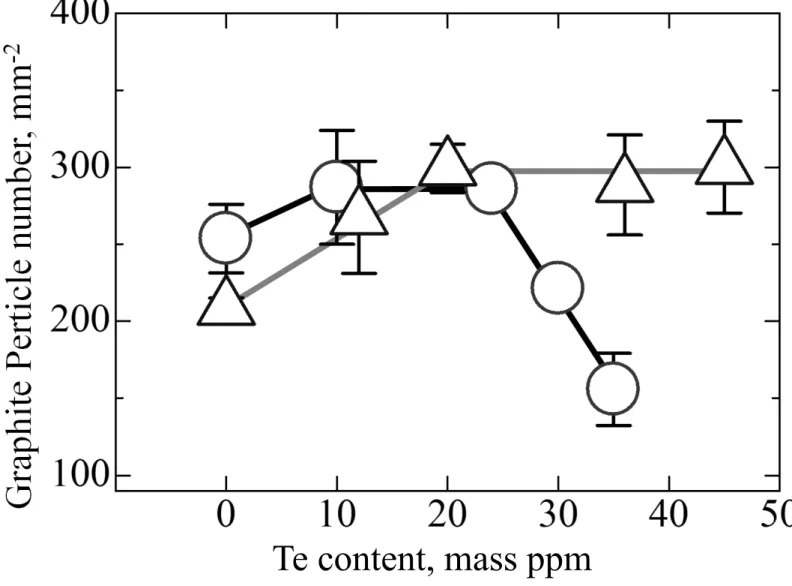
Graphite particles number
The influence of tellurium content on the number of graphite particles is shown in Fig.6. In the 0.020 Mg sample with a tellurium content less than 20 ppm, the number of graphite particles increased with increasing tellurium content. Further containing tellurium, the number of graphite particles was almost constant as the increase in the tellurium content. In the 0.035 Mg sample, the number of graphite particles increased with increasing tellurium content when the tellurium content
was up to 24 ppm Te. However, further containing tellurium, the number of graphite particles decreased, and the number was lower than that of the tellurium free sample. As shown in Fig. 2, in the 0.035 Mg sample, the number of graphite particles decreased as excess content of tellurium, and theresult agrees with the reports that the excessive content of tellurium causes chilling.
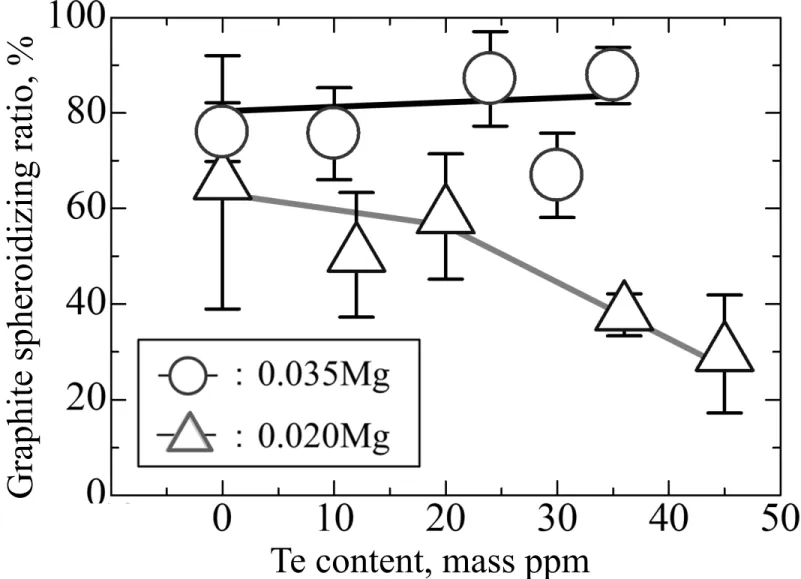
Graphite spheroidization ratio
The influence of tellurium content on graphite spheroidization ratio is shown in Fig.7. In the 0.020 Mg sample, the graphite spheroidization ratio decreased with increasing tellurium content. When the tellurium content exceeded 35 ppm, the decrease tendency became remarkable. A dissolved amount of Mg contributing graphite spheroidization may be no enough due to comsuming Mg as forming [1]. In the 0.035 Mg sample, although there was some variation in the measurement results, almost no decrease in spheroidization ratio due to Te addition was confirmed. With a tellurium content of 35ppm, the number of graphite particles was less than half that of other samples, even though most graphite was spherical. Although it is considered that tellurium consumes dissolved magnesium, the critical amount of tellurium that inhibits spheroidization may be large according to the increment in magnesium content. The graphite spheroidization ratio tended to slightly increase as the tellurium content increases, however it may be the result that the spherical graphite ratio was estimated as a low value by coalescing spheroidal graphite in some samples with a large number of graphite particles.
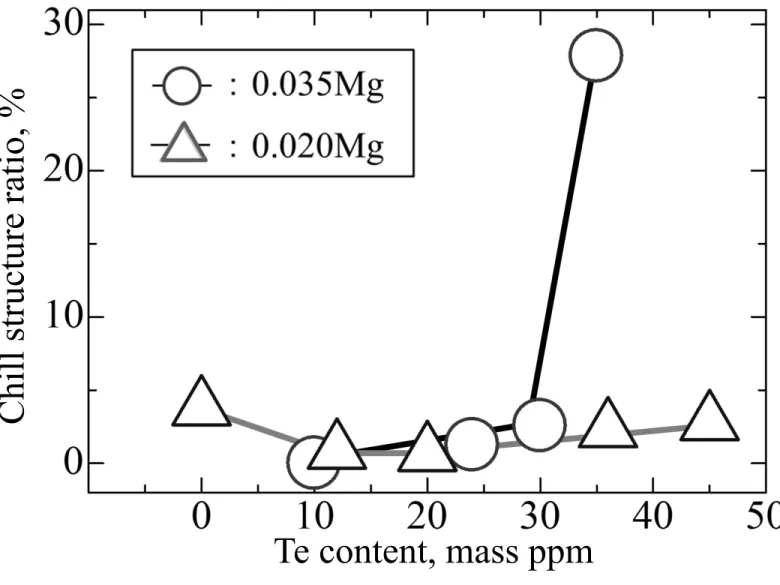
Chilling tendency
The influence of tellurium content on chill amount is shown in Fig.8. In the 0.020 Mg sample, the chill amount in the tellurium-free sample was about 5%. In the tellurium content less than 20 ppm, the chill amount decreased as the content of tellurium increased. In the tellurium content larger than 20 ppm, the chill amount increased with increasing tellurium content, and in the sample with 45 ppm of tellurium content, the chill amount was about 5% as well as the tellurium-free sample.
Although the number of graphite particles in the sample with tellurium content of 20 ppm or more was almost constant, the chill amount increased with increasing tellurium content. In tellurium content larger than 20 ppm, it is considered that the influence of inhibiting graphitization as well as spheroidizing inhibiting is caused in the 0.020Mg sample. In the 0.035 Mg sample, there was no data of the tellurium-free sample because of missing, but its chill amount seems to be almost same
amount as well as in the 0.020 Mg sample based on the result in Fig.3. As the tellurium content increased to 10 ppm, the chill amount was eliminated. However, the chill amount gradually increased with further addition of tellurium, and in the sample with the tellurium content of 35 ppm, the chill amount rapidly increased and the chill occupied about 30% in the microstructure.
Regardless of the amount of magnesium, if the tellurium content increases beyond a crytical amount, the chilling tendency is actualized, and it is considered that the larger spheroidizing ratio, the tendency is developed the more strongly.
Tellurium in graphite
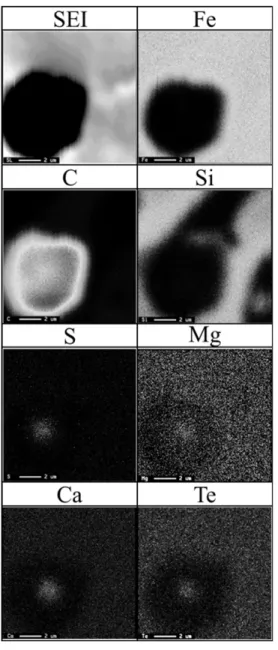
Fig.9 shows the presence of tellurium in a spherical graphite of the 10ppmTe sample with the maximum number of graphite particles in the 0.035Mg sample. Since it is infrequent for inclusions to be found on the surface of cutting plane, the permanent mold casting samples [5] with graphite particles larger than those in the sand mold casting samples were investigated. Ca, S, Te, and Mg were presented in the spherical graphite center. Although it cannot be concluded that MgTe is formed from this result, it is suggested that tellurium exists as a composit compound of MgTe, MgS, CaTe and CaS. This result supports the report that Te becomes MgTe and consumes Mg. On the other hand, inclusions in graphite were rarely observed, and further investigation is required to understand whether or not the composite compound of tellurium becomes a graphite nucleation site.
Conclusions
As tellurium-additions to spheroidal graphite iron cast in permanent molds was reported to increase the number of graphite particles, sand mold casting experiments were carried out to understand whether the graphite particle number increases as well. The magnesium content in the samples was set at two levels of about 0.020 mass% and about 0.035 mass%, and the tellurium content was changed from 0 to about 40 ppm. The following conclusions were obtained.
1. Regardless of the magnesium content, the addition of a small amount of Te increases the number of graphite particles. However, when the Te content was excessive, spheroidization inhibition occurred in the 0.020 mass% Mg sample, and in the 0.035 mass% Mg sample, the number of the graphite particles decreased and the chilling tendency is developped.
2. The number of graphite particles in the 0.020 mass% Mg samples increases with increasing
tellurium content less than 20 ppm. With further tellurium content, the number of graphite particles is almost constant. In the 0.035 mass% Mg samples, the number of graphite particles of the sample containing from 10 ppm to 24 ppm of tellurium increases with increasing tellurium content, however further tellurium content, the number decreases and becomes lower than that of the tellurium-free sample.
3. In 0.020 mass% Mg samples the graphite spheroidization ratio decreases with increasing tellurium content. As the tellurium content exceeds 20 ppm, the spheroidization ratio becomes less than 40%. The spheroidization ratio in the 0.035 mass% Mg samples was about 80% regardless of the tellurium content, and almost no influence on the spheroidization ratio by Te addition was confirmed.
4. The amount of chill in the 0.020 mass% Mg samples containing 20 ppm of tellurium is lower than that in the tellurium-free sample. However, in the samples with a higher tellurium content, the amount of chill increased with increasing tellurium content, and in the sample with tellurium content of 45 ppm, the amount of chill was almost the same as that in the tellurium free sample. In the 0.035 mass% Mg sample, the chill almost was eliminated by adding Te of 10 ppm. However, further tellurium content, the chill amount increased with tellurium content, and in the sample containing 35 ppm of tellurium, the chill structure occupied about 30% of the sample.
5. Ca, S, Te, and Mg were detected from a part of the spherical graphite center in the sample containing 0.042 mass% of Mg and 10 ppm of Te.
References
[1] H. Horie, IMONO, 47, 836 (1975).
[2] S. Maekawa, T. Yamashita, IMONO, 29, 490 (1957).
[3] K. Taniguchi, Tetsu-to-Hagané, 18, 952 (1932).
[4] Y. Igarashi, H. Nakae, J. JFS, 74, 30 (2002).
[5] T. Nakamura, R. Saito, T. Maruyama, H. Yanagitani, T. Sakai, K. Nakamoto, Report of the 168th JFS Meeting, 168, 55 (2016).
[6] S. Morita, R. Ozaki, N. Iyama, Y. Nazasaka, Tetsu-to-Hagané, 43, 206 (1957).
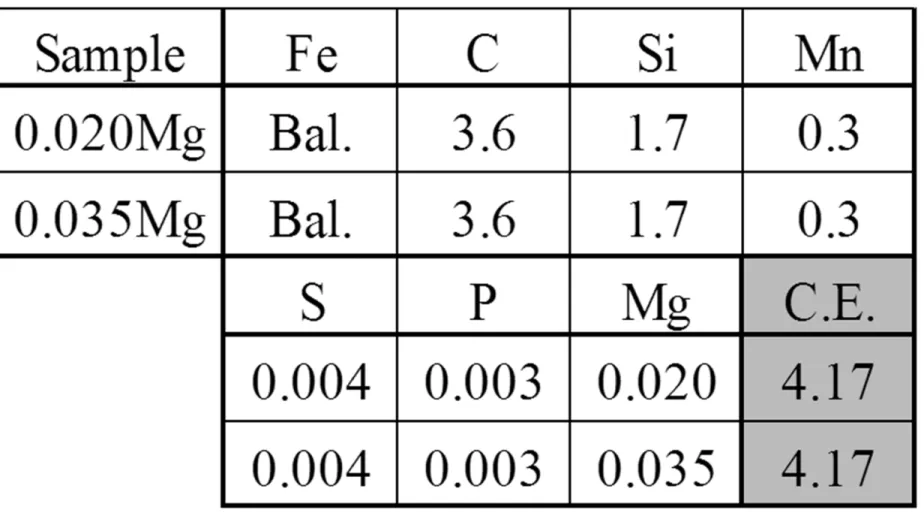
Table 1 Target compositions of cast iron sample (mass%) .
Sample Fe C Si Mn
0.020Mg Bal. 3.6 1.7 0.3 0.035Mg Bal. 3.6 1.7 0.3
s p Mg C.E.
0.004 0.003 0.020 4.17
0.004 0.003 0.035 4.17
Table 2 Chemical compositions of cast iron sample (mass%).
*
Reference values due to 10ppm order in assy precision.
Sample Fe C Si Mn p
s
Mg0.020Mg Te free Bal 3.66 1.65 0.29 0.004 0.0051 0.023
0.020Mg l0ppmTe Bal 3.61 1.56 0.30 0.003 0.0045 0.022
0.020Mg 20ppmTe Bal 3.67 1.50 0.31 0.003 0.0044 0.022
0.020Mg 30ppmTe Bal 3.60 1.61 0.28 0.003 0.0043 0.020
0.020Mg 40ppmTe Bal 3.61 1.70 0.31 0.003 0.0043 0.022
0.035Mg Te free Bal 3.57 1.60 0.30 0.003 0.0040 0.039
0.035Mg l0ppmTe Bal 3.52 1.69 0.26 0.004 0.0031 0.042
0.035Mg 20ppmTe Bal 3.71 1.59 0.26 0.004 0.0031 0.038
0.035Mg 30ppmTe Bal 3.54 1.58 0.25 0.004 0.0033 0.032
0.035Mg 40ppmTe Bal 3.79 1.63 0.26 0.004 0.0030 0.037
Al Ce La Ba Ca Te
0.014 0.0106* 0.0069* 0.0005* 0.001
0.015 0.0097* 0.0061 * 0.0002* 0.001 0.0012*
0.012 0.0099* 0.0066* 0.0002* 0.001 0.0020*
0.023 0.0091 * 0.0065* 0.0002* 0.001 0.0036*
0.014 0.0097* 0.0061 * 0.0002* 0.001 0.0045*
0.025 0.0183* 0.0119* 0.0002* 0.002
0.054 0.0166* 0.0090* 0.0004* 0.001 0.0010*
0.031 0.0170* 0.0110* 0.0004* 0.001 0.0024*
0.052 0.0153* 0.0094* 0.0004* 0.001 0.0030*
0.029 0.0178* 0.0103* 0.0005* 0.001 0.0035*
200μm
Fig.1 Influence of Te and Mg content of graphite structure in as-cast specimens.
No addition(-/-)
0
l0ppmTe (12/10) 20ppmTe (20/24) 30ppmTe (36/30) 40ppmTe (45/35)
. .
.. ..__,.
'... .
;••,
. ..
•~ -. · -~
.,·. -.. ...
:- -~ .. r.~ . . ··"·• ..
••• ; .• , .·--:.--· ·f• .... , . . : . ' • ~ .• -• .,.. • 111. ' • :· .. ' -· .•
·
. ....
:,... - . • · .
. .. .
.
-.
..
-·
.
.. . ... - ...
~. - .
· ...
. • • .;
•: _ .
..
-~ t .... . ...
,-.
....· _.,· ... ... ~ - ·
.· '
.· - ... . ...
..-
·.. ~-
....
,_...
. -.,::,
...
'-. "
· ....
:•.. . ,,. .... . . .
-.,
:. .
• •• • <' ,r • • ,.•
...
. -~ (I..' .•. •
I ' • . ; . :..• •.. . 9 ,, •• · •
• -~~ . · · ~ -~· , . . ... . - -,!·•' .
"
.•;_;; '.'-: :·· .-r.t:~:.·· .:·-
.
.
·•·',..
... . ,. ·
..:·
-#.• ... ..·._.. • . : .•. • • .•
Fig.2 Influence of Te and Mg content of matrix structure in as-cast specimens.
100μm
No addition(-/-) l0ppmTe (12/10) 20ppmTe (20/24) 30ppmTe (36/30) 40ppmTe (45/35)
.
0
.
0
Fig. 3 Thermal analysis curve of Te free sample (0.035Mg, Te free) with 0.039mass% of Mg.
(a) Cooling curve, (b) Cooling rate curve.
900 1000 1100 1200 1300 1400
1152C
1125C
1st peak
(b)
0 50 100 150 200
-4 -3 -2 -1 0 1
Temp er atu re [ C] dT /d t [ C/ dt ] 2nd peak
Time [s]
0.035Mg, Te free (a)
I I I I I I I
~:
900 1000 1100 1200 1300 1400
1169 C 1137C
1st peak (b)
0 50 100 150 200
-4 -3 -2 -1 0 1
Temp er atu re [ C] dT /dt [ C/ dt ] 2nd peak
Time [s]
0.035Mg, 10ppmTe (a)
Fig. 4 Thermal analysis curve of 10ppmTe sample (0.035Mg. 10pmmTe) with 0.042mass% of Mg.
(a) Cooling curve, (b) Cooling rate curve.
I I I I I
~:
II I
I ~
900 1000 1100 1200 1300 1400
1083C 1064C
1st peak (b)
0 50 100 150 200
-4 -3 -2 -1 0 1 Temp er atu re [ C] dT /d t [ C/ dt ]
2nd peak
Time [s]
0.035Mg, 40ppmTe (a)
Fig. 5 Thermal analysis curve of 35ppmTe sample (0.035Mg, 40ppmTe) with 0.037mass% of Mg.
(a) Cooling curve, (b) Cooling rate curve.
I I I I
~:
IFig. 6 Influence of Te content on number of graphite particles.
Graphite Perticle number , mm -2
Te content, mass ppm
Graphite Perticle number, mm- 2 0
~0 N 0 w 0 ~ 0 Ul
~