Development of a Method for Analyzing the Regional Economic Cycle and Case Study
–a New Method for Analyzing Regional Economies in Regional Revitalization–
*Kiyoshi Yamasaki
PhD. (Engineering) Value Management Institute, Inc. (Development Bank of Japan Group), Public Consulting Business Section 4, Corporate Officer/Chief Consultant (e-mail: kiyoshi_yamasaki@vmi.co.jp)
Akiho Sahara
M.A. (Economics) Value Management Institute, Inc. (Development Bank of Japan Group), Public Consulting Business Section 4, Consultant
Katsuya Yamada
M.A. (Engineering) Value Management Institute, Inc. (Development Bank of Japan Group), Public Consulting Business Section 4, Consultant
Abstract
Because of the slump in Japan’s regional economies-mainly in the regional area-the national and local governments are implementing regional revitalization and other regional economic regeneration policies. There are two types of factors behind the slump in Japan’s regional economies: external factors, including the contraction of public-works projects and overseas relocation of plants, and an internal factor of the outflow of income in the three phases of production, distribution, expenditure. In this study, to consider measures for regional economies that are fully based on these factors, a method for analyzing the regional economies’ strengths, weaknesses, and inflows and outflows of income is proposed. This method of estimating income inflows and outflows is a new way of analyzing regional economies that estimates using data on dependents and territories. In this study, data on dependents and territories of municipalities throughout the country were created, and these
* This paper includes content reviewed by the Fiscal 2015 Regional Economic Cycle Analysis DBJ Expert Discussion Board (Chairperson, Professor Yoshio Higuchi, Keio University Faculty of Business and Commerce), and we received feedback and opinions containing a wealth of suggestions from members of the Expert Discussion Board: Professor Ryohei Nakamura, Okayama University; Professor Atsushi Koike, Kobe University; Professor Nobuhisa Sano, Head of the Research Center for Regional Economics, Kushiro Public University of Economics; and Professor Tomoyoshi Terasaki, Kyoto Sangyo University. Moreover, upon conducting the regional economic cycle analysis, we received many informative comments from Mr. Noriaki Okura, Ministry of the Environment; Mr. Takeshi Soda and Mr. Kazuhiro Nishikawa, Cabinet Secretariat, Community, People, and Work Creation Headquarters; and various persons from regional financial institutions. We would like to use this opportunity to express our sincere gratitude for their assistance.
data were used to conduct case-study analyses of three regions: Kanazawa City, Toyama region, Ishigaki City.
The following points were understood from the results of this analysis. In tourist regions, even if a large amount of money from tourism consumption flows into the region, if a regional income cycle structure is not established, the money will not be returned to local residents.
When only a few regional companies engage in regional economic activities and more companies from metropolitan-city capital do so, income earned during production leaks to the outside of the region. In regions where the manufacturing industry is highly productive, demand for capital investment is strong and capital investment flows into the region.
Moreover, in the regional area, such regions are scattered where the percentage of fiscal transfers relative to income other than employer income is high and where income is secured by fiscal transfers. Income flows out of these regions during the expenditure and production phases, and, in this way, fiscal transfers do not contribute to the improvement of their own earning power in some regions.
Keywords: regional economies, regional revitalization, analysis of the regional economic cycle
JEL Classification: H71, H72, R15
I. Introduction
In this study, a new method of regional economic analysis is proposed to investigate measures for regional revitalization and regional activation. The factors behind the slump in Japan’s regional economies are external factors, including falling populations due to the declining birthrate and the growing proportion of elderly people, as well as the concentration of the population in Tokyo; the internal factors of the structure of the regional economic cycle and policy actions, including regional revitalization, are spreading to deal with these factors.
In this study, a method for identifying the strengths and weaknesses of regional economies and the inflow and outflow of income is developed, and data are prepared to enable an analysis of regions throughout the country using this method. Further, the objective is to actually apply the analytical method to regions and understand regional problems and other aspects. This way, the comprehensive and practical method used for regional economic analysis in this paper assumes actual regional economic policy planning. However, the prepared economic data are all non-survey data, which are different from data prepared from a complete survey. In this sense, rather than being a detailed analysis, it is positioned as a basic analysis to grasp the overview of regional economies and investigate the direction of measures.
The structure of this paper is as follows. In II, the factors behind the slump of regional economies and requirements for an analysis of the regional economic cycle to investigate measures for regional revitalization are shown. In III, toward developing a method for
116 K Yamasaki, A Sahara, K Yamada / Public Policy Review
analyzing the regional economic cycle, the structure of the cycle is presented and the regional economic cycle method is explained. Then, the data is prepared for applying the analysis of the regional economic cycle to regions throughout the country. Further, in IV, the method is actually applied to three regions – Kanazawa City, the Toyama region, and Ishigaki City – and an overview of the analysis of the regional economic cycle proposed in this paper is provided. Finally, in V, the conclusions of this paper are described.
II. Factors behind the slump in regional economies and requirement of a method for analyzing the regional economic cycle
II-1. Factors behind the slump in regional economies
In terms of the factors behind the slump in regional economies, there are external factors from the viewpoint of the region, such as changes in Japan and the world economy, and internal factors of the structure of the regional economies themselves.
First, there are two large external factors. The first is the population decline in the regional area and its concentration in the Tokyo area. Japan’s birthrate is declining, its population is aging, and it has entered a stage of population decline. This trend is particularly noticeable in the regional area, and there is a state of contraction equilibrium in terms of both demand and supply in regional economies. On the other hand, about 28% of the population and around 32% of gross domestic product (GDP) are concentrated in the Tokyo area, and its percentage of deposits is 44%, which greatly exceeds its percentage of GDP. Moreover, more than half of all loans nationwide are loaned in the Tokyo area, and the over-concentration of finances in this area is very noticeable. Under this over-concentration structure, the functions of approximately 50% of the nationwide headquarters are located in Tokyo, and the value of outgoings as a corporate transfer from regional branches or factories to the headquarters sector is approximately 20 trillion yen
1.
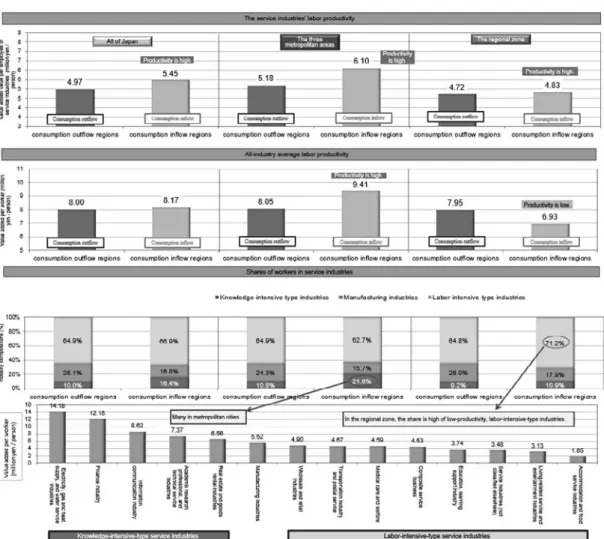
The second factor is the regional area’s transition to the service economy. Employment in manufacturing and related industries has become contracted due to the transfer of factories in the regional area to overseas and reduction in public-work projects, and this contracted portion has been absorbed by labor-intensive-type industries, such as accommodation, transportation, and medicine and welfare. In other words, the industrial structure is transitioning from manufacturing and construction industries to service industries, particularly labor-intensive-type service industries, and this transition is progressing in the regional area. In some cases, these labor-intensive-type service industries have low labor productivity
1 Data on area are from “Municipalities as Seen from Statistics”; those on population are from
“Population, Population Dynamics, and the Number of Households based on the Resident Basic Ledger”; those on workers are from “The Labor-force Survey”; those on GDP are from “Prefectural Accounts Calculations”; those on deposits and loans are from the Bank of Japan’s “Deposits, Cash, and Loans by Prefecture”; and those on the value of outgoings from the headquarters sector are from the “Tokyo Inter-Industry Relations Table.”
and worker wages compared with other industries, which leads to the slump in regional economies.
In addition to the above-described external factors, the regional economic structure itself is an internal factor. In many regions in the regional area, the income cycle does not function well, and there are regions in which in the production, distribution, and expenditure (consumption and investment) phases, income flows to outside of the region, which does not lead to an increase in income for the local residents. For example, in some cases, even if a region succeeds in attracting a leading-edge factory from a metropolitan-city capital and its production’s value addition is greatly increased, this does not lead to improvement in the income for the region’s residents, for instance, because of transfer of corporate and property income to the headquarters in the metropolitan area. In the distribution phase as well, even if a large amount of income is obtained in a region by adding fiscal transfers related to the income obtained from production and sales, it is possible that income inflows and outflows will occur in the expenditure phase, such as from consumption and investment. In the case of consumption, there are inflows and outflows from non-daily activities of tourists and inflows and outflows from daily activities such as shopping behavior. The outflow of capital investment can be to install equipment and establish housing and business establishments outside the region from the income earned by the region’s own economic agents, including companies and households.
In this way, a region’s income inflows into and outflow out of the region based on the behavior of the economic agents of households and companies, as they may not be aware of the administrative districts. In the event of an excess of outflows, that region may be headed for contraction equilibrium.
There are administrative districts in the regional area, such as of the local and prefectural governments. Although administrative activities take place in the administrative districts, economic activities other than administrative activities are fundamentally conducted without depending on the administrative districts. These activities depend on differences in the places where the economic activities are conducted, such as differences in the place of work and place of residence, or in the place of residence and place of shopping. The analysis of regional economies focuses on such spatial differences in each type of economic activity will cause inflows and outflows of income.
II-2. Trends in regional revitalization and other policies
The slump in regional economies is a slump in the economy of Japan as a whole, and regional revitalization and reforms of regional finances have been initiated to deal with this problem. Regional revitalization involves measures by the government as a whole to address the major problems facing Japan: the rapidly declining and super-aging population. Each region aims to create an autonomous and sustainable society utilizing their respective features, and in 2014, the Community, People, and Work Creation Act was enacted, and the Community, People, and Work Creation Headquarters was established. Then, on December 27, 2014, the
118 K Yamasaki, A Sahara, K Yamada / Public Policy Review
Cabinet resolved on the Community, People, and Work Creation Long-term Vision (Long- term Vision) that shows the present and future states of Japan’s population; indicates the direction for the future; and resolves on the Community, People, and Work Creation Comprehensive Strategy (Comprehensive Strategy). The Comprehensive Strategy indicates targets and policies for the next five years as well as the fundamental direction to take to realize the Long-term Vision. Moreover, in June 2016, the Cabinet resolved on the Community, People, and Work Creation Basic Policy 2016 that indicates the directions to be taken in response to this package of policies and individual policies.
The Community, People, and Work Creation Comprehensive Strategy 2015, Revised Edition, requires the realization of a virtuous circle for regional economies in the regional area for improvement in corporate earnings leading to higher wages and employment expansion, which in turn will lead to further improvement in corporate earnings through increases in consumption and investment. The aim is to ensure human resources and funds circulate throughout the country toward realizing local Abenomics (the economic policies of Prime Minister Abe) by building a virtuous circle.
Linked to the above-described trend in regional revitalization, the regeneration of regional economies has also become a focal point in the field of regional finances. In the Fiscal 2015 Financial Administrative Policy presented in 2015, regional financial institutions that are closely related to their respective regions are required to contribute to the development of regional economies as well as of local industries and companies by providing products and services that accurately meet the needs of the customers in their sales regions. They are also required to support the region’s economy and industries, which will help to ensure the soundness of their own management.
Moreover, the aim is to improve the productivity of regional industries and companies, promote smooth transitions to new businesses by reforming the attitude toward finances being dependent on collateral and guarantees, appropriately evaluate the content of businesses of business-partner companies including aspects such as their growth potential, and provide finance and support to their main businesses. This is expected to contribute to regional revitalization.
In addition, the Comprehensive Supervision Guidelines for Medium, Small, and Regional Financial Institutions, April 2015, shows solutions tailored to life stages, such as the foundation and start-up stages, of customer companies. Moreover, the Benchmarks for Financial Mediation Functions, September 2016, emphasize the relations with regional companies, and in regional finances, the focus continues to be on contributing to regional economies that follow the flow of relational banking.
II-3. Requirements for the method for analyzing regional economies
Based on the problem awareness in the above-described requirements for the method of
analyzing regional economies, the following requirements are necessary to conduct an
analysis to plan regional-economic policies.
II-3-1. Requirements from the economic mechanism
For the method for analyzing regional economies, there are three major requirements from the regional-economic mechanism. The first is an analysis of distribution from the viewpoint of local Abenomics. A region’s economic policies are ultimately intended to contribute to the improvement in the welfare of the region’s residents, so an analysis of distribution that measures the income of residents is indispensable. From the viewpoint of Japan’s conventional regional activation, there have been many analyses from the viewpoints of companies’ sales and production amounts and productivity, but there are hardly any examples of comprehensive analyses of regional economies’ distribution and expenditure phases.
The second is an analysis of the redistribution of a region’s income. There are boundaries in a region, such as administrative districts and country borders, and international and regional economics are the same for analyzing the correlations between multiple zones. However, regional economies take place within the same country, and this causes a major difference between international and regional economies; the existence of fiscal transfers by governments. Specifically, there are fiscal transfers, such as the allocation taxes and subsidies, from self-sustaining economies of metropolitan areas to regional economies that are not self-sustaining, and ultimately this structure is aimed at leveling the income nationwide. In this study, analysis of the inflows and outflows of income includes an analysis of these fiscal transfers.
The third is an analysis of dependents and territories. In regional economics, a major difference is whether a region is viewed as “place (area)≒territories” and whether the region’s residents and others are viewed as “agents (people)≒dependents.” For example, a tourist region will have a large number of tourists and will be bustling with activity. However, even if tourism consumption is an enormous amount, if the foodstuffs and goods are procured from outside the region, most of the tourism consumption will flow to outside of that region.
In the accommodation industry as well, if the capital is from metropolitan cities, the income will be transferred to these cities as corporate income, so there are cases in which the residents’
income is low in spite of the bustling activity of the region.
II-3-2. Requirements from the economic data
There are also three major requirements from the economic data. The first is that municipalities are the unit for the comprehensive analysis of regional economies, so economic data on the unit of municipalities that cover production, distribution, and expenditure are required. This is because municipalities’ city halls, chambers of commerce, and industries are the smallest units for the planning function of regional economic policies. For conducting economic analysis on the unit of municipalities, although previously there have been data for analysis of the production phase, such as in economic censuses and industrial statistics,
120 K Yamasaki, A Sahara, K Yamada / Public Policy Review
analysis of the distribution and expenditure phases has been difficult.
The second is that because data are not available on the unit of municipalities, even if data are prepared, such as an inter-industry relations table on a region-by-region basis, a comparison with other regions will be difficult. Therefore, it is necessary to prepare data that consistently cover the whole country in order to compare regions.
The third is that the regional economies and economic policies of the national government are linked, and it is necessary to be able to ascertain how national policies affect regional economies. From this viewpoint, added value in the economic census differs from added value in the National Accounts calculations and does not consider aspects such as the consumption of fixed capital and public services. Moreover, the total sum of the added value of the prefectures in the Prefectural Accounts calculations is not consistent with the added value in the National Accounts calculations. In addition, in the prefectures, there are many inconsistencies between the prefectural inter-industry relations table and the Municipalities Accounts calculations.
III. Development of the method for analyzing the regional economic cycle III-1. Regional economic cycle structure
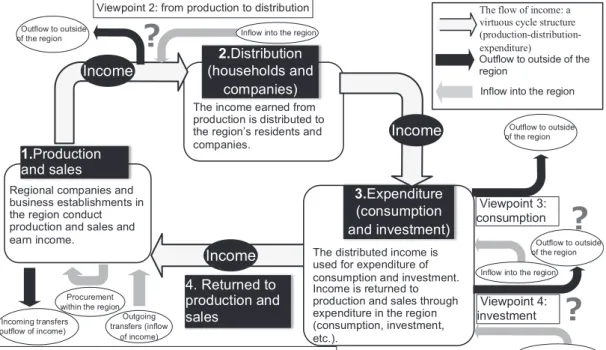
Figure 1 shows the regional economic cycle structure and the viewpoint for analysis of
Figure 1. Regional economic cycle structure and the viewpoint for its analysis
Figure 1 Regional economic cycle structure and the viewpoint its analysis
1
1.Production and sales
2.Distribution (households and
companies)
3.Expenditure (consumption and investment)
Viewpoint 1: acquisition of income from outside of the region
Viewpoint 3:
consumption
Income
?
?
Viewpoint 4:
investment Viewpoint 2: from production to distribution
Outflow to outside
of the region Inflow into the region
Outgoing transfers (inflow
of income) Procurement
within the region
?
Regional companies and business establishments in the region conduct production and sales and earn income.
The income earned from production is distributed to the region’s residents and companies.
The distributed income is used for expenditure of consumption and investment.
Inflow into the region Outflow to outside of the region
The flow of income: a virtuous cycle structure (productiondistribution
expenditure)
4. Returned to production and sales
Income is returned to production and sales through expenditure in the region (consumption, investment, etc.).
Income Income
Outflow to outside of the region
Outflow to outside of the region Inflow into the region
Inflow into the region Incoming transfers
(outflow of income)
the regional economic cycle. This regional economic cycle structure is shown in detail in Nakamura (2014) and the Ministry of Economy, Trade and Industry (2006), and this study fundamentally follows the concepts in these prior studies. As previously described, analysis of the regional economic cycle is on the unit of municipalities and metropolitan areas and on the three phases of production, distribution, and expenditure. Production entails a region’s companies and business establishments conducting production and sales and thereby earning income, and the income earned from this production phase is distributed to households and companies. Then, the distributed income is used for expenditures, such as on consumption and investment. Furthermore, in this expenditure phase, the income used for consumption and investment flows back to the production phase. Up to this point, it is the same as a country’s macro economy.
When analyzing a regional economy, as shown in Figure 1, its characteristics include the acquisition of income in the production phase, inflows and outflows of income in the process from production to distribution, and inflows and outflows of income in the expenditure phase.
This is shown in accordance with the viewpoints in Figure 1. Viewpoint 1 is regarding the production phase, which shows the region’s incoming and outgoing transfers in the event of production and sales, and it also shows the income obtained from outside of the region.
Basically, it is considered that superior industries in a region that have comparative advantage earn income from outside of the region, while inferior industries purchase from the region.
However, the important point here is not only the transactions of goods and services with outside of the region but the transactions within the region (procurement within the region).
Next, viewpoint 2 is regarding the inflows and outflows of income in the process from production to distribution. For example, in the case of a region, there is the outflow of income to outside of the region, wherein corporate income and property income flow to the headquarters in metropolitan areas, while there are inflows of fiscal transfers, including subsidies and grants from the national and prefectural governments.
Figure 1 Regional economic cycle structure and the viewpoint for its analysis
Viewpoint 3 is regarding the inflows and outflows of consumption, and there are two types of consumption inflows and outflows: non-daily and daily. The non-daily inflows and outflows are from tourism; tourism consumption is activated and income flows in from the inflow of tourists. The daily inflows and outflows are mainly from daily shopping. This daily shopping is linked to compact city policies. The promotion of town residences, activation of central urban areas, establishment and improvement of public transportation, and formation of compact cities keeps down the outflow of day-to-day consumption, and rather makes it possible for income to flow in from outside of the region. In this sense, the urban structure that is assumed by the regional economic cycle structure is a compact city. However, as described below, even if consumption flows in, when the supply side has low labor productivity, such as in labor-intensive-type service industries, it is possible that the Baumol effect will appear and, overall, productivity will be lowered.
Viewpoint 4 is regarding capital investment. Capital investment entails setting-up business establishments and installing machinery and equipment, and the outflow of
122 K Yamasaki, A Sahara, K Yamada / Public Policy Review
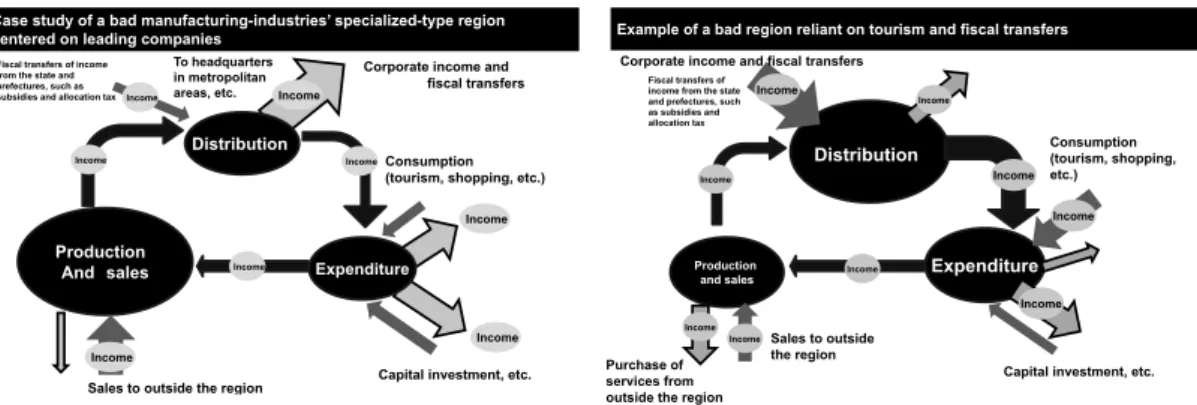
investment is when income from within the region is used to set-up business establishments and install machinery and equipment outside of the region. Thus, installing equipment outside of the region results in income from within the region contributing to an increase in production outside of the region. When there is no relation between inside and outside of the region, it will not contribute to an increase in production inside the region. In order to activate regional economies, income has to be cycled from the excess inflow of income from viewpoints 1 to 4. Figure 2 shows an image of a typical vicious circle structure seen from the regional economic cycle structure. The left side of the figure shows a region specializing in manufacturing industries, centered on leading-edge companies, and this structure is seen from a business castle town. In the production phase, the high productivity of leading-edge companies is utilized to earn income from outside of the region, but in the process of distributing it to local residents, there is an outflow of income to headquarters and other such establishments in the metropolitan areas, such as in the form of corporate income and property income. Moreover, in the consumption phase, there is tourism and shopping by residents outside of the region, and income earned in the region may be used to install machinery and equipment outside of the region. In this way, even if production grows larger and income flows into the region, in the distribution and expenditure phases, a large amount of income flows out of the region, and the income of the region’s residents does not rise. The right side of Figure 2 shows an example of a bad region that is reliant on tourism and fiscal transfers. In the production phase, earning power is small and the region’s earnings do not cover the income of the region’s residents; such a regional economy is only maintained from fiscal transfers from the national and prefectural governments, including subsidies and grants.
Additionally, in the expenditure phase, income flows in from the inflow of tourists, but income obtained from this also flows out to install machinery and equipment and set up business establishments outside of the region. So, only a very small amount of income is returned to the production phase.
Figure 2. Image of the vicious-circle structure of the regional economic cycle structure
Figure 2 Image of the viciouscircle structure of the regional economic cycle structure (left)
Production And sales
Sales to outside the region
Corporate income and fiscal transfers Fiscal transfers of income
from the state and prefectures, such as subsidies and allocation tax
Consumption (tourism, shopping, etc.)
Capital investment, etc.
To headquarters in metropolitan areas, etc.
Case study of a bad manufacturingindustries’specializedtype region centered on leading companies
Income
Distribution
Expenditure
Income Income
Income
Income
Income Income Income
Purchase of services from outside the region
Figure 2 Image of the viciouscircle structure of the regional economic cycle (right)
Production and sales
Distribution
Expenditure
Income
Sales to outside the region Corporate income and fiscal transfers
Fiscal transfers of income from the state and prefectures, such as subsidies and allocation tax
Consumption (tourism, shopping, etc.)
Capital investment, etc.
Income
Purchase of services from outside the region
Example of a bad region reliant on tourism and fiscal transfers
Income
Income
Income Income
Income
Income Income
III-2. Method for analyzing the regional economic cycle III-2-1. Items in the analysis of the regional economic cycle
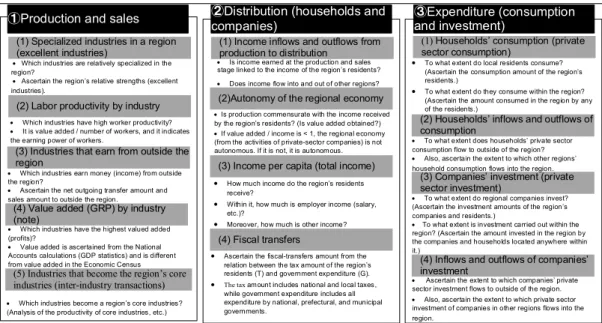
In the regional economic cycle structure, Figure 3 shows the main items to analyze a region’s strengths and weaknesses as well as its income inflows and outflows. Figure 3 does not show all of the regional economic analysis, but with these items it will be possible to present an overview of the regional economic cycle structure.
In the production phase, earning power is analyzed by using the specialization coefficient for comparative-advantage industries, and it is shown from labor productivity for industries that have an absolute advantage in a region and from net outgoing transfers for industries earning from outside of the region. Moreover, industries that will be a region’s core industries are analyzed using the indexes of sensitivity dispersion and power of dispersion from the regional inter-industry relations table.
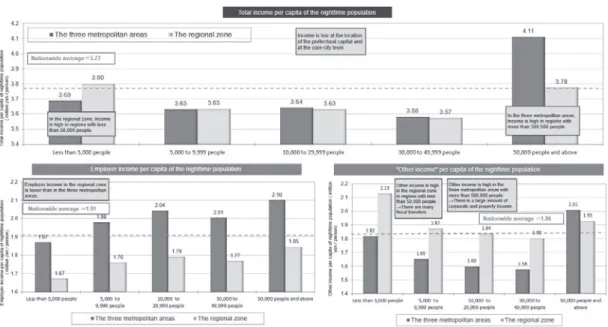
For the distribution phase, the inflows and outflows of income from production to distribution, the autonomy of regional economies, the income per resident, and the fiscal- transfer situation are shown. This analysis of the distribution phase is mainly an analysis of dependents, and the inflows and outflows of income are also analyzed using dependents.
Meanwhile, it is considered that indicators of the distribution phase are also indicators of the main outcomes of the regional economic policies. In addition, for the expenditure phase, households’ consumption and inflows and outflows of consumption as well as companies’
capital investment and inflows and outflow of capital investments are shown. Here, the Figure 3. Items to be analyzed in the regional economic cycle
Figure 3 Items to be analyzed in the regional economic cycle
ᵒ
①Production and sales ②Distribution (households and
companies) ③Expenditure (consumption
and investment)
(4) Fiscal transfers
(1) Households’ consumption (private sector consumption)
(4) Value added (GRP) by industry (note)
(5) Industries that become the region’s core industries (interindustry transactions)
(3) Income per capita (total income) (2)Autonomy of the regional economy
(2) Households’ inflows and outflows of consumption
(4) Inflows and outflows of companies’
investment
(3) Companies’ investment (private sector investment)
Which industries have the highest valued added (profits)?
Value added is ascertained from the National Accounts calculations (GDP statistics) and is different from value added in the Economic Census
Which industries become a region’s core industries?
(Analysis of the productivity of core industries, etc.)
Is production commensurate with the income received by the region’s residents? (Is value added obtained?)
If value added / income is < 1, the regional economy (from the activities of privatesector companies) is not autonomous. If it is not, it is autonomous.
To what extent do local residents consume?
(Ascertain the consumption amount of the region’s residents.)
To what extent do they consume within the region?
(Ascertain the amount consumed in the region by any of the residents.)
To what extent does households’ private sector consumption flow to outside of the region?
Also, ascertain the extent to which other regions’
household consumption flows into the region.
To what extent do regional companies invest?
(Ascertain the investment amounts of the region’s companies and residents.)
To what extent is investment carried out within the region? (Ascertain the amount invested in the region by the companies and households located anywhere within it.)
Ascertain the extent to which companies’ private sector investment flows to outside of the region.
Also, ascertain the extent to which private sector investment of companies in other regions flows into the region.
How much income do the region’s residents receive?
Within it, how much is employer income (salary, etc.)?
Moreover, how much is other income?
Ascertain the fiscaltransfers amount from the relation between the tax amount of the region’s residents (T) and government expenditure (G).
The tax amount includes national and local taxes, while government expenditure includes all expenditure by national, prefectural, and municipal governments.
(1) Income inflows and outflows from production to distribution
Is income earned at the production and sales stage linked to the income of the region’s residents?
Does income flow into and out of other regions?
(1) Specialized industries in a region (excellent industries)
(2) Labor productivity by industry
(3) Industries that earn from outside the region
Which industries are relatively specialized in the region?
Ascertain the region’s relative strengths (excellent industries).
Which industries earn money (income) from outside the region?
Ascertain the net outgoing transfer amount and sales amount to outside the region.
Which industries have high worker productivity?
It is value added / number of workers, and it indicates the earning power of workers.
124 K Yamasaki, A Sahara, K Yamada / Public Policy Review
inflows and outflows are measured on a territories basis with an awareness of returns to the production phase, as is described below.
III-2-2. Method for estimating the inflows and outflows of income
Next, the method of analyzing the inflows and outcomes of income in a region-which is the core of this study’s analysis of the regional economic cycle-will be shown. First, for the production phase’s inflows and outflows of income, net outgoing transfers by industry are used. The regional inter-industry relations table is required for these estimations of inflows and outflows by industry. Next, in the distribution phase, the amounts of inflows and outflows of income are calculated from the dependents and territories’ distribution incomes, and the inflow of income is shown by subtracting the territories’ distribution income from the dependents’ distribution income. Similarly, for expenditure, territories and dependents’
expenditure amounts are used, and the inflows and outflows are opposite to those in the distribution phase; that is, the inflow of income into a region is shown by subtracting the dependents’ expenditure amount from the territories’ expenditure amount.
Thus, the biggest feature of this study is that data on both territories and dependents are used to estimate a region’s inflows and outflows of income. The data on dependents used for the inflows and outflows of income were prepared from data covering a region’s households and companies’ production, distribution, and expenditure; in this study, this is called regional accounts calculations. For the territories’ data, the regional inter-industry relations table on the units of regions, such as municipalities, is used. In a region, a state of equivalence for the three phases of production, distribution, and expenditure is established, but it is difficult to ascertain the income of local residents (the dependents).
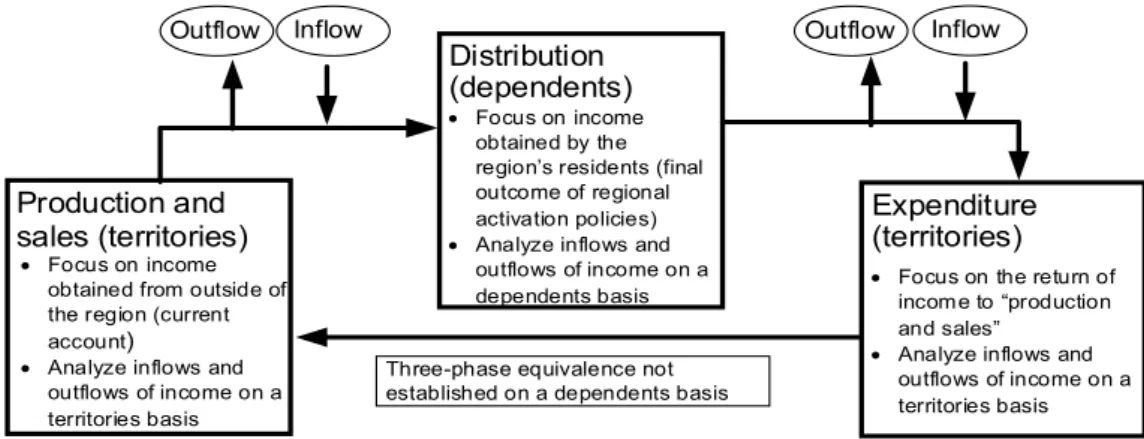
As described above, in this study, an important viewpoint is considered to ascertain whether or not income is circulating throughout the country from the viewpoint of local Abenomics. Therefore, the regional accounts calculations data, which is data on dependents, was created to ascertain the dependents’ income. These concepts are shown in Figure 4.
Figure 4. Concept of inflows and outflows of income in this study
Figure 4 Concept of inflows and outflows of income in this study
ᵓ
Production and sales (territories)
Distribution (dependents)
Expenditure (territories)
Focus on income obtained by the region’s residents (final outcome of regional activation policies)
Analyze inflows and outflows of income on a
dependents basis Focus on the return of income to “production and sales”
Analyze inflows and outflows of income on a territories basis
Focus on income obtained from outside of the region (current account)
Analyze inflows and outflows of income on a territories basis
Outflow Inflow
Threephase equivalence not established on a dependents basis
Outflow Inflow
In production and sales, inflows and outflows are analyzed on a territories basis. In this study, production and sales are common for dependents and territories, and they indicate the production and sales by the business establishments in the relevant region. Here, for the inflows and outflows of income, the amounts of net outgoing transfers by industry in the regional inter-industry relations table are used.
The most important parts of this study are the distribution phase, regional revitalization, and regional activation policies to improve the welfare level of the region’s residents, and the final outcome should be measured as income improvements for the region’s residents.
Therefore, by comparing the income earned from production and sales in a region with the income earned by its residents, the inflows and outflows of income are analyzed based on dependents. In actuality, residents’ income comprises income from business establishments (places of work) inside and outside of the region, inflows and outflows from fiscal transfers, and outflows to headquarters and other business establishments. Therefore, for the distribution phase, these items are analyzed for the inflows and outflows of income. For the expenditure phase, the inflows and outflows of income on a territories basis are analyzed with an awareness of the return of income to production and sales. Capital investment and private sector final consumption contribute to improvements in production and sales when they are carried out on the land of the relevant region. However, even if consumption and investment expand in other regions, this does not directly contribute to improvements in the relevant region’s production and sales.
The method of estimating the amounts of these inflows into a region is shown below. In the production phase, the income-inflow amount is from Formula (1), and it is the net amount of outgoing transfers by industry.
IFP=EX - IM (1)
IFP: net outgoing transfers by industry, EX: amount of outgoing transfers, IM: amount of incoming transfers.
Next, the distribution phase’s amount of incoming income is from Formulas (2) and (3), and focusing on the income obtained by local residents, the estimations were made on a dependents basis.
IFDE=pIME-tIME
(2)
IFDO=pIMO-tIMO (3)
IFDE: amount of incoming employer income, pIME: dependents’ distribution of employer income, tIME: territories’ distribution of employer income, IFDO: incoming amount other than employer income, pIMO: dependents’ distribution of income other than employer income, tIMO: territories’ distribution of income other than employer income.
The expenditure inflows and outflows, such as from private sector consumption and private sector capital investment, are from Formulas (4) and (5). Focus is placed on the return
126 K Yamasaki, A Sahara, K Yamada / Public Policy Review
of income to production and sales, and the estimations are made on a territories basis.
IFC=tCONS-pCONS
(4)
IFI=tINV-pINV
(5)
IFC: amount of incoming consumption, tCONS: territories’ amount of consumption, pCONS:
dependents’ amount of consumption, IFI: amount of incoming investment,
tINV: amount of territories’ investment, pINV: amount of dependents’ investment.
III-3. Preparing data for use in the analysis of the regional economic cycle III-3-1. Overview of the basis for the database
In this study, two data sets were created: dependents’ economic data (hereafter, regional accounts calculations) and territories’ economic data (hereafter, the regional inter-industry relations table)
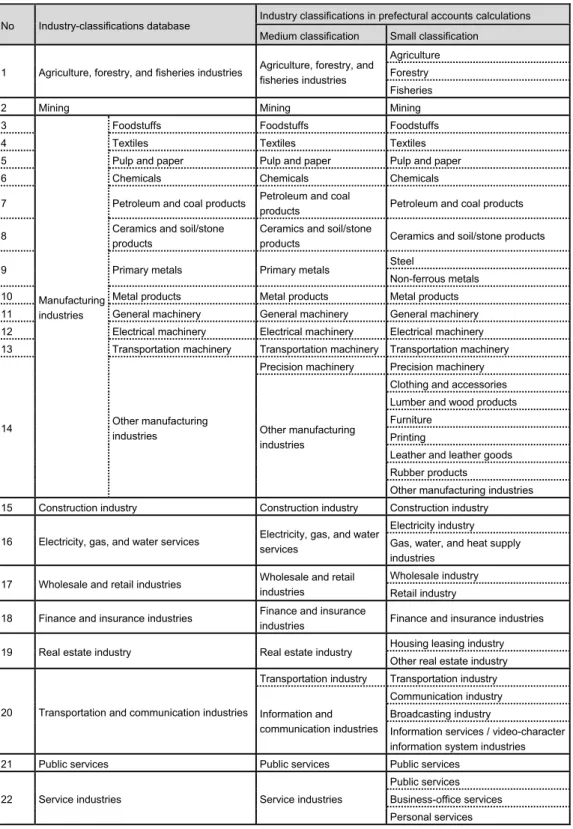
2. They were created in 2010. As shown in Table 1, both data sets were created with 22 industries, which is about the same as the number in the medium classification of the prefectural accounts. The classifications are rough, but we hope to address this issue in the future. The regional accounts calculations on a dependents basis are the totals of the economic activities carried out by the region’s agents, and it is possible to ascertain the income obtained from production and sales at places of work that is taken home to places of residence (by income transfers, etc.) and then used for expenditure. Therefore, while the three-phase equivalence is established nationwide, it is not established in a region. Moreover, it is also possible to estimate fiscal transfers by estimating direct and indirect taxes.
Conversely, the regional inter-industry relations table on a territories basis is the same concept as the municipalities’ inter-industry relations table created by municipalities. It totals the “production” and “expenditure” carried out in the relevant region, and it does not matter which agents carry out the economic activities, such as production and expenditure. That is, ultimately, these are land-based activities, and the three-phase equivalence is established in a region, as defined by the inter-industry relations table. Moreover, in this study, the gross value added in the regional inter-industry relations table is the value added in the regional accounts calculations to which “consumption other than by households” is added. Additionally, the value added and incoming and outgoing amounts are consistent with the National Accounts calculations.
In both the above-described data sets, the totals for all the regions are consistent with the National Accounts calculations (GDP statistics), and it is possible to ascertain the effects of international trade on regional economies. Both data sets were created by a non-survey method, and a questionnaire survey was not carried out to create the data. Further, for data on
2 The database created for this study and used for the regional economic cycle analysis are posted on the following website: RECA regional economic cycle analysis model (http://www.vmi.co.jp/reca/
index.html). In 2010, there were 22 industry classifications, but in May 2017, data on 39 industry classification were posted.
Table 1. The industry-classifications database used for the analysis of the regional economic cycle
13
Table 1 The industry-classifications database used for the analysis of the regional economic cycle
No Industry-classifications database Industry classifications in prefectural accounts calculations Medium classification Small classification
1 Agriculture, forestry, and fisheries industries Agriculture, forestry, and fisheries industries
Agriculture Forestry Fisheries
2 Mining Mining Mining
3
Manufacturing industries
Foodstuffs Foodstuffs Foodstuffs
4 Textiles Textiles Textiles
5 Pulp and paper Pulp and paper Pulp and paper
6 Chemicals Chemicals Chemicals
7 Petroleum and coal products Petroleum and coal
products Petroleum and coal products
8 Ceramics and soil/stone
products
Ceramics and soil/stone
products Ceramics and soil/stone products
9 Primary metals Primary metals Steel
Non-ferrous metals
10 Metal products Metal products Metal products
11 General machinery General machinery General machinery
12 Electrical machinery Electrical machinery Electrical machinery 13 Transportation machinery Transportation machinery Transportation machinery
14 Other manufacturing
industries
Precision machinery Precision machinery
Other manufacturing industries
Clothing and accessories Lumber and wood products Furniture
Printing
Leather and leather goods Rubber products
Other manufacturing industries 15 Construction industry Construction industry Construction industry
16 Electricity, gas, and water services Electricity, gas, and water services
Electricity industry Gas, water, and heat supply industries
17 Wholesale and retail industries Wholesale and retail industries
Wholesale industry Retail industry 18 Finance and insurance industries Finance and insurance
industries Finance and insurance industries 19 Real estate industry Real estate industry Housing leasing industry
Other real estate industry
20 Transportation and communication industries
Transportation industry Transportation industry
Information and communication industries
Communication industry Broadcasting industry
Information services / video-character information system industries
21 Public services Public services Public services
22 Service industries Service industries
Public services Business-office services Personal services
Employer income in places of residence is calculated by allocating it based on the commuting conditions between municipalities in the previously described inter-city transport model. For the
expenditure amounts by item on the unit of municipalities (private sector final consumption, private sector investment, government expenditure, etc.), the expenditures in the Prefectural Accounts calculations are
128 K Yamasaki, A Sahara, K Yamada / Public Policy Review
shopping trips to estimate the consumption amounts and data on commuting to estimate income transfers, the inter-city transport model estimations in Koike, Sasaki, and Yamazaki (2014) were used.
The inter-city transport model used estimates the number of trips from nationwide commuting to work between municipalities, commuting to school, private trips (shopping, tourism, etc.), and work trips (business trips, meetings, etc.), while the transportation modes include by air, sea, rail, bus, and vehicle network.
III-3-2. Estimation method for the regional accounts calculations
The regional accounts calculations created for this study may also be considered as the regional version of the National Accounts calculations. The difference between the macro economy and regional economy of a country is the difference in the scope of behavior of the residents. In the case of a country, there are country borders, and fundamentally, no behavior crosses these borders during day-to-day activities. On the other hand, in the case of regional economies, residents are not aware of the administrative districts in their daily activities.
Therefore, in regional economies, on a dependents basis, the three-phase equivalence for production, distribution, and expenditure is not established.
For example, when the places of work and residence are different, residents act at the place of work for the production phase; however, for the expenditure phase, such as consumption, many activities occur at places other than the place of work. Moreover, at places of work, even if production and sales are performed and these companies obtain value added, such value added is not returned entirely to the residents of the place of production;
instead, in some cases, it is absorbed by headquarters and branch offices in other regions, and so income in production does not match income in distribution. Further, with regard to consumption, consumption by a resident in a different municipality is not recorded in the consumption of the relevant region and is instead recorded in the consumption of this other region. The regional accounts calculations in this study express this type of situation through the data.
In the production phase’s data, value added by industry in the National Accounts calculations and prefectures’ value added from the distribution of value added in the Prefectural Accounts calculations are divided proportionally among the municipalities using the Municipalities Accounts calculations, economic census, industrial statistics, National Census, and other means. Next, for distribution income, in places of production, value added by industry on the unit of municipalities is divided into employer income and other income using the prefectural inter-industry relations table.
Employer income in places of residence is calculated by allocating it based on the
commuting conditions between municipalities in the previously described inter-city transport
model. For the expenditure amounts by item on the unit of municipalities (private sector final
consumption, private sector investment, government expenditure, etc.), the expenditures in
the Prefectural Accounts calculations are divided using the accounts-settlement survey by
the municipality, National Census, employer income, and other means. As the regional accounts calculations are on a dependents basis, there is no distinction between the locations of consumption and investment.
Therefore, only net exports are recorded in the current account, and the totals of each expenditure item are made consistent with the National Accounts calculations. Thus, the regional accounts calculations are based on the GDP statistics, intermediate inputs are not considered, and all the data are on a value-added basis.
Moreover, as the regional accounts calculations are data on a dependents basis, at the distribution stage, it is possible to estimate fiscal transfers (G-T) by estimating consumption (C), tax (T), and savings (S) and comparing them with the expenditure items. These fiscal transfers are the amounts after the taxes paid by residents are subtracted from the government expenditure that benefits the residents. Government expenditure (G) comprises government consumption and government investment, and it is the expenditure on the relevant region from multiple organizations, such as municipality offices, prefectural government offices, and national government’s local organizations; it includes expenditure such as on large-scale public-works projects. Estimations of fiscal transfers have been made on the unit of prefectures in previous studies, such as Sano (2000), but fundamentally, nationwide estimates targeting local governments have not been made.
Taxes are estimations of national and local taxes (prefectures and municipalities). For local tax (municipal tax), data by municipality could be obtained from the Ministry of Internal Affairs’ 2010 Accounts Settlement Conditions Survey by Municipality, while data on national and local taxes (prefectural tax) could be obtained for the unit of prefectures; thus, the figures for the prefectures were divided proportionally into the municipalities. For the method of dividing proportionally, as indicators of what can be acquired on the unit of municipalities, the estimations in this study of value added, employer income, final consumption amount of private sector consumption, consumption amount of petroleum and coal products, number of cars owned, and other values were used, and the figures were divided proportionally.
III-3-3. Method of estimating the regional inter-industry relations table
The regional inter-industry relations table on the unit of municipalities in this study is of the competitive-import type. In many existing methods, including those of Doi et al. (1996) and Konagaya and Maekawa (2012), the production amounts are set first. However, in this study, to set the value-added amounts in the regional accounts calculations as the same amounts, the data were created by setting the value added. First, the values in the regional accounts calculations were used for the value added of the gross value-added amounts.
Consumption expenditure other than by households was calculated using the ratios in the prefectural inter-industry relations table. The production amount was obtained by dividing the gross value added by the value-added rate, and this production amount was multiplied by the input coefficient to calculate the intermediate input amount.
The input coefficient and value-added rate were created by using the input coefficients
130 K Yamasaki, A Sahara, K Yamada / Public Policy Review
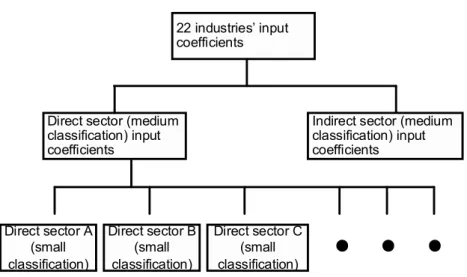
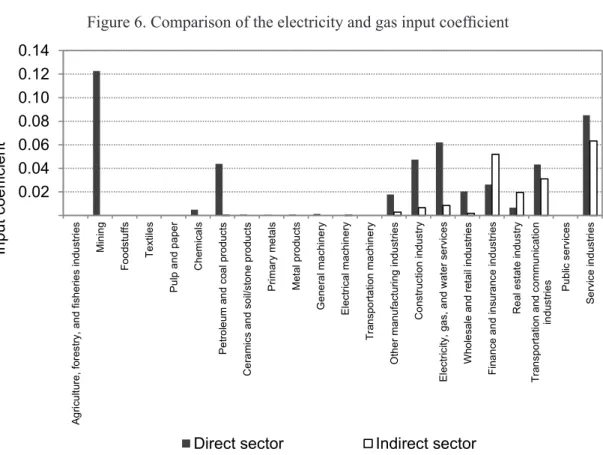
of the basic classifications (401 classifications) in the nationwide table of the inter-industry relations table, along with data from the economic census medium classifications (97 classifications) and small classifications (519 classifications). The approach for creating the data was the same as in Suga (2015). As shown in Figure 5, industries were allocated into the direct and indirect sectors, and input coefficients were created and combined. Such use of input coefficients in the industries’ direct and indirect sectors is because the input structures of both sectors are very different. When creating the inter-industry relations tables for small regions, such as municipalities, these differences greatly affect the input coefficients. Figure 6 shows a comparison of the input coefficients of the direct sector, electricity and gas sectors, and the indirect sector. The industries with many inputs in the direct sector include mining, petroleum and coal manufacturing, and construction, while in the indirect sector, there are many inputs in the finance, insurance, and service industries. For example, while there are electricity and gas industry business establishments in metropolitan cities, such as in sites of prefectural offices, the majority are in the indirect sector. Therefore, this does not mean that these establishments actually conduct power-generation or related operations. In this case, there are, in fact, hardly any inputs from the mining and petroleum and coal manufacturing industries, and so using the direct sector input coefficient may be misleading.
With regard to the direct sector, since the basic classifications in the nationwide table include detailed industry classifications, it is assumed that the input coefficient does not change in each region, and the input coefficients of the basic classifications in the nationwide table are estimated from the weighted averages of the municipalities’ number of workers.
However, strictly speaking, the nationwide table’s input coefficient are values that are also included in the indirect sector, but since they are small values when viewed on an all- industries basis, the nationwide table’s input coefficients were deemed to be the direct sector’s input coefficients. For the indirect sector, the input coefficients of the headquarters sector in
Figure 5. Approach for creating input coefficients, etc.
Figure 5 Approach for creating input coefficients, etc.
ᵔ
22 industries’ input coefficients
Direct sector (medium classification) input coefficients
Indirect sector (medium classification) input coefficients
Direct sector A (small classification)
Direct sector B (small classification)
Direct sector C (small
classification)
・・・
Policy Research Institute, Ministry of Finance, Japan, Public Policy Review, Vol.14, No.1, February 2018 131
the 2005 Tokyo inter-industry relations table were used. These headquarters sector input coefficients were created from the survey of actual conditions, including of companies’
management activities. In this study, in addition to the Metropolitan Tokyo headquarters sector, the input coefficients of the nationwide headquarters sectors (the same as the companies’ management sector) by industry, which includes other regions, were used.
For the final demand amounts, the same as the regional accounts calculations, value- added amounts (excluding consumption expenditure other than by households) and the total amounts in the regional accounts calculations were made consistent. As data on territories were used for the proportional divisions among municipalities, for the private sector final consumption amounts, the previously described inter-city transport model was used; the trips for commutes to work and school, tourism, and shopping were totaled and divided proportionally. Then, the prefectural inter-industry relations table was used, and the amounts were divided by industry. The import and export amounts are consistent not with the total of the import and export amounts in the Prefectural Accounts calculations but with the import and export amounts in the National Accounts calculations. The values for outgoing transfers and incoming transfers were calculated using a non-survey method (LQ method) from the existing municipalities’ inter-industry relations table and other sources.
The survey method using the Production Distribution Survey and other surveys not only requires an enormous budget, but there is also the possibility of errors in the survey design
Figure 6. Comparison of the electricity and gas input coefficient
0.02 0.04 0.06 0.08 0.10 0.12 0.14
Agriculture, forestry, and fisheries industries Mining Foodstuffs Textiles Pulp and paper Chemicals Petroleum and coal products Ceramics and soil/stone products Primary metals Metal products General machinery Electrical machinery Transportation machinery Other manufacturing industries Construction industry Electricity, gas, and water services Wholesale and retail industries Finance and insurance industries Real estate industry Transportation and communication industries Public services Service industries
Input coefficient
Direct sector Indirect sector
132 K Yamasaki, A Sahara, K Yamada / Public Policy Review