The Transportation and Logistics Environment of the Eastern Region of Russia: A Comparative Evaluation with the Western Region Based on
Microdata
ARAI Hirofumi*
Abstract
In this paper, the author aims to comprehensively evaluate the transportation and logistics environment of the eastern region of Russia via making comparison with western Russia, based on microdata obtained via a large-scale interview survey of firms. From the simple aggregation of the response results, it can be understood that the firms of eastern Russia strongly demand an improvement in the environment in various aspects, not only for hard infrastructure, but also soft infrastructure. Most of the difference between east and west in the strength of this demand is explained by the external conditions surrounding individual firms and the special characteristics of the firms themselves. As a conclusion it can be said that the transport and logistics environment of eastern Russia is inferior in comparison with western Russia.
Key words: Logistics environment, Transport service, Infrastructure development, Railway, Russian Far East
JEL classification codes: L91, O18, R40
1. Introduction
Far from the economic center of the country and with a sparse spatial distribution of population and corporate activity, the overcoming of “distance” is a serious economic problem for the Russian Far East. In that light, the securing of a transport and logistics environment centered on transportation infrastructure is considered a major life-or-death economic issue by many firms located in the Far Eastern region.
Despite being so important, the Russian Far East is still a region lagging behind in the development of transportation infrastructure. In the “Strategy for the Socio-Economic Development of the Far East and Zabaykalye for the Period up to 2025” (henceforward “The Far East and Zabaykalye Development Strategy”) which the Government of Russia adopted in 2009, it was pointed out that the Russian Far East is a disadvantaged region, and in particular the development level of transportation and electricity infrastructure is low (Government of Russia, 2009).
Meanwhile, in the Far East there are also infrastructure construction projects whose feasibility is considered doubtful. For example, within the government formulated “Strategy for Developing Rail Transport in the Russian Federation up to 2030”, a project was raised of constructing a new 1,866-km line over a practically uninhabited plain with only a sprinkling of settlements from the city of Yakutsk (Sakha Republic) to the city of Magadan (Magadan Oblast) (Government of Russia, 2008). If they proceed with infrastructure development via political considerations alone, then it will lead to wasteful spending increasing.
Zooming out a little, it is not the case that the transport and logistics environment for
firms has been stipulated by hard transportation infrastructure alone. It has also been stipulated
from the soft perspectives of the content of legal systems including transportation fee regimes,
transport safety regulations, and border-crossing procedures, as well as the efficiency of their
implementation by the respective institutions, and the private-sector firms offering transport services. Even if a large amount of infrastructure investment is not undertaken, it is possible to improve the transport and logistics environment.
Taking such societal demands into consideration, this paper takes as its aim the comprehensive evaluation of the problem of the transport and logistics environment of the Russian Far East, based on the demands and activities of firms. Specifically, it aims to elucidate what kind of improvement in the environment the managements of firms want, and how they are attempting the resolution of the problems.
To that end, this paper will use the results of a large-scale interview survey (henceforward referred to as the “ERINA Survey”) which the Economic Research Institute for Northeast Asia (ERINA) undertook in Russia in September–December 2015 aimed at the managements and senior managers of firms.
1The basic objective of this survey, in order to elucidate the potential for the economic development of the Russian Far East, is to evaluate the organization of firms and various aspects of company activities in the region via a comparison with European Russia.
The target regions in the ERINA Survey were eight federal subjects of the Russian Federation from eastern Russia and nine from western Russia (Table 1). The target regions of the survey in the east and west are regions adjoining the borders with the Asia-Pacific and Europe, respectively.
The target regions for the survey in the east are among the target regions of the Far East and Zabaykalye Development Strategy, and are along the Trans-Siberian Railway and the Baikal- Amur Mainline (BAM) with their branch lines. These railways connect to the ports on the Sea of Japan. With the exception of the Sakha Republic, seven of the federal subjects border on one or both of China and Mongolia. The target regions for the survey in the west were set in order to undertake a comparison with the east, and nine federal subjects were selected so as to be almost the same scale as the east in terms of population, gross regional production, and number of firms.
While the focus is on the Northwestern Federal District which adjoins the Barents and Baltic Seas, as a result of taking geographical connectedness into consideration, it includes part of the Central Federal District. On the other hand, taking into consideration the risk of the city of Saint Petersburg—an international hub of higher level—causing a bias in the survey results, it was excluded from the survey region. As a result, the area of the eastern region grows to more than four times that of the western region.
In line with the basic objective of the survey, it included wide-ranging questions on firms’
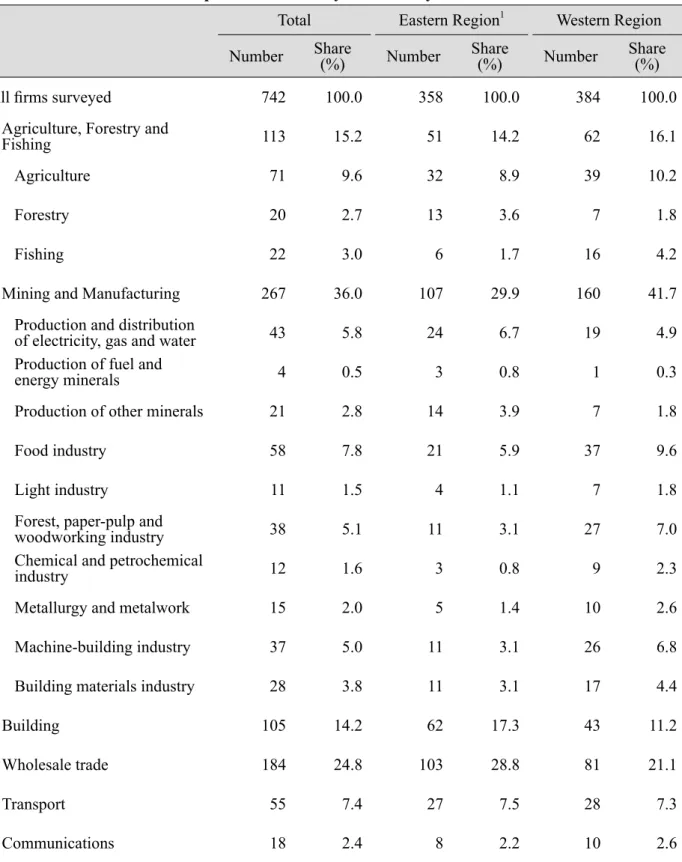
organization and operations. In order to exclude small firms with weak corporate governance, the target firms were limited to joint-stock companies and limited liability companies with 50 or more employees. The criteria for selection of target firms in terms of industrial classification was whether firms in a certain industry would undertake economic activity beyond their urban areas so to be able to ascertain the impact from differences in the spatial characteristics of the two regions (the density of population and economic activity). In the next step, the number of firms by sector was assigned so as to reflect the regional industrial structure. As a result, valid responses from 358 firms in the east and 384 firms in the west, for a total of 742, were obtained with a composition of business sectors as shown in Table 2.
Below, first Section 2 introduces several indicators and prior analyses showing the
inadequacies in the transport and logistics environment of the Russian Far East. Then Section
3 shows the picture ascertained from the aggregate results of the ERINA Survey. In Section 4,
using a multiple regression analysis method, the author undertakes an analysis of the factors
impacting the evaluation at a time when the managements of firms are demanding improvement
Table 1: Basic Economic Indicators for the Target Regions of the ERINA Survey Area
1Population
1Population Density
1
Gross Regional Product (GRP)
2
GRP per capita
2Number of Firms
Thous. sq. km Share (%)
Thous.
Share (%)
pop. / sq. km
Mln. Ruble Share (%) Thous. Ruble
Number
Share (%)
Total 7,380 100.0 18,731 100.0 2.5 7,339 100.0 391 523,536 100.0 Eastern Region 5,992 81.2 9,673 51.6 1.6 3,826 52.1 395 269,932 51.6 Republic of Buryatia 351 4.8 982 5.2 2.8 204 2.8 208 20,933 4.0 Sakha Republic 3,084 41.8 960 5.1 0.3 750 10.2 783 27,178 5.2 Khabarovsk Krai 788 10.7 1,335 7.1 1.7 572 7.8 428 46,136 8.8 Primorsky Krai 165 2.2 1,929 10.3 11.7 717 9.8 371 70,873 13.5 Zabaykalsky Krai 432 5.9 1,083 5.8 2.5 249 3.4 229 16,585 3.2 Amur Oblast 362 4.9 806 4.3 2.2 277 3.8 343 16,676 3.2 Irkutsk Oblast 775 10.5 2,413 12.9 3.1 1,014 13.8 420 68,106 13.0 Jewish Autonomous Oblast 36 0.5 166 0.9 4.6 45 0.6 268 3,445 0.7 W estern Region 1,388 18.8 9,058 48.4 6.5 3,513 47.9 387 253,604 48.4 Republic of Karelia 181 2.4 630 3.4 3.5 211 2.9 334 24,341 4.6 Arkhangelsk Oblast 590 8.0 1,174 6.3 2.0 617 8.4 524 26,196 5.0 Leningrad Oblast3 84 1.1 1,779 9.5 21.2 854 11.6 480 38,320 7.3 Murmansk Oblast 145 2.0 762 4.1 5.3 390 5.3 511 22,579 4.3 Novgorod Oblast 55 0.7 616 3.3 11.3 240 3.3 389 16,379 3.1 Pskov Oblast 55 0.8 646 3.5 11.7 133 1.8 205 16,451 3.1 Smolensk Oblast 50 0.7 959 5.1 19.2 257 3.5 267 27,754 5.3 Tver Oblast 84 1.1 1,305 7.0 15.5 341 4.6 260 36,149 6.9 Vologda Oblast 145 2.0 1,188 6.3 8.2 469 6.4 394 45,435 8.7
Notes:1. As of 1 January 2016. 2. As of 2015. Source:Compiled by author based on Rosstat dataTable 2: Composition of Surveyed Firms by Industrial Sector
Total Eastern Region
1Western Region Number Share
(%) Number Share
(%) Number Share
(%)
All firms surveyed 742 100.0 358 100.0 384 100.0
Agriculture, Forestry and
Fishing 113 15.2 51 14.2 62 16.1
Agriculture 71 9.6 32 8.9 39 10.2
Forestry 20 2.7 13 3.6 7 1.8
Fishing 22 3.0 6 1.7 16 4.2
Mining and Manufacturing 267 36.0 107 29.9 160 41.7
Production and distribution
of electricity, gas and water 43 5.8 24 6.7 19 4.9
Production of fuel and
energy minerals 4 0.5 3 0.8 1 0.3
Production of other minerals 21 2.8 14 3.9 7 1.8
Food industry 58 7.8 21 5.9 37 9.6
Light industry 11 1.5 4 1.1 7 1.8
Forest, paper-pulp and
woodworking industry 38 5.1 11 3.1 27 7.0
Chemical and petrochemical
industry 12 1.6 3 0.8 9 2.3
Metallurgy and metalwork 15 2.0 5 1.4 10 2.6
Machine-building industry 37 5.0 11 3.1 26 6.8
Building materials industry 28 3.8 11 3.1 17 4.4
Building 105 14.2 62 17.3 43 11.2
Wholesale trade 184 24.8 103 28.8 81 21.1
Transport 55 7.4 27 7.5 28 7.3
Communications 18 2.4 8 2.2 10 2.6
Note: Test of equality of proportion for 17 sectors of industrial classification with the western region: Chi2(16)=40.4000, p=0.0006; Cramer V=0.2333
Source: Compiled by author based on the ERINA Survey
in the transport and logistics environment and adopting improvement measures. Lastly,
conclusions are drawn in Section 5.
2. The East–West Difference in the Transport and Logistics Environment
As stated above, the transportation infrastructure of the Russian Far East is meager. What demonstrates the situation most straightforwardly is the state of development of the railways and roads. Among the target regions of the ERINA Survey, half of the federal subjects in the eastern region fall below the average railway density of 50 km/10,000 km
2(2015) for the Russian Federation, in contrast to Arkhangelsk Oblast alone in the western region (Table 3). The average for the Far Eastern Federal District is under 14 km/10,000 km
2, and ranks lowest among all Federal Districts. The same also goes for paved road density (2015). Only two federal subjects in the eastern region exceed the Federation average of 61 km/1,000 km
2, whereas conversely in the western region only three federal subjects fall below it (Table 3). The average paved road density for the Far Eastern Federal District (9.5 km/1,000 km
2) is one-sixth of the Federation average, and as expected ranks bottom.
Table 3: Road and Railway Density by Federal Subject of the Russian Federation
Federal Subject Paved Road
1Rail
2km/1,000km
2km/10,000km
2Russian Federation Average 61 50
Eastern Region
Republic of Buryatia 26 35
Sakha Republic 3.8 2
Khabarovsk Krai 12 27
Primorsky Krai 93 95
Zabaykalsky Krai 34 56
Amur Oblast 34 81
Irkutsk Oblast 30 32
Jewish Autonomous Oblast 68 141
Western Region
Republic of Karelia 47 123
Arkhangelsk Oblast 21 30
Leningrad Oblast
3207 341
Novgorod Oblast 198 210
Murmansk Oblast 23 60
Pskov Oblast 299 197
Smolensk Oblast 283 232
Tver Oblast 248 214
Vologda Oblast 118 53
Note: As of 2015.
Source: Rosstat data
Elsewhere, concerning seaports, the eastern region is not so disadvantaged. Vostochny Port, with the largest volume of cargo handled in the Russian Far East (69.29 million tonnes in 2017), is even third nationwide in volume handled.
2Moreover, the number of containers handled at the Port of Vladivostok (840,000 TEU in 2017) is second in Russia behind the Port of Saint Petersburg on the Baltic Sea. However, despite the presence of such pivotal ports, the ports of the Russian Far East have great problems. On this point, the following problems were pointed out in Minakir and Sergienko (eds., 2011, p. 145): “technological constraints bring delays in transshipment operations”;
3“there are ports where development is constrained due to being located within an urban area”;
4and “a long period of time is required for the transit of overseas trade cargo due to the lack of infrastructure in the inspection and supervisory organs”.
As stated above, the transport and logistics environment is also stipulated by elements on the software side. There are data which show that firms in the Russian Far East are also actually placing emphasis on the elements in soft infrastructure. In fact, in a questionnaire survey targeting 64 shipper firms in Khabarovsk Krai in 2008 it was ascertained that “shipping rates”
were a more significant problem than “(insufficient) quality of roads.” What is more, as the results of analysis combining an evaluation of the degree of satisfaction, the survey concluded that emphasis should be placed on three points, adding “timely dispatch of transport vehicles” to the other two (Balalaev et al., 2008, pp. 69–71).
From a different angle again comes circumstantial evidence indicating the inadequacies in the transport and logistics environment of the Russian Far East. There is one example to mention. In the Russian Far East, as part of regional development policy, the two kinds of special zone systems of “Advanced Special Economic Development Zones (ASEZ)” and the “Free Port of Vladivostok (FPV)” were established in 2016. Looking at the breakdown by industry classification of “resident” firms’ business
5as of the end of June 2017, 35 firms within the 136 in the ASEZ and 78 firms within the 220 in the FPV were planning to perform “warehousing and services incidental to transport”. In both cases, the category gives the largest number among the industry sectors, which suggests that many and most firms intend to enter into the market, discovering business opportunities there. There is no need to stress that the inadequacies of the provision of transportation and logistics services are in the background. Furthermore, even though there is still the possibility that some of the firms may designate it as an incidental business for their own company’s distribution and not for profit, it suggests that these firms will come not to rely on the services of established businesses, but attempt to tackle matters within their own firm. In any case, the tendencies of the resident firms in these special zones suggest that
“there are unsatisfied needs of firms in the market for warehousing, etc.”
Up to this point this section has introduced the data and several analyses indicating that the transport and logistics environment in the Russian Far East is at a disadvantage in comparison with other regions within Russia. However, these remain fragmentary pieces of information.
Certainly, it can generally be said that the small amount of infrastructure is a problem. However, the profundity of that problem should probably be judged on the magnitude of the divergence from the needs. In addition, even when some of the firms located in the Russian Far East have sensed an inadequacy in the provision of certain transportation and logistics services, it is not pertinent to take that for evaluation of the entire transport and logistics environment in the Russian Far East. After all, these problems may not be peculiar to the Russian Far East, but may be universal problems for Russia.
In this regard the data from the ERINA Survey make possible an overall evaluation,
via comparative analysis between the east and west target regions of the survey, as well as a crosswise analysis of hard and soft infrastructure. A case example cannot be found where micro- level data on logistics has been gathered in such a way within Russia. From Section 3 on, the author analyzes this valuable data, and aims to elucidate whether the transport and logistics environment in the Russian Far East really is inferior.
3. The Results of the Survey
In this section, in order to tackle the concerns mentioned in the previous section, based on the ERINA Survey data, the author carries out analysis as to whether differences exist between eastern and western Russia with regard to the evaluations and judgements of the managers of firms and the actions of firms in the area of transportation and logistics. Here on in, sub-sections 3.1 and 3.2 show the reality revealed for the evaluation of the external environment, followed by sub-section 3.3 for the actions of firms. In sub-section 3.4, after summarizing these, the author presents interpretations and further questions for in-depth consideration in Section 4.
3.1 The Impact of the External Environment on the Management of Firms
First, in order to evaluate the relative acuteness for the upgrading of transportation and logistics infrastructure, an analysis was done as to the responses to the crosswise question on impacts of various factors of the external environment on management of firms.
For this question the interviewers requested a five-grade evaluation—“a definitely negative impact”, “a rather negative impact”, “no impact”, “a rather positive impact”, and “a definitely positive impact”—regarding a total of 12 categories of factors and structures of the external environment, including “federal government economic policy” and “local government and municipal bodies’ economic policy”, and 10 others as in Table 4.
Comparing the responses from eastern and western firms, a chi-squared test for equality of proportion revealed that out of the total 12 target categories there were 8 categories where a null hypothesis of no difference between the two regions was rejected at a 10% level or below.
“Transportation and logistics infrastructure”, the main subject of this paper, was included among those 8 categories, and for that category the null hypothesis was rejected particularly strongly (x
2= 21.8039, p = 0.0002). By comparing the responses from both regions in this category, negative responses (the total of “a definitely negative impact” and “a rather negative impact”) were 41.0%
(139 out of 339 firms) in the eastern region, as against 27.2% (98 out of 360 firms) in the western region (Table 4). On the other hand, the percentages for the positive responses (the total of “a definitely positive impact” and “a rather positive impact”) were 22.7% in the eastern region (77 out of 339 firms) and 26.4% in the western region (95 out of 360 firms), with the western region higher. In other words, it is graphically illustrated in these results that firms in the eastern region have a strong awareness that the infrastructure for transportation and logistics is insufficient.
Due to space constraints, the author will omit detailed examination of the other categories, but there were categories which can confirm a similar trend for transportation infrastructure where there were significant differences in the proportion of responses between east and west, and in addition there were many responses of negative impacts in the eastern region: “federal government economic policy”, “local government and municipal bodies’ economic policy”,
“local legislation”, “the electricity grid” and “the shadow economy”. On the other hand, for the
response results regarding “communications”, which also belongs within infrastructure, there was
a significantly positive evaluation in the eastern region. Furthermore, for “federal legislation”,
Table 4: The Impact of External Economic Environment on Management of Firms
All Firms Surveyed1 Eastern Region Western Region No. Firms % of Total No. Firms % of
Total No. Firms % of
Total (a) Federal Government Economic Policy
A definitely negative impact A rather negative impact No impact
A rather positive impact A definitely positive impact Total
24338 30295 69315
35.15.5 43.613.7 100.02.2
13321 12845 34013
39.16.2 37.613.2 100.03.8
11017 17450 3532
31.24.8 49.314.2 100.00.6 Test of equality: x2 (4)= 17.6968, p = 0.0014; Cramér V = 0.1598
(b) Local Government and Municipal Bodies’ Economic Policy A definitely negative impact
A rather negative impact No impact
A rather positive impact A definitely positive impact Total
21141 326107 70015
30.15.9 46.615.3 100.02.1
10726 15445 34210
31.37.6 45.013.2 100.02.9
10415 17262 3585
29.14.2 48.017.3 100.01.4 Test of equality: x2(4) = 7.9938, p = 0.0918; Cramér V = 0.1068
(c) Federal Legislation A definitely negative impact A rather negative impact No impact
A rather positive impact A definitely positive impact Total
23737 311100 69914
33.95.3 44.514.3 100.02.0
11721 14448 3399
34.56.2 42.514.2 100.02.7
12016 16752 3605
33.34.4 46.414.4 100.01.4 Test of equality: x2 (4)= 3.0893, p = 0.5429; Cramér V = 0.0664
(d) Local Legislation A definitely negative impact A rather negative impact No impact
A rather positive impact A definitely positive impact Total
19331 36195 69010
28.04.5 52.313.8 100.01.4
2095 17142 3379
28.25.9 50.712.5 100.02.7
9811 19053 3531
27.83.1 53.815.0 100.00.3 Test of equality: x2(4) = 10.9681, p = 0.0269; Cramér V = 0.1260
(e) Judicial System
A definitely negative impact A rather negative impact No impact
A rather positive impact A definitely positive impact Total
1897 45264 6398
15.22.8 70.710.0 100.01.3
4611 22129 3125
14.73.5 70.89.3 100.01.6
517 23135 3273
15.62.1 70.610.7 100.00.9 Test of equality: x2(4) = 2.0793, p = 0.7211; Cramér V = 0.0570
(f) Power Enforcement Organs (police activity and enforcement of laws) A definitely negative impact
A rather negative impact No impact
A rather positive impact A definitely positive impact Total
11016 45571 6586
16.72.4 69.110.8 100.00.9
448 23333 3235
13.62.5 72.110.2 100.01.5
668 22238 3351
19.72.4 66.311.3 100.00.3 Test of equality: x2 (4)= 7.4683, p = 0.1131; Cramér V = 0.1065
Note: Targets were firms with valid responses.
Source: Compiled by author based on the ERINA Survey
Table 4: The Impact of External Economic Environment on Management of Firms (continued)
All Firms Surveyed1 Eastern Region Western Region No. Firms % of
Total No. Firms % of
Total No. Firms % of
Total (g) Banking and Financial Institutions
A definitely negative impact A slightly negative impact No impact
A slightly positive impact A definitely positive impact Total
22145 295132 70815
31.26.4 41.718.6 100.02.1
2997 13567 3379
28.88.6 40.119.9 100.02.7
12416 16065 3716
33.44.3 43.117.5 100.01.6 Test of equality: x2 (4)= 8.1892, p = 0.0848; Cramér V = 0.1075
(h) Transportation and Logistics Infrastructure A definitely negative impact
A slightly negative impact No impact
A slightly positive impact A definitely positive impact Total
19542 290150 69922
27.96.0 41.521.5 100.03.1
10831 12364 33913
31.99.1 36.318.9 100.03.8
1187 16786 3609
24.23.1 46.423.9 100.02.5 Test of equality: x2 (4)= 21.8039, p = 0.0002; Cramér V = 0.1766
(i) Electricity Grid
A definitely negative impact A slightly negative impact No impact
A slightly positive impact A definitely positive impact Total
22937 31497 69518
32.95.3 45.214.0 100.02.6
11231 13445 33412
33.59.3 40.113.5 100.03.6
1176 18052 3616
32.41.7 49.914.4 100.01.7 Test of equality: x2 (4)= 25.2342, p = 0.00004; Cramér V = 0.1905
(j) Communications (optical fiber, Internet, mobile communications) A definitely negative impact
A slightly negative impact No impact
A slightly positive impact A definitely positive impact Total
1093 345197 70560
13.21.4 48.927.9 100.08.5
347 16891 33737
10.12.1 49.927.0 100.011.0
593 177106 36823
16.00.8 48.128.8 100.06.3 Test of equality: x2 (4)= 11.6233, p = 0.0203; Cramér V = 0.1284
(k) Educational and Research Institutions (universities, scientific research institutes) A definitely negative impact
A slightly negative impact No impact
A slightly positive impact A definitely positive impact Total
325 36384 52541
1.06.1 69.116.0 100.07.8
102 17439 24823
0.84.0 70.215.7 100.09.3
223 18945 27718
1.17.9 68.216.2 100.06.5 Test of equality: x2 (4)= 4.7708, p = 0.3116; Cramér V = 0.0953
(l) Shadow Economy (black market, organized crime) A definitely negative impact
A slightly negative impact No impact
A slightly positive impact A definitely positive impact Total
10038 39024 5553
18.06.8 70.34.3 100.00.5
3152 18712 2853
10.918.2 65.64.2 100.01.1
487 20312 2700
17.82.6 75.24.4 100.00.0 Test of equality: x2 (4)= 18.5824, p = 0.0009; Cramér V = 0.1829
Note: Targets were firms with valid responses.
Source: Compiled by author based on the ERINA Survey
“judicial system”, “power enforcement organs”, and “educational and research institutions” a significant east–west difference was not observed.
As above, for 6 categories, half of the total 12, a tendency of responses was discernable of the eastern firms being even more negatively impacted than the western ones. Included among the 6 categories were “transportation and logistics infrastructure” and the “electricity grid”, and the Government of Russia’s recognition that “the development of transportation and electricity infrastructure in the Russian Far East is lagging behind” can be discerned in the fact that it is a shared view at the level of the management of firms.
3.2 The Improvement of the External Environment Required by Firms
On the point of being able to discern that firms in the eastern region are firmly regarding the lack of development of transportation and logistics infrastructure as a problem, the next analysis was of the problem focused on the transport and logistics environment. Here, based on the hypothesis that at the same time as many firms desiring development of hard infrastructure—
infrastructure in a narrower sense—also desire the improvement of the transport and logistics environment by other means, such as deregulation, the author examined whether there is a difference in those demands between east and west. On the question of the target for the analysis, relating to the improvement of the transport and logistics environment there were the following 8 categories as those considered desired by firms: “new construction and expansion of infrastructure”; “improvement and modernization of infrastructure”; “transportation fee reduction or subsidies for transportation fees”; “relaxation of freight transportation-related regulations”;
“strengthening of competition policy in the transportation market”; “raising of the quality of the services of forwarding businesses”; “streamlining and expedition of cross-border procedures for freight”; and “enhancement of transportation services for special freight (including frozen and refrigerated freight, and oversize freight)”. Regarding the necessity of each, the interviewers asked for responses in three divisions: “necessary”; “desirable”; and “don’t recognize a necessity”. All these issues are clearly given external environments for individual firms, and it is a difficult matter for the companies alone to improve them by their own efforts.
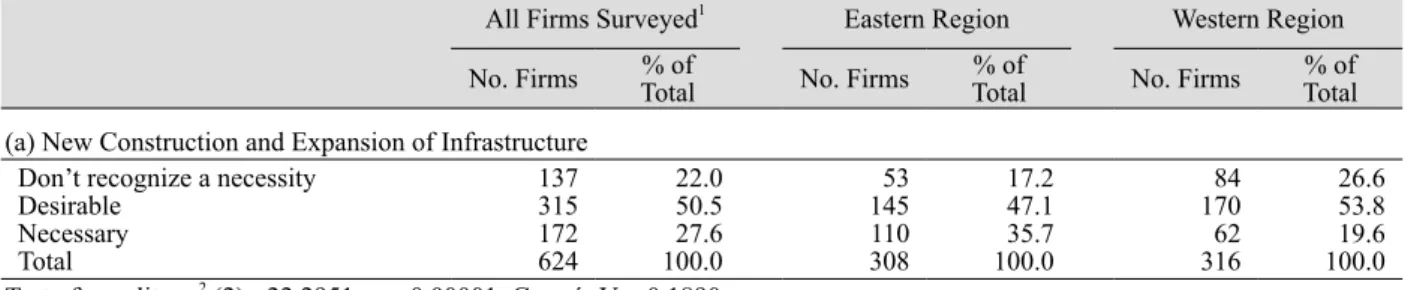
The aggregate results of the responses are as in Table 5. In whichever category the proportion of companies considering it “necessary” was greater in the eastern than the western region, whereas the proportion of companies considering “don’t recognize a necessity” were fewer in the eastern region. A chi-squared test of equality detected a statistically significant east–
west difference at a 1% level for responding firms in all categories. Comparing reciprocally the responses to the questions for the eight categories within eastern firms, only the response to
“transportation fee reduction or subsidies for transportation fees” of “necessary” exceeded 50%, and the total together with “desirable” exceeded 90%.
From the above it can be understood that, in the comparison with western region firms,
eastern firms more strongly require improvement in the overall broader transport and logistics
environment, including institutions and policy, as well as the development of soft infrastructure,
such as the service content of logistics firms, as their requirements are not limited to the
development of hard infrastructure. Among these transportation fee reduction is strongly
demanded.
Table 5: The External Environment Requiring Improvement
All Firms Surveyed1 Eastern Region Western Region No. Firms % of
Total No. Firms % of
Total No. Firms % of
Total (a) New Construction and Expansion of Infrastructure
Don’t recognize a necessity Desirable
Necessary Total
137315 172624
22.050.5 100.027.6
14553 110308
17.247.1 100.035.7
17084 31662
26.653.8 100.019.6 Test of equality: x2 (2)= 22.2951, p = 0.00001; Cramér V = 0.1890
(b) Improvement and Modernization of Infrastructure Don’t recognize a necessity
Desirable Necessary Total
139306 177622
22.349.2 100.028.5
12855 120303
18.242.2 100.039.6
17884 31957
26.355.8 100.017.9 Test of equality: x2 (2)= 36.2564, p = 0.0000; Cramér V = 0.2414
(c) Transportation Fee Reduction or Transportation Fee Supplementary Payments Don’t recognize a necessity
Desirable Necessary Total
29877 285660
45.211.7 100.043.2
12020 179319
37.66.3 100.056.1
17857 106341
16.752.2 100.031.1 Test of equality: x2 (2)= 47.0850, p = 0.0000; Cramér V = 0.2670
(d) Relaxation of Freight Transportation-related Regulations Don’t recognize a necessity
Desirable Necessary Total
140287 207634
22.145.3 100.032.6
12156 116293
19.141.3 100.039.6
16684 34191
24.648.7 100.026.7 Test of equality: x2 (2)= 12.1104, p = 0.0023; Cramér V = 0.1382
(e) Strengthening of Competition Policy in the Transportation Market Don’t recognize a necessity
Desirable Necessary Total
172248 175595
28.941.7 100.029.4
12253 115290
18.342.1 100.039.7
119126 30560
39.041.3 100.019.7 Test of equality: x2 (2)= 42.3245, p = 0.0000; Cramér V = 0.2667
(f) Raising of the Quality of the Services of Forwarding Businesses Don’t recognize a necessity
Desirable Necessary Total
184261 139584
31.544.7 100.023.8
11682 28587
28.840.7 100.030.5
102145 29952
34.148.5 100.017.4 Test of equality: x2 (2)= 13.8814, p = 0.0009; Cramér V = 0.1541
(g) Streamlining and Expedition of Cross-Border Customs Procedures for Freight Don’t recognize a necessity
Desirable Necessary Total
127194 151472
26.941.1 100.032.0
4088 21284
18.941.5 100.039.6
10687 26067
33.540.8 100.025.8 Test of equality: x2 (2)= 16.2645, p = 0.0002; Cramér V = 0.1856
(h) Enhancement of Transportation Services for Special Freight Don’t recognize a necessity
Desirable Necessary Total
139219 138496
28.044.2 100.027.8
5391 23086
23.039.6 100.037.4
12886 26652
32.348.1 100.019.5 Test of equality: x2 (2)= 19.9547, p = 0.0000; Cramér V = 0.2005
Note: Targets were firms with valid responses.
Source: Compiled by author based on the ERINA Survey
3.3 Firms’ Independent Efforts at Logistics Improvement
The next examination is whether there is an east–west difference in the efforts which firms are making themselves to resolve logistical problems. On the questions concerning this, the survey presented the following 7 categories as improvement measures which are conceivable for execution at each firm: “change the procurement source to a supplier in a convenient location”;
“change the shipping market to a convenient location”; “utilization of comprehensive distribution service providers, including third-party logistics”; “possession of firm’s own transportation means, such as trucks and freight wagons”; “establishment of warehouses and logistics centers other than at company HQ”; “utilization of computer systems for logistics management”; and
“utilization and nurturing of specialist logistics personnel”, requiring responses in the form of two choices, affirmative and negative, based on whether a firm has adopted the respective measures.
The aggregate results are as in Table 6. Via a Z-test on the difference in proportion, a null hypothesis of no difference between east and west was rejected for three categories: “utilization of comprehensive distribution service providers, including third-party logistics” (z = 2.4531, p
= 0.0142); “establishment of warehouses and logistics centers other than at company HQ” (z = 3.8897, p = 0.0001); and “utilization and nurturing of specialist logistics personnel” (z = 2.1024, p = 0.0355).
Confirming the content of these responses, the former two were adopted more in the eastern region, and the latter more in the western region. For firms utilizing comprehensive distribution service providers, there were 48 in the eastern region (16.7% of firms with valid responses), as against 31 (9.9%) in the western region. Regarding firms which have installed distribution hubs, there were 59 (20.6%) in the eastern region and 29 (9.3%) in the western region, practically double in difference. On the other hand, for firms undertaking utilization and nurturing of specialist personnel, there were 24 (8.4%) in the eastern region and 43 (13.8%) in the western region.
In the other four categories, the null hypothesis of no east–west difference was not rejected.
“Possession of firm’s own transportation means, such as trucks and freight wagons” was included within that, the sole category among all seven which more than half the firms were carrying out.
That is, in the adoption or rejection of the majority of improvement measures, including the strategies most broadly in use, there were less differences in the actions of firms between the eastern and western regions.
Collecting these together, compared with the improvement demands for the external environment where it is discerned that the eastern firms have strong demands in all categories, it can be concluded that the east–west difference is small in terms of the actions in efforts to improve independently by investing their own resources.
3.4 Short Summary
As discussed above, the analyses in this section have confirmed differences in the trends for responses in the eastern and western regions from the simple aggregation of the questionnaire survey. Their summation is as follows.
In the area of the evaluation and awareness of the external environment, it was shown that for eastern firms the development of transportation and logistics infrastructure is insufficient.
Furthermore, regarding the necessity of development of transportation and logistics infrastructure
(construction and renovation) as well as the improvement of the wider overall transport and
Table 6: Independent Efforts toward Logistics Improvement
All Firms Surveyed1 Eastern Region Western Region No. Firms % of
Total No. Firms % of
Total No. Firms % of
Total (a) Change the Procurement Source to a Supplier in a Convenient Location
Adopted Not adopted Total
149450 599
24.975.1 100
20978 287
27.272.8 100
24171 312
22.877.2 100 Test of proportion: z = 1.2505, p = 0.2111
(b) Change the Shipping Market to a Convenient Location Adopted
Not adopted Total
53663 599
10.589.5 80.7
25334 287
11.888.2 38.7
28329 312
90.79.3 42 Test of proportion: z = 1.0170, p = 0.3091
(c) Utilization of Comprehensive Distribution Service Providers, incl. Third-Party Logistics Adopted
Not adopted Total
52079 599
13.286.8 80.7
23948 287
16.783.3 38.7
28131 312
90.19.9 42 Test of proportion: z = 2.4531, p = 0.0142
(d) Possession of Firm’s Own Transportation Means, such as Trucks and Freight Wagons Adopted
Not adopted Total
378221 599
63.136.9 80.7
184103 287
64.135.9 38.7
194118 312
62.237.8 42 Test of proportion: z = 0.4896, p = 0.6245
(e) Establishment of Warehouses and Logistics Centers other than at Company HQ Adopted
Not adopted Total
51168 579
11.788.3 78
22859 287
20.679.4 38.7
28329 312
90.79.3 42 Test of proportion: z = 3.8897, p = 0.0001
(f) Utilization of Computer Systems for Logistics Management Adopted
Not adopted Total
56435 599
94.25.8 80.7
26918 287
93.76.3 38.7
29517 312
94.65.4 42 Test of proportion: z = 0.4290, p = 0.6679
(g) Utilization and Nurturing of Specialist Logistics Personnel Adopted
Not adopted Total
53267 599
11.288.8 80.7
26324 287
91.68.4 38.7
26943 312
13.886.2 42 Test of proportion: z = −2.1024, p = 0.0355
Note: Targets were firms with valid responses.
Source: Compiled by author based on the ERINA Survey
logistics environment, including the legal system governing the distribution and logistics and
freight transport services, the eastern firms discern a necessity more than the western ones.
On the other hand, regarding efforts being implemented to improve logistics by firms investing their own resources, although in part it is possible to discern a difference between eastern and western firms, the statistical analysis does not show such a clear difference, as on the stance of requiring improvement in the external environment.
Considering these analytical results altogether, while the east–west difference is small in terms of each firm tackling the problems by acting autonomously for the resolution of transportation and logistics problems, in terms of demands to the external environment (other players) it is possible to obtain a tentative conclusion with the trend of eastern firms’ strongly requiring improvement.
Taking into consideration this paper’s main issue of the evaluation of east–west differences in the transport and logistics environment, then how should we interpret the tentative conclusion obtained here? One interpretation is that out of two groups of the firm managements taking similar actions, one group strongly requires improvement of the environment and the other not as much, which suggests that the group of firms which strongly requires improvement of the environment is one which is in a relatively unfortunate environment. According to this interpretation, the transport and logistics environment in the eastern region should be inferior in comparison to the western region.
On the other hand, investigating the analytical results up to this point in a little more detail, there are also factors calling for hesitation in such an interpretation. Some of the survey categories, like transportation-related regulations and cross-border procedures are uniform systems nationwide, and that fact has also naturally been acknowledged by business people both east and west. Consequently, regarding the necessity of these improvements, the fact that the response trends differ greatly between eastern and western firms can be called an extremely unnatural result. Considered this way, the result in all categories of eastern firms more strongly demanding improvement than western firms, gives rise to the suspicion that it comes from the bias held by the responders of: “while the managements of firms in the Russian Far East are neglecting self-help efforts, the level of their demands tends to be high”. Therefore in the next section the author will attempt to investigate this suspicion.
4. Factor Analysis on the East–West Differences via Regression Analysis
In order to examine the questions arising from the results of the analysis in the previous section, this section conducts a multiple regression analysis as to whether the regional difference between east and west, which was observed as the aggregate results of the ERINA Survey, is detectable at the same time as controlling other factors which would have an influence on the responses of firms.
Below, sub-section 4.1 explains the analytical method, and sub-sections 4.2 and 4.3 undertake factor analysis of the east–west differences observed in the previous section regarding demand for external environment improvement and independent improvement efforts, respectively.
4.1 Analytical Method
Within the two fields of “demand for improvement in the external environment” and
“independent improvement efforts”, taking as examination targets the categories where a
significant difference between east and west was discernible, an analysis of which factors
strengthen demand (demand promotion factors) and which factors encourage independent efforts
(independent effort promotion factors) was undertaken. The semantic content and definition of the variables used in the regression analysis and the descriptive statistics are shown in Table 7.
First, in the analysis of the demand promotion factors, as significant east–west differences were ascertained in all eight categories, eight models were estimated with all as targets for analysis. The dependent variables for each model were: new construction and expansion of infrastructure (logiinfradev); improvement and modernization of infrastructure (logiinfrares);
transportation fee reduction or subsidies for transportation (transfee); relaxation of freight transportation-related regulations (transreg); strengthening of anti-monopoly policy in the transportation sector (transanti); raising of the quality of the services of forwarding businesses (transqua); streamlining and expedition of cross-border procedures for freight (custom); and enhancement of transportation services for special freight (including frozen and refrigerated freight, and oversize freight) (spectrans). Each dependent variable was an ordinal variable with incremental figures in three levels depending on the degree of necessity given in the responses.
As independent variables, other than the dummy variable (east) which designates eastern firms as 1, the author introduced control variables representing several factors which might influence what kind of improvement in the transport and logistics environment firms demand.
More specifically, as a proxy variable for the local regional environment, and in particular the level of infrastructure development, the models employed the railway density (raildens) by area for the federal subjects of the Russian Federation as shown above in Table 3. Furthermore, as it is conceivable that the closeness of relations with the government has an impact on the manner of requesting changes in rules and policy, the models employed another proxy variable for this, a dummy variable (staown) which designates state-owned enterprises as 1. Further still, as it is conceivable that the nature of relations with clients also has an impact on the logistics needs of firms, the models introduced: a dummy variable (b2c) which designates as 1 firms which engage in consumer-oriented business (business-to-consumer firms); a dummy concerning the existence of dealings with overseas firms (forpart); an ordinal variable (inputrange) which represents the distance to the location of the main procurement source for raw materials, components, etc.; and an ordinal variable (outputrange) which represents the distance to the main shipping destination or markets for merchandise and finished goods. Lastly, adding a group of industrial sector dummies
6to control the fixed effect for the industries to which the surveyed firms belong, the regression analysis estimated all these variables simultaneously with east. In dealing with the dependent variables being ordinal variables, an ordered probit model was used in the estimation of the regression model.
In the analysis of independent effort promotion factors, there were three target categories—
the utilization of comprehensive distribution (3PL) firms (logicom), establishment of own-
company distribution facilities (warehouses, etc.) (ownlogicen), and utilization and nurturing
of specialist logistics personnel (logistaff)—where there were significant east–west differences,
and three models respectively were estimated for each with the dependent variables. All the
dependent variables (x) were estimated simultaneously, employing the same set of control
variables as the factor analysis of the demand for improvement in the external environment, in
addition to the eastern firm dummy (east). As the dependent variables were dummy variables
containing the two options of adoption or non-adoption of improvement measures, a probit
model was used for the estimations.
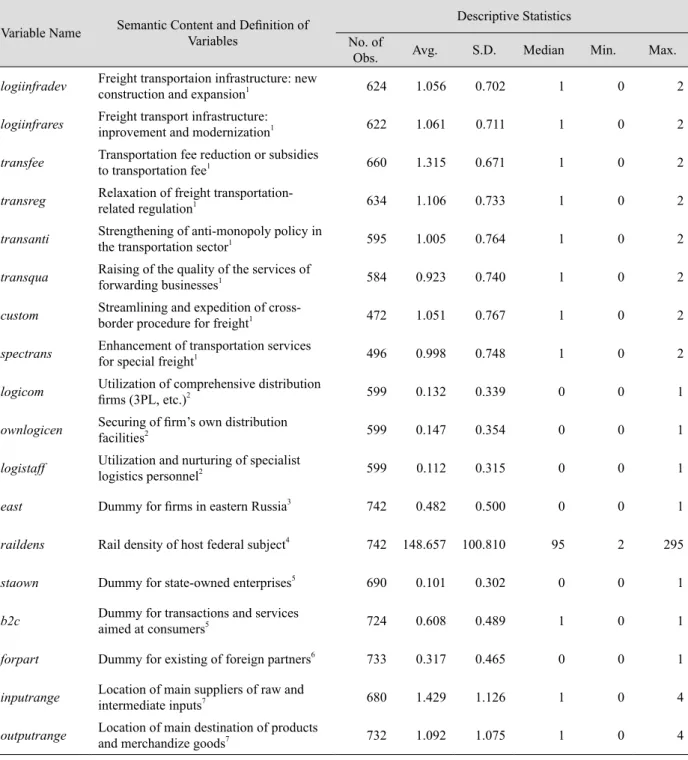
Table 7: The Semantic Content and Definition of the Variables Used in the Regression Analysis and the Descriptive Statistics
Variable Name Semantic Content and Definition of Variables
Descriptive Statistics No. of
Obs. Avg. S.D. Median Min. Max.
logiinfradev Freight transportaion infrastructure: new
construction and expansion1 624 1.056 0.702 1 0 2
logiinfrares Freight transport infrastructure:
inprovement and modernization1 622 1.061 0.711 1 0 2
transfee Transportation fee reduction or subsidies
to transportation fee1 660 1.315 0.671 1 0 2
transreg Relaxation of freight transportation-
related regulation1 634 1.106 0.733 1 0 2
transanti Strengthening of anti-monopoly policy in
the transportation sector1 595 1.005 0.764 1 0 2
transqua Raising of the quality of the services of
forwarding businesses1 584 0.923 0.740 1 0 2
custom Streamlining and expedition of cross-
border procedure for freight1 472 1.051 0.767 1 0 2
spectrans Enhancement of transportation services
for special freight1 496 0.998 0.748 1 0 2
logicom Utilization of comprehensive distribution
firms (3PL, etc.)2 599 0.132 0.339 0 0 1
ownlogicen Securing of firm’s own distribution
facilities2 599 0.147 0.354 0 0 1
logistaff Utilization and nurturing of specialist
logistics personnel2 599 0.112 0.315 0 0 1
east Dummy for firms in eastern Russia3 742 0.482 0.500 0 0 1
raildens Rail density of host federal subject4 742 148.657 100.810 95 2 295
staown Dummy for state-owned enterprises5 690 0.101 0.302 0 0 1
b2c Dummy for transactions and services
aimed at consumers5 724 0.608 0.489 1 0 1
forpart Dummy for existing of foreign partners6 733 0.317 0.465 0 0 1
inputrange Location of main suppliers of raw and
intermediate inputs7 680 1.429 1.126 1 0 4
outputrange Location of main destination of products
and merchandize goods7 732 1.092 1.075 1 0 4
Notes: 1. Category variable: 0 = not necessary; 1 = desirable; 2 = necessary 2. Dummy variable: 0 = not adopted; 1 = adopted
3. Dummy variable: 0 = western region; 1 = eastern region 4. Continuous variable: km/10,000 km2
5. Dummy variable: 1 = applicable firm (state-owned enterprise, business-to-consumer firms); 0 = other 6. Dummy variable: 0 = no; 1 = yes
7. Category variable: 0 = same city; 1 = outside city, same federal subject; 2 = up to 3,000 km away in other federal subject; in federal subject further than 3,000 km away; 4 = abroad
Source: Compiled by author based on the ERINA Survey
4.2 Factors Promoting Demand for Improvement of the External Environment
The estimation results of the ordered probit model taking the eight variables from logiinfradev to spectrans as dependent variables, are as shown in Table 8. While the analysis in the previous section made it clear that for eastern firms the tendency to demand improvement in the external environment is significantly strong, the model estimation results revealed that out of eight demand categories the only category where the strong demand could be attributed to the eastern firm dummy (east) was the “enhancement of transportation services for special freight”. For the other categories, the results were ones that several factors introduced as control variables—specifically factors related to the external conditions surrounding the relevant firms or the firms’ own peculiarities—can explain for the recognition of the necessity of improvement.
The paragraphs below describe what kind of external conditions and peculiarities of the firms tend to enhance their necessity of improvement of the external environment.
First, looking at railway density (raildens), a proxy variable for the level of infrastructure development, a significant negative regression coefficient was estimated in five estimation models from the total eight. That is, the estimation results showed that the lower a region’s railway density, the stronger the tendency becomes for firms located there to demand improvements in the environment in a wide range of sectors. The railway density was introduced as a proxy variable for the level of infrastructure development. It can easily be understood that in regions where this is low the demand for improvement relating to infrastructure strengthens. At the same time, it is also conceivable that railway density is a variable which shows the spatial density of economic activity. In case of firms located in regions with sparse economic activity, it is highly likely that part or all of the transportation distance among the various procured raw materials and components and shipped products will be long, and consequently it is conceivable that this will become a factor for demanding a reduction in transportation fees. Furthermore, it is imaginable that in these regions transportation firms are monopolistic or oligopolistic and that the forwarders able to provide the desired services are not in place, and there is the possibility of this being linked with the respective demands for improvement.
Furthermore, in model [7] which analyzed cross-border procedures, the coefficient of the dealings with overseas firms dummy (forpart) having the extremely large value of 0.554 clearly shows where the problem is, which is considered a suggestive analytical result.
Otherwise characteristic was that the estimated coefficient for the business-to-consumer (b2c), one of the control variables, was significantly positive in all the estimation models. That is, B-to-C firms demand improvement of the external environment in all categories; in other words, they have a higher demand level relating to the transport and logistics environment.
As said before, the eastern firm dummy had a significant positive effect only on the demand for improvement regarding the “enhancement of transportation services for special freight”. It may be said that the need for transportation services for special freight in the eastern region is particularly high, or that the service providers are particularly lacking. In any case, on this issue, elements other than the factors introduced as control variables are having a strong effect in the eastern region.
As a whole, in the great majority of models the coefficient for east was not significant,
which means that among the managements of firms in the eastern region, the managements in a
position where they should naturally demand improvement, considering their external conditions
(lack of infrastructure, etc.) and their company’s own characteristics (B2C firms, etc.), respond
that it is necessary, and those not in such a position do not recognize a necessity. In other words,
Table 8: The Estimation Results for the Demand Pr omotion Factors
Model[1][2][3][4][5][6][7][8] EstimatorOrdered ProbitOrdered ProbitOrdered ProbitOrdered ProbitOrdered ProbitOrdered ProbitOrdered ProbitOrdered Probit Dependent Variablelogiinfradevlogiinfrarestransfeetransregtransantitransquacustom spectrans east0.0960.1200.1510.1560.277-0.1280.1000.356* (0.16)(0.16)(0.16)(0.16)(0.18)(0.17)(0.22)(0.20) raildens-0.002**-0.002***-0.002***0.000-0.002*-0.002**-0.001-0.001 (0.00)(0.00)(0.00)(0.00)(0.00)(0.00)(0.00)(0.00) staown0.280*0.1870.0460.277*0.2670.2580.2590.268 (0.16)(0.13)(0.17)(0.15)(0.16)(0.16)(0.19)(0.16) b2c0.285**0.276**0.188*0.223**0.507***0.355***0.459***0.425*** (0.12)(0.11)(0.11)(0.11)(0.12)(0.11)(0.13)(0.12) forpart0.1770.236*0.212*0.203*-0.0030.1830.564***0.274* (0.13)(0.12)(0.12)(0.12)(0.13)(0.13)(0.14)(0.14) inputrange-0.0070.0450.101*0.0270.050-0.009-0.0050.003 (0.05)(0.05)(0.05)(0.05)(0.05)(0.05)(0.06)(0.06) outputrange0.032-0.0010.089-0.0250.0840.0640.0630.107* (0.06)(0.06)(0.06)(0.06)(0.06)(0.06)(0.06)(0.06) Industry Dummiesyesyesyesyesyesyesyesyes N528531563546508506405430 Wald Test (x2 )1 65.23***77.29***89.15***36.73**87.29***59.28***598.25***72.39 Pseudo R20.010.060.080.030.070.050.090.06 Log likelihood-514.82-512.42-507.46-563.40-511.43-513.63-513.63-430.43 Notes:1. Null hypothesis: all coefficients are zero. 2. The figures in parenthesis are robust standard errors. *** = significance level of 1%; ** = significance level of 5%; and * = significance level of 10%; Source:Author’s estimates. For the semantic content and definition and the descriptive statistics for each variable, see Table 7the concerns of an “external-dependent pattern of thinking or bias” mentioned at the end of the previous section was not identified.
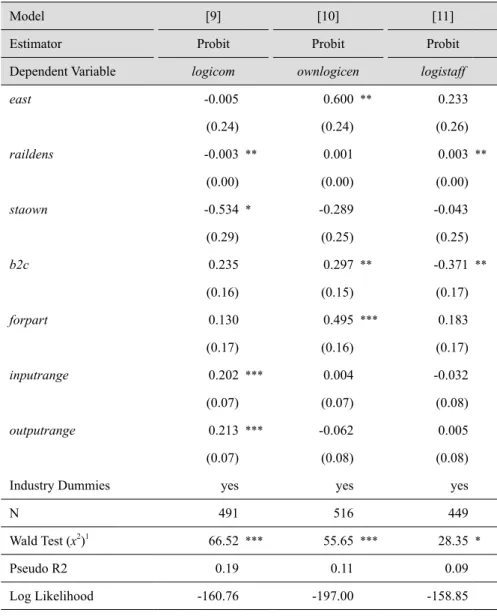
4.3 Factors Promoting Firms’ Independent Efforts
The estimation results of the probit models taking the three variables of logicom, ownlogicen, and logistaff, as dependent variables are as shown in Table 9.
Table 9: The Estimation Results for the Independent Effort Promotion Factors
Model [9] [10] [11]
Estimator Probit Probit Probit
Dependent Variable logicom ownlogicen logistaff
east -0.005 0.600 ** 0.233
(0.24) (0.24) (0.26)
raildens -0.003 ** 0.001 0.003 **
(0.00) (0.00) (0.00)
staown -0.534 * -0.289 -0.043
(0.29) (0.25) (0.25)
b2c 0.235 0.297 ** -0.371 **
(0.16) (0.15) (0.17)
forpart 0.130 0.495 *** 0.183
(0.17) (0.16) (0.17)
inputrange 0.202 *** 0.004 -0.032
(0.07) (0.07) (0.08)
outputrange 0.213 *** -0.062 0.005
(0.07) (0.08) (0.08)
Industry Dummies yes yes yes
N 491 516 449
Wald Test (x2)1 66.52 *** 55.65 *** 28.35 *
Pseudo R2 0.19 0.11 0.09
Log Likelihood -160.76 -197.00 -158.85
Notes: 1. Null hypothesis: all coefficients are zero.
2. The figures in parenthesis are robust standard errors. *** = significance level of 1%; ** = significance level of 5%; and * = significance level of 10%;
Source: Author’s estimates. For the semantic content and definition and the descriptive statistics for each variable, see Table 7
In model [9] which analyzed the utilization of comprehensive distribution firms, the
estimation result was that the regression coefficient for east was non-significant, whereas
inputrange and outputrange both had significant positive coefficients, and conversely raildens
had a significant negative coefficient. Considered in conjunction with the analysis results in the previous section of there being many firms utilizing comprehensive distribution firms in the eastern region, the possible interpretation is that external services are being used proactively in the eastern region, as there are many firms undertaking long-distance procurement and shipment, and there are limits for them to tackle the issues by themselves.
In model [10] which analyzed the establishment of own-company distribution facilities, the effect of east was estimated to be significant and positive. The coefficients for forpart and b2c were also significant positive ones, but in terms of the magnitude of coefficients, east was the largest. This result shows that the special circumstances of the eastern region have a strong impact which cannot be explained by the independent variables introduced into this model.
As discussed in Section 2, the current situation in the special zones of the Russian Far East witnesses the unsatisfied needs of firms for warehousing and services incidental to transportation.
Given such circumstances, the estimation results of this model suggest that the provision of transportation-related services including commercial warehousing and logistics centers is lacking in the eastern region.
Regarding the utilization and nurturing of specialist logistics personnel, the analysis of the previous section gave the result of the eastern region being lower for this. In the regression analysis results here (model [11] ), the regression coefficient for east was non-significant. On the other hand, a significant positive coefficient was estimated for raildens, and a significant negative coefficient for b2c. Taken together with the model estimation results on the utilization of comprehensive distribution firms mentioned above, in regions where railway density is low, firms don’t undertake the utilization and nurturing of specialist logistics personnel in house, but have a tendency to pursue outsourcing.
5. Conclusion
In this paper, based on the results of the 2015 ERINA Survey, the author attempted to grasp, via comparison with the western region, the actual situation for eastern Russia’s transport and logistics environment.
From the simple east–west comparison of the aggregated results, it was shown that although the east–west difference was small in terms of company activities to tackle logistics problems by investing a certain amount of their own resources, in terms of making demands externally (other players), there was a tendency for eastern firms to strongly demand improvement.
In so doing, the demand for improvement of eastern firms doesn’t stop only at the development of infrastructure, but extends into wide-ranging areas, including the reduction of the burden of transportation costs in particular, and other institutions and policy as well as the quality and breadth of transportation services.
Regarding such demands for improvement, according to the testing via multivariate
analysis, the author reached the conclusion that it is proper to interpret the result in such a way
that there are many firms hoping for improvement in the eastern region, as there are many
firms which necessitate the improvement of the transport and logistics environment from such
matters as the external conditions and the firm’s characteristics. That is, it is not the case that the
managements of eastern firms are groundlessly taking up “demand for demand’s sake”. When
talking with Russians, one often hears “the residents of the Far East are too used to support from
the center, and there is a tendency to demand things originally unnecessary”, but such a tendency
cannot be seen from the managements of firms targeted in the ERINA Survey.
To summarize this conclusion, the transportation and logistics environment of eastern Russia is inferior in comparison with the western region, and improvement in both hard and soft aspects is necessary. On this point, because it is considered that the managements of firms have reasonable demands, it will be necessary for Russia’s federal and regional policymakers to seriously confront such demand from eastern firms.
Acknowledgement
The paper is one of the outcomes of the research project “Market Quality in the Far East:
from Viewpoint of Company Management” sponsored by the Economic Research Institute for Northeast Asia (ERINA). The preliminary research findings were presented at several workshops and seminars, including the Russia-Japan Seminar “Quality of Market according to Company Management” in Vladivostok, March 6, 2017 and a session at the second World Congress of Comparative Economics in Saint Petersburg, June 15-17, 2017. The author expresses sincere gratitude to Yoshiaki Nishimura, former Representative Director of ERINA, for his initiative for the project, as well as the project members and participants of the seminars for their valuable comments.
* Director and Senior Research Fellow, Research Division, Economic Research Institute for Northeast Asia (ERINA)
1
For the details of the ERINA Survey, see Arai and Iwasaki (2016).
2
Cargo handling volumes and container figures from Mortsentr (2018).
3
In Russia’s Far Eastern ports, there are the cases of cargo-handling machinery such as cranes being decrepit, and the railway sidings to wharves being few.
4
The Port of Vladivostok and the Port of Nakhodka are in urban areas, and enlarging the area for wharves is extremely difficult.
5
In these special zones, only those firms which have obtained the status of “resident” are able to enjoy the preferential treatment stipulated in the special zone systems. When applying to become resident firms, it is required that they make clear the business they plan to engage in. At that time, there are many cases of applications which also include other incidental business in the original business.
6


![Table 8: The Estimation Results for the Demand Promotion Factors Model[1][2][3][4][5][6][7][8] EstimatorOrdered ProbitOrdered ProbitOrdered ProbitOrdered ProbitOrdered ProbitOrdered ProbitOrdered ProbitOrdered Probit Dependent Variablelogiinfradevlogiinfra](https://thumb-ap.123doks.com/thumbv2/123deta/7070635.2310178/18.892.101.739.142.1134/estimatorordered-probitordered-probitordered-probitordered-probitordered-probitordered-probitordered-variablelogiinfradevlogiinfra.webp)