Distributed Genetic Algorithms with Randomized Migration Rate
Tomoyuki HIROYASU*, Mitsunori MIKI** and Masami NEGAMI***
Department of Knowledge Engineering and Computer Sciences, Doshisha University,
Kyo-tanabe, Tatara Miyakodani l-3, Kyoto, 610-0321, Japan
*[email protected]
**[email protected]
***[email protected]
ABSTRACT
This paper discusses the effect of randomization of migration rate in distributed genetic algorithms (DGAs). DGAs are extended al- gorithms of GAS that can be performed in parallel. In DGAs, the total population of genes is divided into subpopulations called is- lands. In each island, a simple GA is performed and some of the individuals in each island are moved to another island after a cer- tain migration interval. The number of genes in the DGA is deter- mined by the migration rate. Although DGAs can find optimum solutions even when there are several peaks in objective functions, they require more parameters than simple GAS and are therefore more time intensive. In this study, we describe a new DGA in which the migration rate is randomized (DGA/rmr). This algo- rithm is evaluated using two numerical simulations: the Rastrigin function and the Rosenbrock function. We show that optimal pa- rameters exist in these systems and obtain solutions with the pro- posed approach. The solutions are not optimal, but are better than those obtained using a DGA with fixed migration rate. DGA/rmr may therefore be a less time intensive alternative to conventional DGAs.
1. INTRODUCTION
The genetic algorithm (GA) is an optimization method that mim- ics the process of evolution [ 11. This method has recently received much attention because of its suitability in optimization problems involving discrete factors. GAS, for example, can find optimum solutions even when there are several peaks in objective functions.
The utility of GAS, however, suffers from the number of iterations required to find a solution.
One solution to this problem is to conduct GAS in parallel.
Generally, each genetic operations besides selection can be per- formed parallel and it is said that GAS have intrinsic parallelisms [2]. The Distributed Genetic Algorithm (DGA) is one common method of running GAS in parallel.
In DGAs, the total population is divided into subpopula- tions called islands. After a predetermined number of generations (the migration interval), some genes are moved to another island at a predetermined migration rate (defined as the number of genes migrating per migration event). It is reported that the DGA can be performed in parallel but also can derived the good solutions with small calculations [3],[4]. The populations size of each island is smaller than that of a GA, so that local solutions can be reached
quickly. However, because of the existence of islands and the op- eration of migration, the variety of solutions are kept in DGAs.
One disadvantage of GAs is that there exist several param- eters. These parameters affect both the accuracy of the solutions and the calculation time. To overcome this problem, many research- ers have determined these parameters using an adaptive method.
Hasser [5], for example, introduced a GA in which the mutation rate is changed with respect to the time schedule. In another study, Srinivas [6] described GAS whose crossover rate and mutation rate are determined with adaptive stochastic numbers. Miki et al. [7]
introduced a new method call Distributed Environmental Genetic Algortihms in which the crossover and mutation rates are different in each island. Using this method, the best solutions are derived automatically in each environment.
DGAs have two additional parameters than GAS: the mi- gration interval and the migration rate. These parameters are also affect to the accuracy of the solutions and the calculation time. It is also very useful if these parameters can be determined automati- cally. However, there are very few studies are concerned with the adaptive method or automatically determination method of these parameters.
In this study, we introduce DGAs in which the migration rate is random and called this algorithm Distributed Genetic Algo- rithm with Randomized Migration Rate (DGA/rmr). We apply this algorithm to two test functions and compare the effectiveness of DGA/rmr with a traditional DGA.
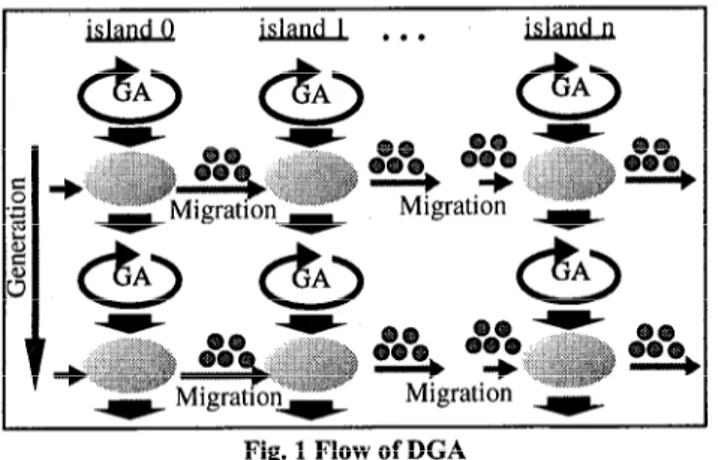
2. DISTRIBUTED GENETIC ALGORITHMS The genetic algorithm (GA) is an optimization method that de- rives its behavior from a metaphor of same of the mechanisms of evolution in nature. In GAS, there is only one population but there are some sub populations that are called islands in distributed ge- netic algorithms (DGAs). On the other hand, the normal GAS that have one population can be called Canonical GAS (CGAs). In DGAs, normal GAS’ operations are performed in each island. In some period, some of individuals are chosen from islands and move to another islands. This performance is called migration. The pe- riod of migration is fixed or selected randomly and this period of migration is called migration interval. The number of genes that migrate to another sub population is determined with migration rate. Migration period and migration rate are parameters for DGAs.
The conceptual flow of the DGAs is shown in Fig. 1.
There are several models for migration in DGAs, includ- ing the stepping stones population model and the random migra-
Fig. 1 Flow of DGA
tion model [S]. In the stepping stones model, the target island to which the individuals migration is determined in advance, as shown in Figure 2. This model is design for use with massive parallel computing networks.
Fig. 2 Stepping stone model
In the random migration model, the target island is chosen randomly at every migration event, as shown in Figure 3. This model is suited for PC cluster parallel machines. In this study, the latter model is used.
0 l l
l-stImigration 2-nd Imigration Fig. 3 Random migration model
There are also several methods of migration in DGAs [9], including a model where only elite individuals migrate and one where individuals are chosen randomly and selected by tourna- ment method [lo]. In this study, both the target island and the individuals that migrate are chosen randomly. In this case, the elites are not considered.
DGAs are the algorithms that fit to the parallel machines.
DGAs can, in general, derive better solutions with smaller num- bers of iterations compared to GAS since the population of each island is smaller in DGAs. Fewer iterations are required to con- verge upon a local optimum for each island. Usually the number of call of the fitness function decreases when the solutions are con- verge. However, because each island converged to the different local optima, there are a variety of solutions from a global point of view. After the information of these different optima is exchanged by migration, the global optimum is achieved.
3. DISTRIBUTED GENETIC ALGORITHM WITH RANDOMIZED MIGRATION RATE
In this study, we introduce an extended DGA in which the migra- tion rate is not fixed but determined randomly. This strategy is called Distributed Genetic Algorithm with Randomized Migration Rate (DGA/rmr).
In DGA/rmr, the migration is operated synchronously at each migration interval. The migration island is determined ran- domly at each migration event. Individuals that migrate are also determined randomly with uniform numbers ranging from 0.0 to 0.5. The process of migration in DGA/rmr is illustrated in Figure 4.
island island... island
Fig. 4 Flow of DGAhmr
Since the number of individuals that migrates to other is- lands is determined randomly, the number of individuals that come from a given island may be different from the number of individu- als that leave that island. Therefore, the population size of each island changes with each migration event.
In the following chapter, the DGA/rmr is applied to the typical test functions and discuss the effect of the solutions. In the following chapter, it is also make clear that one of the parameters, the migration rate, is not needed to determined precisely by the DGA/rmr.
4. NUMERICAL SIMULATIONS 4.1 Test functions
To evaluate the performance of DGA/rmr, this algorithm was used to maximize two standard test functions, the Rastrigin function and the Rosenbrock function [ 111. These functions are expressed by equations (1) and (2), respectively, and the landscapes of these functions with two design variables are shown in Figure 5 and Fig- ure 6. The optimum solutions of both functions exist on the origin and have values of 0.
Rastrigin function is
f =-lOn-;& (X’- 1ocos (2-a). . . . Rosenbrock function is
f=-.&( 100(x, -.;)*+(x;- I)*) . . .
(2)Although the Rastrigin function has a relatively large area of local optima, GA can find global optima easily because each design variable is independent to objective. The Rosenbrock func- tion, on the other hand, has only one peak in the design fields, but it is very difficult to find an optimum using DGA because the each design variable is not independent to objective.
Fig. 5 Rastrigin function - * _
Fig. 6 Rosenbrock function
In this study, only two types of test functions are treated but those are the type of functions whose optima can be found easily and not easily by GA. Therefore, it can be said that the effectiveness of DGA/rmr can be described by these two types of test functions.
4.2 Maximization of the Rastrigin function
Below we describe the use of DGA and DGAkmr for the maximi- zation of the Rastrigin function and compare the solutions found by the algorithms. The parameters for the DGA are shown in Table 1. Simulations were terminated when the differences of maximum and minimum values for an island were less than 0.001. We define this condition as convergence. Each value reported is an average of 20 trials.
Table 1 Parameters of GA total population size 1 400.640 and 800 crossover rate 0.6
mutation rate 0.0 island number
migration interval From 1 to 20
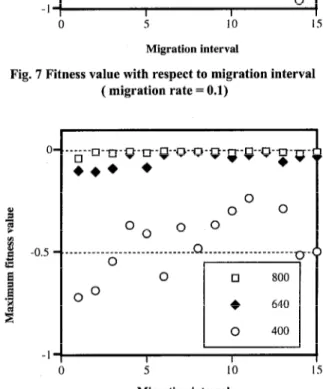
migration rate 0.1,0.2,0.3,0.4,0.5 and random To evaluate the effect of population size, migration rate and migration interval on optima, we used DGA to find the opti- mum of the Rastrigin functions. In this experiment, we examined population sizes of 400,640, and 800. Figure 7 and Figure 8 show the final fitness values with respect to migration intervals when the migration rate is 0.1 and 0.5.
The data in Figure 7 and Figure 8 show that a population size of 800 is sufficient to find an optimum for the Rastrigin kmc- tion. Similar results were obtained when the migration rate was set to 0.2,0.3, or 0.4. Solutions to the function for this population size were independent of both the migration rate and the migration interval.
When the population size is 400, DGA can find only local optima for the Rastrigin function. Under these conditions, the maximum fitness value of the function is affected by both the mi-
0
o”
0.o..o__~___~___________~________o__o_______~____
pYq O
l 640
5 10
Migration interval
Fig. 7 Fitness value with respect to migration interval ( migration rate = 0.1)
(
-0.5
-1
OO _ _ _ _ _ _.
0 O0
0 5 10
Migration interval
Fig. 8 Fitness value with respect to migration interval ( migration rate = 0.5)
gration rate and the migration interval. When the migration rate is 0.1, for example, a migration interval of 8 produces the maximum value. When the migration rate is 0.5, a migration interval of 11 derives the maximum value. Therefore, when the total population is not enough to find the optimal, the maximum value is depend on migration rate and migration interval. This optimum migration is not fixed.
When the simulation is converged, sometimes every is- land is not converged at the same solution. Figure 9 illustrates the maximum, minimum, and average values of maximum value in each island of the Rastrigin function at a migration rate of 0.1.
When the migration interval is less than 5, the maximum and mini- mum values for each island converge. When the interval is greater than 5, however, the local maxima and minima do not converge to the same solution. Similar results were obtained with migration rates of 0.2,0.3, 0.4,or 0.5. Therefore, there is no guarantee that specific value is found. Sometimes found bigger and sometimes smaller values are found. These data also suggest that it is diffr- cult for DGA to determine the optimal migration rate and migra- tion interval when the population size is too small.
-0.6 -.__~____________________________________~_______________
-0.7 I I I I I I
0.1 0.2 0.3 0.4 0.5 random Migration rate
I I I
0 5 10 1.5
Migration interval
Fig. 9 Max, min and ave values of fitness function (migration rate = 0.1)
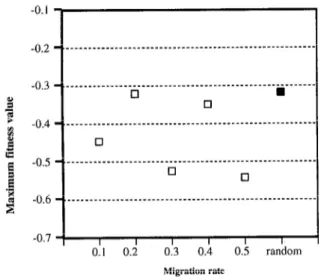
We next used DGA/rmr to determine the maximum values of the Rastrigin function. The migration rates were randomly se- lected values between 0.0 and 0.5. Figures 10, 11, and 12 show fitness values with respect to migration rate. Migration intervals of 3, 6, and 9 were used for Figures 10, 11, and 12, respectively.
These data show that DGA/rmr derives better values than DGA for each migration interval tested and suggest that both migration rate and migration rate can be random in DGAkmr.
From Fig. 10, 11 and 12, it is found again that the best migration rate that derives best value is different when the migra- tion interval is different. On the other hand, DGAkmr that uses randomized migration rate derives the better values compared to the other values. Therefore, it can be said that not only the migra- tion rate but the migration interval is not determined in DGA/rmr.
Figure 13 depicts the total number of function calls with respect to migration interval and migration rate. The number of function calls in DGA/rmr is similar to that of DGA with fixed migration rates for low migration intervals, but is slightly higher than that of DGA at higher migration intervals. One explanation for this trend is that the population size in DGA/rmr the population size is not fixed, but fluctuates with every migration event. When there is a large difference between populations of islands, a wast-
-0.3 _____________________________________________---~----
0 n
s 0
5 -0.4 _______________._______________________________-_--- I P
B q
lil g
-0.5 ________________________________________~--- 0
E 0
‘R is
-0.6 ___________________________________________---
-0.7 1 I I I I I I I
0.1 0.2 0.3 0.4 0.5 random
Migration rate
Fig. 10 Maximum fitness values of population size=400 (migration interval = 3)
Fig. 11 Maximum fitness values of population size=400 (migration interval = 6)
-0.1 fi
-0.2 _.___________________________ ___________ __ _______--- - 0
0 q
-0.3 _,_____________________________ _______ ____ _______~~~~~~~~-
0 0
-0.4 _ ______a_____________-______________________ __________
-0.5 _,______________________ _____ * ____________~~~~~~~~~~--- -.
45 _.______________________ _______________ _ __~~~~~~~~_ ---.
-0.7 I I I I I I
0.1 0.2 0.3 0.4 0.5 random Migration rate
Fig. 12 Maximum fitness values of population size=400 (migration interval = 9)
20000 -/
1
19000
-I ________________________________________---
4 l1
0 2 4 6 8
migration interval Fig. 13 Total number of function call
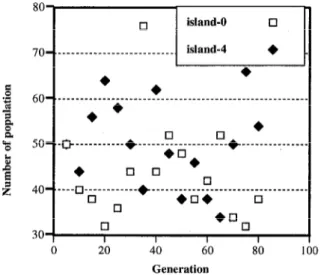
ing of synchronous waiting time occurs. This concept is illus- trated in Figure 14, where the population of two islands (island 0 and island 4) is shown with respect to generation. Each island maintains a population of 50 in DGA, but changes population with each migration event in DCiA/rmr. This difference wastes syn- chronous waiting time.
80
bU- ______________________________________________________
+* l
5o_._~___________*~_____~_~____~~~_~_____________
l !I 0 *
4o_.____~_6_________~____~_~_~*~________*~________, 0
30 0 I I I I
0 20 40 60
Generation
-I
80 100
Fig. 14 Number of population in each island One solution to this problem is to perform the migration operation asynchronously. This topic is the subject of future work.
4.3 Maximization of the Rosenbrock function
DGA and DGAIrmr are also implemented for the problem where the value of the Rosenbrock function is maximized. The following results that are very similar to the results that are de- rived from the rastrigin function. The parameters of GA are the same to Table 1 and all results are the average of 20 trials.
We also used DGA and DGAIrmr to find maximum values for the Rosenbrock tin&on. The following results are very simi- lar to the results that are derived from the rastrigin function. For this study, we used the parameters listed in Table 1. All results are the average of 20 trials.
Figure 15 shows the maximum fitness value found by DGA with respect to the migration interval and population size. It is clear from these data that DGA cannot find an optimal value for this function, even though there is only one peak value. This result is not unexpected, however, since there is a relationship be- tween the design variables in this function. It is very difficult for GAS to find the optimum of this type of functions.
The maximum values of the Rosenbrock function are shown with respect to migration rate in Figure 16 and Figure 17. In these figures the population size is 320, and the migration interval is 6 and 9, respectively.
These data show that the values produced by DGAkmr are very good compared to the results from DGA with fixed migration rate. We believe that DGA/rmr was more successful than DGA because it is able to find an optimum or suboptimum migration rate through its random mechanism.
-2
-3
-“-
Migration interval
Fig. 15 Fitness value with respect to migration interval ( migration rate = 0.1)
-0.6
-0.7
-1
._ Cl 0 ._
._
(
1.5
I
q
.__________________________---,
q
q q
q
I I I I I I
0.1 0.2 0.3 0.4 0.5 random Migration rate
Fig. 16 Maximum fitness values of population size=320 (migration interval = 6)
-0.6 -
n 0
-0.8 - .___ ________ _____________________ ______________________
0 c3
J -I-. _______________________________________________________ 0 I
$ S
-1.2 -._ _______ _ _________________ ____________________________
q
-1.4 I I I I I I
0.1 0.2 0.3 0.4 0.5 random Migration rate
Fig. 17 Maximum fitness values of population size=320 (migration interval = 9)
5. CONCLUSIONS
In this paper, a new distributed genetic algorithm approach called Distributed Genetic Algorithm with Randomized Migration Rate (DGA/rmr) is proposed. We implement DGA/rmr to minimize two test functions, the Rastrigin function and the Rosenbrock func- tion. From these numerical simulations, we conclude the follow- ing:
1) When the population size is large enough, solutions are inde- pendent of migration interval and migration rate in DGA.
2) When the population size is too small, solutions are dependent on the migration rate and migration interval. It is therefore diffi- cult to find the optimal migration rate and migration interval in these systems.
3) DGA/rmr obtains good results at all migration intervals for both the Rastrigin and Rosenbrock function. These results suggest that both the migration rate and the migration interval need not be defined in order to find good solutions.
4) One disadvantage of DGA/rmr is that the population size of a given island changes with every migration event. These changes in island size produced synchronous wasting time in this algorithm.
Efforts to solve this problem are the subject of current research.
Reference
[ 11 J. H. Holland, Adaptaion in natural and Artificial Systems, University of Michigan Press, 1975.
[2]D. E. Goldberg, Genetic Algorithms in Search, Optimization and Machine Learning, Addison-Wesley, Reading, MA, 1989.
[3]R. Tanese, Distributed Genetic Algorithms, Proc. of 3th Int.
Conf. Genetic Algorithms, 1989, pp. 432-439.
[4JT. C. Belding, The Distributed Genetic Algorithms Revised, Proc.
of 6th Int. Conf. Genetic Algorithms, 1995, pp. 114- 12 1.
[5]J. Hasser and R. Manner, Towards an Optimal Mutation Prob- ability in Genetic Algorithms, Proc. of 1 st Int. Int. Conf. on Paral- lel Problem Solving from Nature, 1990, pp. 23-32.
[6]M. Srinivas and L. M. Patnail, Adaptive Probabilities of Cross- over and Mutation in Genetic Algorithms, IEEE Transactions on Systems, Man and Cybernetics, Vol. 24, No. 4, 1994, pp. 656-657.
[7]M. MIKI, T. HIROYASU and K. HATANAKA, Parallel Ge- netic Algorithms with Distributed-Environment Multiple Popula- tion Scheme, Proc. 3rd World Congress of Structural and Multidisciplinary Optimization (WCSMO), Vol. I, 1999, pp. I86- 191.
[8]J. Nang and K. Matsuo, A Survey on the Parallel Genetic Algo- rithms, J. SICE, Vol. 33, No.6, 1994, pp. 500-509.
[9]D. Whitley, et. al., Island Model Genetic Algorithms and Lin- early Separable Problems, Proc. of AISB Workshop on Evolution- ary Computation, 1997.
[ lO]V. S. Gordon and D. Whitley, Serial and Parallel Genetic Al- gorithms as Function Optimizers, Proc. of 5th Int. Conf. Genetic Algorithms, 1993.
[l l]D. Whitley, et. al., Building Better Test Functions, Proc. of 6th Int. Conf. Genetic Algorithms, 1995.