Session 11: Evaluation I
担当: 加藤(京都大学)
Evaluation I
1. On the Measurement of Test Collection Reliability
Julián Urbano (University Carlos III of Madrid), Mónica Marrero (University Carlos III of Madrid), Diego Martín (Technical University of Madrid)
テストコレクションの信頼性分析: クエリは少なくとも130使え
2. Deciding on an Adjustment for Multiplicity in IR
Experiments
Leonid Boytsov (Carnegie Mellon University), Anna Belova (Abt Associates Inc), Peter Westfall (Texas Tech University)
情報検索索での多重⽐比較: Family-wise errorに気をつけろ
3. Preference Based Evaluation Measures for Novelty
and Diversity
Praveen Chandar (University of Delaware), Ben Carterette (University of Delaware)
⽐比較ベースの新規性・多様性考慮型評価指標: 評価はユーザに委ねろ
テストコレクション
(
Cranfieldモデル)
} ⽂文書集合,トピック(≒クエリ),適合⽂文書, 検索索評価指標のセット(ベンチマークのようなもの)G1
G2
B1
B2
検索システム トピック 京都 観光 ハリーポッター … 1 2 3 4 5 6 トピック 適合 京都 観光 1, 4 ハリーポッター 5 … 文書集合 検索評価指標 • P@k • MAP • nDCG 100点 60点 100点 0点 クエリ: 京都 観光 1 4 1 3 4 1 nDCG 5 2テストコレクションの一例
}
TREC (Text REtrieval Conference) Web Track
} ⽂文書集合: ClueWeb (10億のWebページ)
} クエリ: 50個 (e.g. disneyland hotel, gps, etc.)
} 適合⽂文書: 50クエリに対する適合⽂文書(⼈人⼿手で決定)
} 検索索評価指標: MAP, nDCG
http://trec.nist.gov/data/web09.html
On the Measurement of Test Collection Reliability Julián Urbano, Mónica Marrero Diego Martín
} ⽬目的 } Generalizability Theoryを使ってテストコレクションの 信頼性を検証する⽅方法の詳細を検討 } 信頼性 1. 得られた評価指標の値がどれくらい安定しているか 2. 得られたシステム間の差がどれくらい安定しているか トピック 京都 観光 ハリーポッター … 検索評価指標 • P@k • MAP • nDCG 検索システム 文書 適合度 文書A 4 文書B 5 … Qrel 0.8 0.7 評価指標の値 2
テストコレクションの信頼性の測り方
1. 以下のものを減らしてみる } トピック数 } システム数 (or Qrel数) 2. 評価指標の値・検索索システムの順位の変化を計測 6 Session N: XXX 担当:○○(XX大) トピック 京都 観光 ハリーポッター … 検索評価指標 • P@k • MAP • nDCG 検索システム 文書 適合度 文書A 4 文書B 5 … Qrel 0.8 0.7 評価指標の値 2 1Generalizability Theory [Bodoff and Li, 2007]
} ANOVA的にシステム・クエリによる分散を推定 } クエリ数: nq } システムによる分散: σs2 } クエリによる分散: σq2 } システム+クエリによる分散: σs:q2 } Generalizability Coefficient システム間の差の安定性} Index of Dependability
評価指標の値の安定性
E
ρ
2=
σ
2 sσ
2s+
σ
2s:q/ n
qΦ =
σ
2 sσ
2s+ (
σ
2s+
σ
2s:q) / n
qGeneralizability Coefficient
の歴史
8 Session N: XXX 担当:○○(XX大)
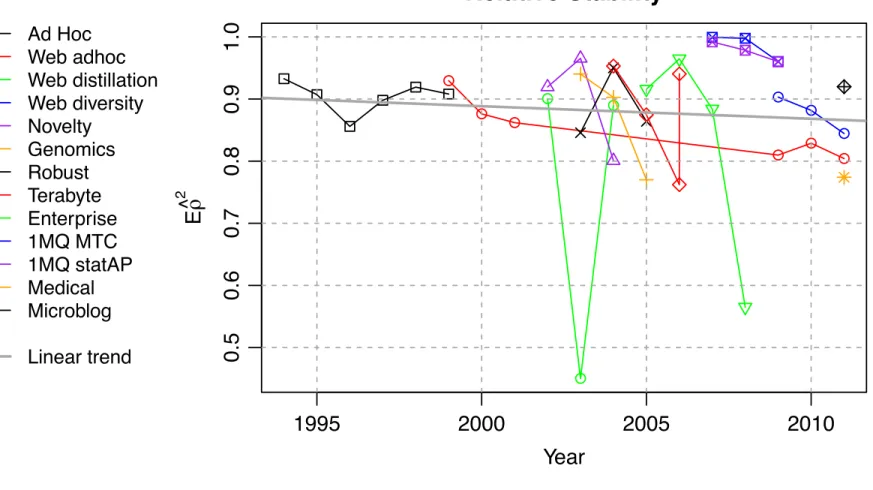
全体的にテストコレクションの信頼性は低下・・・?
Ad Hoc Web adhoc Web distillation Web diversity Novelty Genomics Robust Terabyte Enterprise 1MQ MTC 1MQ statAP Medical Microblog Linear trend 1995 2000 2005 2010 0.5 0.6 0.7 0.8 0.9 1.0 Relative Stability Year E ρ^ 2 1995 2000 2005 2010 0 5 10 15 20 25Variability due to Systems
Year σ^ s 2 (% of total) 1995 2000 2005 2010 30 40 50 60 70 80 90
Variability due to Queries
Year
σ^ q
2 (% of total)
Figure 4: Historical trend of relative stability (left), variability due to systems (middle) and to queries (right).
clear and easily understandable meaning. Based on these
results, we reviewed the reliability of 43 TREC test
collec-tions, evidencing that some of them are very little reliable.
We show that the traditional choice of 50 queries is clearly
not enough even for stable rankings, and in most cases a
couple hundred queries are needed. Our results also show
that the ideal query set size varies significantly across tasks,
suggesting that we avoid the use of some fixed size such as 50
or 100 and that we analyze tasks and collections separately.
There are two clear lines for future research. First, we
completely ignored the assessor facet in our study. It is
ev-ident that different assessors provide different results, so it
would be interesting to include them in the analysis.
Sec-ond, although we fitted the theoretically correct models, it
is clear that they can be improved (see for instance Power
and RMS Error in Figure
3
). IR evaluation experiments
generally violate assumptions of GT, such as normality of
distributions and random sampling, so different models and
features to better fit the actual data should be investigated.
We created some scripts for the statistical software R that
can help researchers perform all these computations to easily
assess the reliability of custom test collection designs. They
can be downloaded from
http://julian-urbano.info.
7. REFERENCES
[1] J. Allan, J. A. Aslam, B. Carterette, V. Pavlu, and
E. Kanoulas. Million Query Track 2008 Overview. In
Text REtrieval Conference
, 2008.
[2] J. Allan, B. Carterette, J. A. Aslam, V. Pavlu,
B. Dachev, and E. Kanoulas. Million Query Track
2007 Overview. In Text REtrieval Conference, 2007.
[3] C. Arteaga, S. Jeyaratnam, and G. A. Franklin.
Confidence Intervals for Proportions of Total Variance
in the Two-Way Cross Component of Variance Model.
Communications in Statistics: Theory and Methods
,
11(15):1643–1658, 1982.
[4] D. Banks, P. Over, and N.-F. Zhang. Blind Men and
Elephants: Six Approaches to TREC data.
Information Retrieval
, 1(1-2):7–34, 1999.
[5] D. Bodoff. Test Theory for Evaluating Reliability of
IR Test Collections. Information Processing and
Management
, 44(3):1117–1145, 2008.
[6] D. Bodoff and P. Li. Test Theory for Assessing IR Test
Collections. In ACM SIGIR, pages 367–374, 2007.
[7] R. L. Brennan. Generalizability Theory. Springer,
2001.
[8] C. Buckley and E. M. Voorhees. Evaluating Evaluation
Measure Stability. In ACM SIGIR, pages 33–34, 2000.
[9] B. Carterette, V. Pavlu, E. Kanoulas, J. A. Aslam,
and J. Allan. Evaluation Over Thousands of Queries.
In ACM SIGIR, pages 651–658, 2008.
[10] B. Carterette, V. Pavlu, E. Kanoulas, J. A. Aslam,
and J. Allan. If I Had a Million Queries. In ECIR,
pages 288–300, 2009.
[11] L. S. Feldt. The Approximate Sampling Distribution
of Kuder-Richardson Reliability Coefficient Twenty.
Psychometrika
, 30(3):357–370, 1965.
[12] E. Kanoulas and J. A. Aslam. Empirical Justification
of the Gain and Discount Function for nDCG. In
ACM CIKM
, pages 611–620, 2009.
[13] W.-H. Lin and A. Hauptmann. Revisiting the Effect of
Topic Set Size on Retrieval Error. In ACM SIGIR,
pages 637–638, 2005.
[14] S. Robertson and E. Kanoulas. On Per-Topic Variance
in IR Evaluation. In ACM SIGIR, pages 891–900,
2012.
[15] T. Sakai. On the Reliability of Information Retrieval
Metrics Based on Graded Relevance. Information
Processing and Management
, 43(2):531–548, 2007.
[16] M. Sanderson. Test Collection Based Evaluation of
Information Retrieval Systems. Foundations and
Trends in Information Retrieval
, 4(4):247–375, 2010.
[17] M. Sanderson and J. Zobel. Information Retrieval
System Evaluation: Effort, Sensitivity, and Reliability.
In ACM SIGIR, pages 162–169, 2005.
[18] R. J. Shavelson and N. M. Webb. Generalizability
Theory: A Primer
. Sage Publications, 1991.
[19] J. Urbano, M. Marrero, and D. Mart´ın. A Comparison
of the Optimality of Statistical Significance Tests for
Information Retrieval Evaluation. In ACM SIGIR,
2013.
[20] E. M. Voorhees. Variations in Relevance Judgments
and the Measurement of Retrieval Effectiveness. In
ACM SIGIR
, pages 315–323, 1998.
[21] E. M. Voorhees. Topic Set Size Redux. In ACM
SIGIR
, pages 806–807, 2009.
[22] E. M. Voorhees and C. Buckley. The Effect of Topic
Set Size on Retrieval Experiment Error. In ACM
SIGIR
, pages 316–323, 2002.
[23] E. Yilmaz, J. A. Aslam, and S. Robertson. A New
Rank Correlation Coefficient for Information
Retrieval. In ACM SIGIR, pages 587–594, 2008.
[24] J. Zobel. How Reliable are the Results of Large-Scale
Information Retrieval Experiments? In ACM SIGIR,
pages 307–314, 1998.
Take-away Messages
} システム間の差の安定性 ≧ 95%を得るには? } クエリ数 ≧ 80 } タスクによってこれは変わるので⼀一概には⾔言えない } 評価指標の値の安定性 ≧ 95%を得るには? } クエリ数 ≧ 130 } [Web Ad-‐‑‒hoc検索索] システム間の差の安定性: [0.8, 0.93] 〜~ ケンドールτ: [0.53, 0.81]Deciding on an Adjustment for Multiplicity in IR Experiments Leonid Boytsov, Anna Belova (Abt Associates Inc)
} IRにおける多重⽐比較のp値調整 } 多重⽐比較をするときには「少なくとも1つのfalse positive」が出る確率率率がα (e.g. 0.05) 以下になるように 調整 } 特にIRの実験環境ではどんな⾵風にするとよいのか 10 Session N: XXX 担当:○○(XX大)
多重比較の注意点
(family-wise error)
} 各群間で単純にt検定を⾏行行ってはいけない nDCG システムA システムB システムC クエリ1 0.4 0.6 0.8 クエリ2 0.7 0.9 0.2 クエリ3 0.3 0.4 0.6 クエリ4 0.4 0.3 0.2 クエリ5 0.7 0.9 0.2 … … … … 平均 0.5 0.6 0.7t
検定
t
検定
なぜ単純に比較してはいけないのか?
} 例例えばシステムA-‐‑‒B, B-‐‑‒C間でt検定をしたとき } 誤って帰無仮説を棄却する確率率率: α(有意⽔水準) } 少なくともA-‐‑‒B, B-‐‑‒C間のどちらかで誤って帰無仮説を棄 却する確率率率: 1-‐‑‒(1-‐‑‒α)2 } 1-‐‑‒(1-‐‑‒α)2 > α (0<α<1のため)より 検定を繰り返せば繰り返すほど 誤って帰無仮説を棄却する確率率率が⾼高くなる } 多重性のための調節 } Bonferroni correction } 検定をする回数nで有意⽔水準αをα/nと補正する } Tukey's HSD test } 最も厳しい⽔水準を⽤用いて⼀一律律に検定を⾏行行うPermutation Test
} ⼆二つのシステムの検索索指標の値
x = (x1, x2, x3, …), y = (y1, y2, y3, …)
} 統計量量: T(x, y)
} e.g. T(x, y) = |xavg – yavg|
} 仮説H: 両システムに差はない
} Permutation Test
1. x, yの値をランダムに⼊入れ替えてxʼ’, yʼ’とする
2. 1をB回繰り返しT(xʼ’, yʼ’) ≧ T(x, y)の回数をCとする
イメージ図
14 Session N: XXX 担当:○○(XX大) x y 0.5 0.4 0.3 0.2 0.3 0.4 0.5 0.7 0.2 0.9 x’ y’ 0.5 0.4 0.7 0.2 0.3 0.4 0.5 0.3 0.2 0.9 x’ y’ 0.4 0.4 0.3 0.2 0.9 0.5 0.5 0.7 0.2 0.3 x’ y’ 0.5 0.5 0.3 0.2 0.3 0.4 0.4 0.7 0.2 0.9 T(x, y)=0.4 T(x’, y’)=0.3 T(x’, y’)=0.5 T(x’, y’)=0.2 T(x’, y’)<T(x,y) T(x’, y’)>T(x,y) T(x’, y’)<T(x,y)p = (T’>Tの回数)/(試行回数) = 1/3
MaxT Permutation Test [Westfall and Young]
} あるベースラインと他のシステムの検索索指標の値 x0 = (x01, x02, x03, …), x1 = (x11, x12, x13, …), x2 = (x21, x22, x23, …),… } 統計量量: T(X) (X=(x0, x1, x2, …)) } Ti(X) = T(x0, xi) } 仮説Hi: システムiとベースラインには差がない} MaxT Permutation Test
1. Xの値をランダムに⼊入れ替えてXʼ’とする
2. MaxTi(X) = maxi≦j≦m|Tj(X)|
3. B回ランダムに1,2を⾏行行い,MaxTi(Xʼ’)>MaxTi(X)の回数
をCiとする
Preference Based Evaluation Measures for Novelty and Diversity Praveen Chandar, Ben Carterette
} 背景
} 評価指標の⼀一般形
= gain*discount
} e.g. DCG
} Novelty-‐‑‒awareの評価指標
} ERR (Expected Reciprocal Rank)
16 Session N: XXX 担当:○○(XX大) Metric = g(i)d(i) i=1 n
∑
DCG = (2r(i) −1) 1 log(i +1) i=1 n∑
ERR = Ri i=1 n∑
(1− Rj ) j=1 i−1∏
1i diminishing return Ri: i位の文書の適合度 [0, 1]背景の続き
} Novelty&Diversity-‐‑‒awareの評価指標 } α-‐‑‒DCG } これまでのNovely&Diversity-‐‑‒aware評価指標 } Subtopicベース or ナゲットベース… めんどくさい } e.g. ハリーポッター: 本,映画,登場⼈人物 } e.g. SIGIR: 歴史,2014, ベストペーパー } ⽂文書に対する⽐比較評価でできないか?g(i) =
R(i, j)(1−
α
)
c(i, j )j=1 m
∑
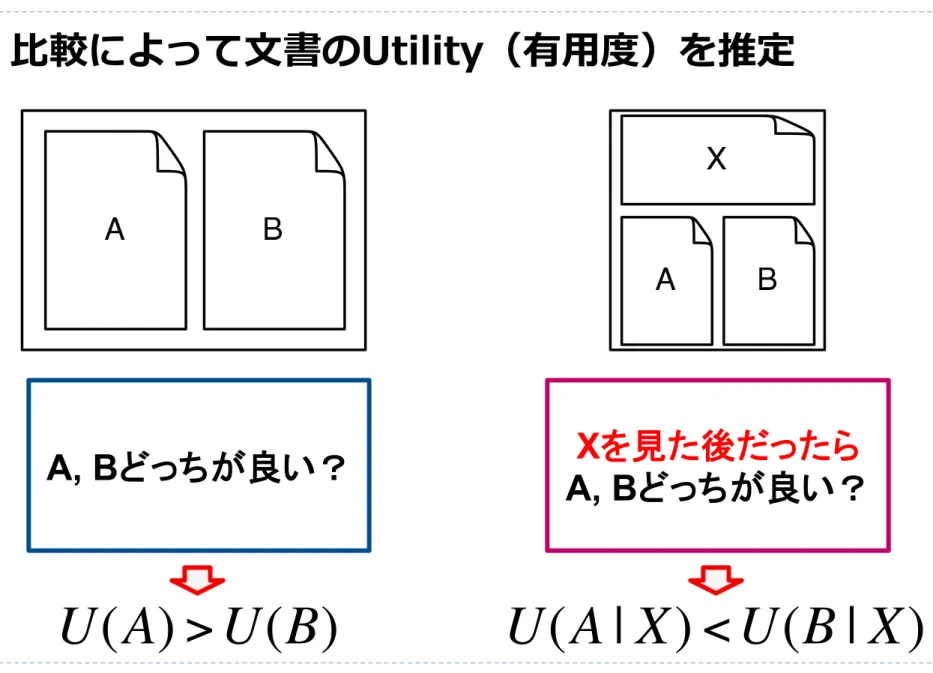
R(i, j): i位の文書のトピックjへの適合度 c(i, j): i位までのトピックjに適合する文書数 m: トピック数 diminishing return比較評価ベースの適合性判定
} ⽐比較によって⽂文書のUtility(有⽤用度度)を推定
18 Session N: XXX 担当:○○(XX大)
A, Bどっちが良い? A, Bどっちが良い? Xを見た後だったら
subtopic user A user B user C
a. What restrictions are there for checked baggage during air travel? ✓
b. What are the rules for liquids in carry-on luggage? ✓
c. Find sites that collect statistics and reports about airports ✓
d. Find the AAA’s website with air travel tips. ✓
e. Find the website at the Transportation Security Administration (TSA) that offers air travel tips.
✓
Table 1: An example topic (air travel information ) along with its subtopics from the TREC Diversity dataset and three possible user profiles indicating the interests of different users.
Chandar and Carterette [8] introduced a preference-based framework similar to ours, but there exists no evaluation measure that incorporates preference judgments directly for novelty and diversity. Moreover, that work focused only on ranking novel documents, without considering the more general question of diversity—that different users will have different preferences depending on their profile.
3.1 Test Collection
Chandar and Carterette’s preference-based framework is based on so-called levels of preference judgments. We use a similar idea; in this work, a test collection of preferences for novelty and diversity consists of two different types of preference judgments:
1. simple pairwise preference judgments, in which a user is shown two documents and asked which they prefer. 2. conditional preference judgments, in which a user is shown three or more documents and asked to express a preference between two of them, supposing they had read the others.
Simple pairwise preferences produce a relevance ranking: given a pair of documents, assessors select the preferred doc-ument based on some criteria. We expect topical relevance to be the primary criteria, although many criteria (such as ease of reading, completeness of information, salience of arti-cle, etc.) could factor into an assessor’s choice. Since differ-ent users may have differdiffer-ent needs and differdiffer-ent preferences for the same query, pairs can be shown to multiple assessors to get multiple preferences. Over a large space of assessors, we would expect that documents are preferred proportion-ally according to the relative importance of the subtopics they are relevant to, with various other factors influencing finer-grained orderings.
Simple pairwise preferences cannot capture novelty; in fact, two identical documents should be equally preferred in all pairs in which they appear and therefore end up tied in the final ordering. Conditional preference judgments at-tempt to resolve this by asking for a preference for a given pair of document conditional on the information in other documents shown to the assessor at the same time. The as-sessor is asked to read those documents, then select which of the remaining two they would like to see next.
Figure 1 illustrates conditional preferences with a triplet of documents: the assessor would read document X, then select which of A or B they would like to see next2 We
2Note that any document may be placed at the top of a
triplet; it need not be the most preferred document among the simple pairwise preferences.
Figure 1: Left: a simple pairwise preference for which an assessor chooses A or B. Right: a triplet of documents for conditional preference judgments. An assessor would be asked to choose A or B condi-tional on having read X.
expect the assessor’s choice to be based not only on topical relevance, but also on the amount of new information given what is provided in the top document. Again, they can use other factors in their preferences, but novelty should be a primary consideration: if X is identical to A, we expect them to choose B, and then a system that ranks X and A adjacent would be penalized for failing to rank B after X.
Similarly, we could obtain preferences with quadruplets of documents, quintuplets of documents, and so on. In practice it becomes increasingly difficult for assessors to make such fine distinctions, so we limit to only obtaining judgments on triplets. A triplet in our framework corresponds to Chandar and Carterette’s “level 2” judgments; as they showed, these judgments capture most of the necessary information about novelty. Preferences conditional on greater numbers of other documents contribute less and less [8].
3.2 Preference-Based Evaluation Measure
We propose a model-based measure using preferences to assess the effectiveness of systems for the novelty and di-versity task. Model based measures can be composed from three underlying models: browsing model, document utility, and utility accumulation [6]. The way users interact with the ranked list is defined by the browsing model; we rely on the most accepted model in which the user scans docu-ments down a ranked list one-by-one and stops at some rank k. The document utility model defines the amount of util-ity provided by a single document, and utilutil-ity accumulation models the total utility derived during browsing.
We define our utility based model for novel and diversity ranking task as follows: a user scanning documents down a ranked list derives some utility U (d) from each document and stops at some rank k. We hypothesize that the utility of a document at rank i is dependent on previously ranked document (i.e. d1 to di−1). Given a probability distribution
for a user stoping at rank k, the utility accumulation model