Spatiotemporal Difference in the Mode of Interkinetic Nuclear
Migration in the Mouse Embryonic Intestinal Epithelium
Tetsuya NITTA1), Noriko OGAWA1), Dereje GETACHEW1), Akihiro MATSUMOTO1), Jun UDAGAWA2), Hiroki OTANI1)
1)Department of Developmental Biology, Shimane University Faculty of Medicine, Izumo, 693-8501, Japan 2)Division of Anatomy and Cell Biology, Department of Anatomy, Shiga University of Medical Science, Otsu, 520-2192, Japan
(Received December 19, 2016; Accepted December 20, 2016)
Interkinetic nuclear migration (INM) is a phe-nomenon in which stem cell nuclei move along the apical-basal axis of the pseudostratified epithelium in synchrony with the cell cycle. INM has been extensively analyzed in the neural epithelia and sug-gested to play important roles in the regulation of stem/progenitor cell proliferation/differentiation. In the present study, we examined the entire length of mouse intestinal epithelium on the existence and mode of INM at embryonic day (E) 11.5 and 13.5. In addition to the histological and scanning elec-tron microscopic observation of the epithelium, the chronological change in the distribution of the epi-thelial cell nuclei that are marked with 5-ethynyl-2'-deoxyuridine (EdU) was statistically analyzed with multidimensional scaling method. The results show the existence of INM through the entire intestine, and that there are spatiotemporal differences in the mode of INM between the proximal and distal parts of the intestine as well as between E11.5 and E13.5.
Key words: interkinetic nuclear migration, mouse embryo, intestine, multidimensional scaling
INTRODUCTION
Interkinetic nuclear migration (INM) is a phe-nomenon first described in the neuroepithelium [1]
that nuclei of the epithelial cells move between the apical and basal sides along the apicobasal (AB) axis in synchrony with the cell cycle resulting in the pseudostratified appearance of the epithelium. INM has been reported in the developmental process of the various neuroepithelia of ectoderm origin [2-4]. INM-like nuclear movement has also been docu-mented in the epithelia of endoderm origin such as the liver bud [5] and intestine [6]. We previously reported the existence of INM in the mouse embry-onic midgut epithelium of endoderm origin [7], and further in the mouse embryonic ureteric epithelium of mesoderm origin [7, 8] by using immunohisto-logical observation of distribution change of nuclei marked with 5-bromo-2’-deoxyuridine (BrdU) along the AB axis and the statistical analysis of the distri-bution patterns by multidimensional scaling (MDS). While the panel of INM distribution in the differ-ent tissues and organs in the mammals are extend-ing, variation in the detailed modes of INM has been noticed among the different organs and tissues as well as between the different dates of gestation in the same epithelium [7-10]. Since INM has been implicated in the regulation of proliferation and dif-ferentiation of stem cells in the epithelium [11, 12], it is naturally speculated that the INM mode is differentially regulated corresponding to the differ-ent needs of increase in the cell number, differdiffer-ential distribution of the cells, and/or generation of differ-ent cell types in the tissues and organs. In fact, we previously reported the difference in the INM mode in the mouse embryonic midgut between embryonic day (E) 11.5 and E12.5 when the midgut elongates characteristically [7]. However, it remains unknown whether INM exists in the epithelium through the entire length of the intestine including the hindgut,
Corresponding author: Hiroki Otani, M.D., Ph.D.
Department of Developmental Biology, Shimane University Faculty of Medicine, 89-1 Enya-cho, Izumo,
Shimane 693-8501, Japan Tel: +81-853-20-2101 Fax: +81-853-20-2100
E-mail: [email protected]
and whether there are spatiotemporal differences in the INM modes in the developing intestinal epithe-lia.
In the present study, therefore, we first proved the existence of INM using 5-ethynyl-2'-deoxyuridine (EdU) for marking the nuclei and MDS analysis of the EdU (+) nuclei distribution pattern in the entire length of the intestinal epithelium, and further ex-amined spatiotemporal differences in the INM mode.
MATERIALS AND METHODS
Animals
C57BL/6J mice (CLEA Japan, Tokyo, Japan) be-tween 8 and 20 weeks of age were used.
The mice were housed in the Department of Ex-perimental Animals, Center for Integrated Research in Science at Shimane University. They were kept under conditions of constant temperature and humid-ity, and a controlled 12/12-h light/dark cycle, and were given a standard laboratory diet and water both ad libitum. Single potent male and single es-trous female mice were mated overnight in the same cage. Noon of the day when a vaginal plug was ob-served was defined as embryonic day (E) 0.5. We measured the weight of the female mouse at E10.5, and we confirmed weight gain more than 10.0 g as the standard of a successful pregnancy. Dams were sacrificed under deep anesthesia at E11.5, E13.5 and at the designated time points in the experiments on INM to obtain embryos for the analysis of the chronological difference. The entire digestive tube of the embryo was dissected out and the following analyses were performed on the intestine parts, 1) proximal: from the end of stomach to the cecum, and 2) distal: from the cecum to the anus, separate-ly (Fig. 1a,b), to anaseparate-lyze the regional difference.
This study was approved by the Ethics Committee for Animal Experimentation of Shimane University, and the animals were handled in accordance with institutional guidelines.
Scanning electron microscopy
Embryos were fixed in 4% paraformaldehyde (PFA) in phosphate-buffered saline overnight at 4℃ and post-fixed with 1% osmium tetroxide for 1 h followed by 1% tannic acid immersion for 2 h.
After being washed, they were again treated in 1% osmium tetroxide for 1 h. After the washing and dehydration, the specimens were put into t-butyl al-cohol and dried with a freeze-drying device (JEOL, JFD-300, Tokyo, Japan). They were then coated with gold by an ion sputter coater (Eiko, VX-10, Tokyo, Japan) and observed under a scanning
elec-Fig. 1
a
b
c
d
e
f
g
Fig. 1. Mouse embryonic gastrointestinal tract at E11.5 (a), at E13.5 (b), light microscopy HE staining (c, d), γ-tubulin immunostaining (f, green), EdU staining (g, light blue), and SEM (e) images of the epithelia in the proximal part of the developing intestine. The intestine parts 1) proximal: from the end of the stomach (white arrowheads) to the cecum (black arrowheads), and 2) distal part: from the cecum to the anus, were separately examined (a, b), to analyze the regional dif-ference. Cross-sectioned views of the intestinal epithelium at E13.5 show an apical mitotic figure (c, arrow, the division axis is vertical to the AB axis), and a rare intermediately lo-cated mitotic figure (d, arrow, note that the division axis is in parallel to the AB axis). SEM view shows that epithelial cells spanned from the basement membrane to the apical (luminal) surface of the tube (e). Gamma-tubulin immunostaining is lo-cated at the apical surface suggesting the existence of the api-cal primary cilia of the single-layered epithelium (f). EdU(+) nuclei are in light blue, while the nuclei were counter-stained in dark blue by DAPI (g). Bars in b: 500 μm (a and b are at the same magnification); c, d, e, f, g: 20 μm.
tron microscope (SEM) at 15 kV (JEOL, JSM-6510, Tokyo, Japan).
EdU-labeling and histological analyses
Pregnant dams at E11.5 and E13.5(n = 7 for each day and one for each time point) were inject-ed with EdU (Invitrogen, Yokohama, Japan, 30 mg/ kg [13]) and sacrificed 1, 2, 4, 6, 8, 10 and 12 h later to collect embryos (one embryo which was the nearest to the vagina from each dam, 7 for each of the E11.5 and E13.5 series, in total 14 dams). The embryos were fixed with 10% formaldehyde/70% methanol overnight at 4ºC and were dehydrated in a graded series of alcohol. The intestines were processed into paraffin blocks, and serially cross-sectioned at 5 μm. The sections were used for both EdU assay using a Click-iT® Plus EdU Alexa Fluor® 488 Imaging Kit (Invitrogen) with nuclear staining by 4’6-diamidino-2-phenylindole (DAPI, Dojindo, Kumamoto, Japan), and histological analyses by hematoxylin and eosin (HE) staining as well as by γ-tubulin immunostaining. Immunofluorostaining for γ-tubulin (Anti-gamma Tubulin antibody, abcam Plc, Cambridge, UK) was performed to visualize primary cilia, and nuclei were stained with DAPI. Sections incubated without the primary antibody served as negative controls. Blocking was performed using of M.O.M. Immunodetection Kit blocking solution (Vector Laboratories Inc., Burlingame, CA). We measured the position of EdU (+) cell nuclei along the AB axis of the intestinal epithelia under a con-focal laser microscope (LSM5 PASCAL, Carl Zeiss, Tokyo, Japan) and a fluorescence microscope (BZ-X710, Keyence, Osaka, Japan)(Fig. 1g).
Measurement of nuclear distribution along the AB axis
The number and position of EdU (+) nuclei be-tween the apical and basal surfaces along the AB axis in the epithelium were measured in 5 µm-thick serial sections at 30 µm intervals using an origi-nal image aorigi-nalysis program as previously reported [8]. Briefly, between the innermost and outermost loops at the apical and basal surfaces, respectively, lines were drawn to divide the epithelium every 15 degrees, and to divide the epithelium into 6 con-centric layers with an equal width (from the basal
side layer 1 to the apical side layer 6). The num-bers of EdU (+) nuclei were counted using ImageJ (National Institutes of Health, Bethesda, Maryland, USA). We defined the nucleus position as the point of intersection of the maximum and minimum diam-eters. The numbers of EdU (+) nuclei counted were 98 – 336 for the E11.5 series, and 80 – 1276 for the E13.5 series per each time point. The distribu-tion patterns of EdU (+) nuclei along the AB axis were represented using a nuclear population histo-gram (%) in the layers 1 to 6. Mitotic figures were also observed on the HE-stained sections to deter-mine their location in the epithelium along the AB axis.
Multidimensional scaling (MDS)
The patterns of histograms at each time point were analyzed by MDS, a method for the statistical analysis of multi-dimensional information, as in the previous reports [7, 8]. MDS mathematically ex-plores similarities or dissimilarities among data sets in a large matrix and represents them on a 2-dimen-sional graph [14]. Briefly, a set of data from each item is first computed as a distance matrix and then assigned to a location in 2-dimensional space, in which the first dimension is the most important for representing the differences. MDS can thus visualize more easily similarities or dissimilarities among any phenomena. As in the previous reports, we interpret-ed that changes in the distribution of EdU (+) nu-clei during the time course reflect the nuclear move-ment [7, 8]. To evaluate the success of the MDS analyses, the stress values were found to be low enough for goodness criteria [15]. The IBM SPSS Statistics 22 package was used for MDS analysis.
RESULTS
The epithelium appeared multiple-layered of nu-clei by light microscopic observation (Fig. 1c, d), however, we confirmed by SEM that it is actually single-layered (Fig. 1e), thus pseudostratified. Mi-totic figures were mostly observed at the apical sur-face with the division axis vertical to the AB axis (Fig.1c), but some, albeit much fewer, were located at the intermediate position in the epithelium at E13.5 with the division axis not vertical to the AB
axis (Fig. 1d). Gamma-tubulin immunostaining was observed only at the apical surface of the epithelium indicating the existence of the primary cilia, which further supports the single-layered epithelial structure (Fig.1f).
The position of EdU (+) cell nuclei (Fig. 1g) were measured along the AB axis of the intestinal epithelium, and the distribution patterns of each time point are represented as nuclear population histo-grams (%) (Fig. 2). The results show a tendency that EdU (+) nuclei are relatively more basally distributed at first and last of the observed period, whereas they are distributed more apically at 4, 6, and 8 h points in the E11.5 series, and 4 and 6 h points in the E13.5 series (Fig. 2). However, the detailed mode of the change in the distribution is not clear from these histogram patterns.
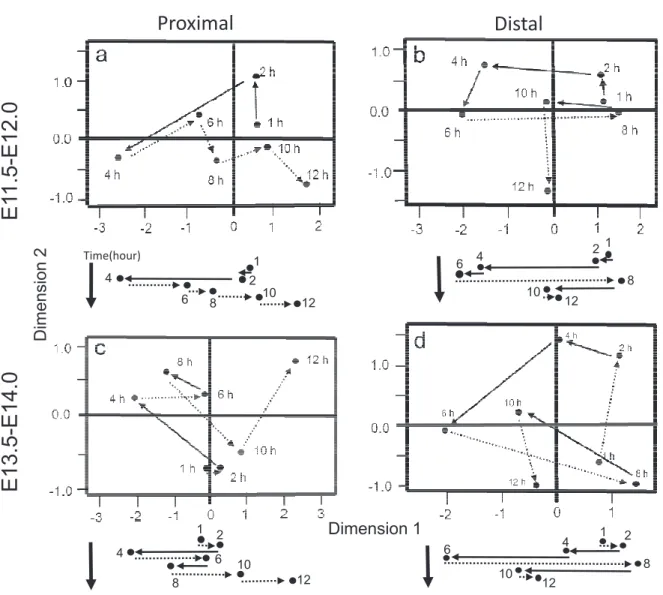
By MDS, EdU (+) nuclei distribution data at seven time points were visualized by plotting them in two dimensions based on the similarities between the histogram patterns (Fig. 3). The more similar are the distribution patterns between the two time points, the closer are the two points on the
2-di-mensional graph. Therefore, by connecting points on the graph chronologically, the chronological change can be followed in the nuclear distribution pattern. Based on the microscopic observation as shown in the histograms that initially basal, then apical, fi-nally basal again nuclear distribution, we interpreted that dimension 1 corresponds the nuclear movement along the AB axis. The present MDS analysis of the histograms showed the general finding that both in the E11.5 (Fig. 3a, b) and E13. 5(Fig. 3c, d) series, as well as the intestine parts both proximal (Fig. 3a, c) and distal to the cecum (Fig. 3b, d) showed a cyclic change in the EdU (+) nuclei dis-tribution pattern, indicating the existence of INM. This finding can be more clearly noted when we abstract only the values of first dimension and ob-serve the chronological changes as shown below the original 2-D MDS panels (Fig. 3).
On the other hand, there appeared regional and chronological differences in the INM modes of the intestinal epithelium. In the proximal part of the intestine (Fig. 3a, c), EdU (+) nuclei are distrib-uted the most apically at 4 h both in the E11.5 and
Fig. 2
Nuclei distribution (%)
(1: basal side - 6: apical side )
1 2 3 4 5 6 1 2 3 4 5 6 1 2 3 4 5 6 1 2 3 4 5 6 1 2 3 4 5 6 1 2 3 4 5 6 1 2 3 4 5 6 1 2 3 4 5 6 1 2 3 4 5 6 1 2 3 4 5 6 1 2 3 4 5 6 1 2 3 4 5 6 1 2 3 4 5 6 1 2 3 4 5 6 E13.5 40 20 0 E13.5 0 20 40
d
c
1 2 3 4 5 6 1 2 3 4 5 6 1 2 3 4 5 6 1 2 3 4 5 6 1 2 3 4 5 6 1 2 3 4 5 6 1 2 3 4 5 6 1 2 3 4 5 6 E11.5 E11.5 40 20 0 40 20 01 h
2 h
4 h
6 h
8 h
10 h
12 h
1 2 3 4 5 6 1 2 3 4 5 6 1 2 3 4 5 6 1 2 3 4 5 6 1 2 3 4 5 6 1 2 3 4 5 6b
a
Fig. 2. Histograms of the labeled-nuclei distribution (%) at each time point (1 h to 12 h after EdU-labeling) of the E11.5 (from E11.5 to E12.0) (a, b), and E13.5 (from E13.5 to E14.0) (c, d) series, and the proximal (a, c) and distal (b, d) parts of the intestine. To make changes in the nuclear distribution pattern more clearly discernible, histograms of the apical layers, i.e. layers 4, 5, and 6, are shown in black.
E13.5 series, while in the distal part (Fig. 3b, d) they are distributed the most apically at 6 h in the both date series. Thus, the basal-to-apical nuclear movement that corresponds to the G2 phase of the cell cycle is for 4 h and 6 h in the proximal and distal parts, respectively. In the proximal part in the both date series (Fig. 3a, c), EdU (+) nuclei are distributed the most basally at 12 h, whereas, in the distal part (Fig. 3b, d), this occurs at 8 h, and at 10 h the distribution moves apically. This suggests that the apical–to-basal shift that corresponds to the M/G1 phase occurs for 8 h and 2 h in the proximal
and distal parts, respectively. Between the E11.5 and E13.5 series, the basic cyclic change in the EdU (+) nuclei distribution patterns appeared similar along the dimension 1. However, there is some chrono-logical difference. In the proximal part of the E13.5 series (Fig. 3c), there is a basal-to-apical shift in the nuclear distribution from 6 h to 8 h, whereas there is no such ‘lag’ in the E11.5 series. There is also a slight apical-to-basal change in the nuclear distribution from 1 h to 2 h in the proximal part of the E13.5 series (Fig. 3c), but not in the E11.5 se-ries.
Fig. 3
Proximal
Distal
E1
1.5-E12.0
E13.5-E14.0
2 1 4 6 8 10 12 1 2 4 6 8 10 12 12 10 6 8 2 1 4 Time(hour) 1 2 4 6 8 10 12 Dimension 1 Dimension 2Fig. 3. Two-dimensional representation of the nuclear distribution pattern in the intestinal epithelium at seven time points in the proximal (a), distal (b) parts of the E11.5 series, in the proximal (c) and distal (d) parts of the E13.5 series as analyzed by multidimensional scaling (MDS). The chronological changes in the values of first dimension are shown below each of the original 2-D MDS panels. The basal side-to-apical side movements are represented by arrows, and the apical side-to-basal side movements are represented by dotted arrows.
DISCUSSION
INM has been extensively analyzed in the neural epithelia and is suggested as an important regulatory mechanism of not only stem cell proliferation and differentiation but also morphogenesis of the tissue and organ [2, 12, 16, 17]. In the previous study, we showed the existence and detailed mode of INM in the mouse embryonic midgut [7] using basi-cally the same method with the present study. In the present study, in addition to the single-layered structure of the epithelium with apical mitotic fig-ures, a general cyclic change in the EdU (+) nuclei distribution pattern was observed through the entire length of the mouse embryonic intestinal epithelium in both the 11.5 and E13.5 series by MDS analysis. The present data of each time point are based on in vivo localization of a large number of EdU (+) nuclei from each separate single embryo and are statistically analyzed by MDS. Thus the observed cyclic change in the nuclear localization in synchro-ny with the cell cycle strongly suggests the exis-tence of INM in the entire length of the developing mouse intestinal epithelium. Although we have not yet examined the stomach, we have examined the esophagus and obtained data that suggest the exis-tence of INM (Kaneda et al. unpublished data). It is, therefore, probable that INM occurs through the entire length of the gastrointestinal tract, suggesting its role in the development of the gastrointestinal tract.
On the other hand, the present study suggests regional and chronological differences in the mode of INM. The basal-to-apical nuclei movement that corresponds to G2 phase of the cell cycle is for 4 h and 6 h in the E11.5 and E13.5 series, respectively, and the apical-to-basal shift that corresponds to M/ G1 phase is 8 h and 2 h, respectively. Whereas the G2 phase nuclear shifts are almost constant among the present and previously reported organs, M/G1 phase shift significantly varies among the organs [7-10]. The present study revealed that nuclear distri-bution shift during G2 phase occurs again within the reported time course both in the proximal and distal parts of the intestine. However, the M/G1 phase shift apparently differs between the two parts, and it is much shorter in the distal part than in the
proxi-mal part in both the E11.5 and 13.5 series. These previous and present findings strongly suggest that the molecular mechanism [12] differs between the basal-to-apical and apical-to-basal movement of the nuclei in INM, and that the latter may work more actively in the differential manner correspondingly to the developmental needs specific to the organ, re-gion, and developmental phase. We are now further analyzing INM modes in the different regions in the proximal part of the intestine. This is because the proximal part of the intestine in the present study is long and includes morphologically and functionally different regions in the mature intestine and also because these regions go through a complex pattern of morphogenesis during the development such as convolution and rotation in which INM may play a role [16, 17]. We are also histo-morphometrically examining increase in the total cell number along the longitudinal axis of the intestine and the devel-opment of villi covered by the single-layered epithe-lium in the developing mouse intestine (Kuramoto, Moriyama et al. unpublished data), and further detailed correlative studies on INM and morphom-etry are deserved to elucidate a relation between the regulation of the INM mode and these events in the intestinal organogenesis and histogenesis.
The present MDS analysis revealed a small basal-to-apical-oriented shift in the nuclear distribution from 6 h to 8 h in the E13.5 series. There is also a slight apical-to-basal change from 1 h to 2 h in the E13.5 series. These appear to be as ‘lags’ from the view of the cyclic change in the nuclear distribution characteristic to INM from basal to apical during the S/G2 phase and from apical to basal during the M/G1 phase. We previously observed a similar ‘lag’ in the INM of the ureter in the E13.5 to E14.0 series [8]. These ‘lags’ were observed only in the E13.5 series but not in the earlier series both in the ureter [8] and in the intestine in the present study. We observed mitotic figures mostly at the apical position, however, some were also observed at the intermediate position with the division axis not ver-tical to the AB axis, which does not match with the nuclear kinetics in INM. Therefore, in addition to INM, the other type(s) of cell division may be mixed during the course of histogenesis at the later stage of development.
ACKNOWLEDGMENTS
We thank Ms. Y. Takeda and Mr. T. Yoneyama for their technical help. This work was supported by MEXT KAKENHI Grant Number 23112006.
DISCLOSURE
None.REFERENCES
1) Sauer FC. The interkinetic migration of embry-onic epithelial nuclei. J Morphol 1936;60:1-11. 2) Taverna E, Huttner WB. Neural progenitor
nu-clei in motion. Neuron 2010;7:906-14.
3) Hatta T, Moriyama K, Nakashima K, Taga T, Otani H. The role of gp130 in cerebral cortical development: in vivo functional analy-sis in a mouse exo utero system. J Neurosci 2002;22:5516-24.
4) Sidman RL, Miale IL, Feder N. Cell prolifera-tion and migraprolifera-tion in the primitive ependymal zone: an autoradiographic study of histogenesis in the nervous system. Exp Neurol 1959;1:322-33. 5) Bort R, Signore M, Tremblay K, Martinez
Bar-bera JP, Zaret KS. Hex homeobox gene controls the transition of the endoderm to a pseudostrati-fied, cell emergent epithelium for liver bud devel-opment. Dev Biol 2006;290:44-56.
6) Grosse AS, Pressprich MF, Curley LB, et al. Cell dynamics in fetal intestinal epithelium: impli-cations for intestinal growth and morphogenesis. Development 2011;138:4423-32.
7) Yamada M, Udagawa J, Hashimoto R, Matsu-moto A, Hatta T, Otani H. Interkinetic nuclear migration during early development of midgut and ureteric epithelia. Anat Sci Int 2013;88:31-7. 8) Motoya T, Ogawa N, Nitta T, et al. Interkinetic
nuclear migration in the mouse embryonic ureteric
epithelium: Possible implication for congenital anomalies of the kidney and urinary tract. Conge-nit Anom 2016;3:127-34.
9) Takahashi T, Nowakowski RS, Caviness VS. The cell cycle of the pseudostratified ventricular epithelium of the embryonic murine cerebral wall. J Neurosci 1995;15:6046-57.
10) Otani H, Udagawa J, Naito K. Statistical analy-ses in trials for the comprehensive understanding of organogenesis and histogenesis in humans and mice. J Biochem 159;6:553-61.
11) Mitsuhashi T, Takahashi T. Genetic regulation of proliferation/differentiation characteristics of neural progenitor cells in the developing neocor-tex. Brain & Dev 2009;31:553-7.
12) Kosodo Y. Interkinetic nuclear migration: be-yond a hallmark of neurogenesis. Cell Mol Life Sci 2012;69:2727-38.
13) Zeng C, Pan F, Jones LA, et al. Evaluation of 5-ethynyl-2′-deoxyuridine staining as a sensi-tive and reliable method for studying cell prolif-eration in the adult nervous system. Brain Res 2010;1319:21-32.
14) Johnson RA, Wichern DW. Applied Multivari-ate Statistical Analysis. 6th ed. Upper Saddle River; 2007.
15) Merchant H, Zarco W, Bartolo R, Prado L. The context of temporal processing is represented in the multidimensional relationships between tim-ing tasks. PloS One 2008;3:e3169.doi:10.1371/ journal.pone.0003169.
16) Miyata T. Development of three-dimensional architecture of the neuroepithelium: role of pseu-dostratification and cellular ‘community’. Develop Growth Differ 2008;50:S105-S12.
17) Strzyz PJ Matejcic M, Norden C. Chapter three-Heterogeneity, cell biology and tissue mechanics of pseudostratified epithelia: coordination of cell divisions and growth in tightly packed tissues. In-ternational Rev Cell Mol Biol 2016;325:89-118.