Birefringent Optical Properties in Cadmium Halide Single Crystals
journal or
publication title
福井大学工学部研究報告
volume 27
number 2
page range 205‑216
year 1979‑09
URL http://hdl.handle.net/10098/4420
FUKUI UNIVERSITY
VOL.27 No. 2 1979
Birefringent Optical Properties in Cadmium Halide Single Crystals
* * *
Shin-ichi KONro, Tsuguhiro lVITTSUNARI and Hiroald MATSUMaID
(Received July 31, 1979)
Ordinary and extraordinary refractive indices of CdC12, CdBr2 and CdI2 single crystals were measured at room and liquid nitrogen temperatures in the region from 7000 A to the shorter wavelength up to the absorption edge. The measurement was carried out by a "two-angle" interference method in which both indices could be determined together with the thickness of the sample crystal. The results were related to optical absorption. Dispersion behaviors of the indices in the energy region well below the optical gap could be analyzed using a single-effective-oscillator model.
1. Introduction
Cadmium halides other than fluoride crystallize in a typical lay- er structure with highly ionic property. An increasing amount of optical studied has been carried out on these materials in the last decade, 1-12) because of tre interest in the characteristics due to the layer structure. The measurement of the refractive index has been carried out by Tubbs on CdI2.13-14) His data however lack the values of the extraordinary-ray refractive index near the absorption edge.
As for CdC1 2 and CdBr2' any reliable data has not been reported on the refractive indices.
In the present work, the ordinary and extraordinary refractive indices of CdC1 2 , CdBr2 and CdI 2 single crystals are measured at room temperature (RT) and liquid nitrogen temperature (LNT) in the region from 7000 A to the shorter wavelength up to the absorption edge. The measurements were carried out by a "two-angle" interference method described in sections 2 and 3. This method allows one to determine
*
Dept. of Electronicsthe refractive index without any direct measurement of the sample thickness, and therefore is effective to determine the thickness of thin crystals whose refractive index is unknown. the refractive in- dices obtained are directly related to the intensity and position of electronic absorption bands. The dispersion behaviors in the energy region well below the optical gap are analyzed using the single- effective-oscillator model of Wemple and Didomenico. 15 )
2. "Two-Angle" Interference Analysis for Determining the birefrin- gent Refractive Index
The ordinary and extraordinary refractive indices of the cadmium halides were determined from interference data through a "two-angle"
interference analysis described in the following.
When a monochromatic light wave of wavelenght A and intensity
I{i)is incident at an angle
~on a thin isotropic crystal with two par- allel surfaces, the intensities of the reflected
(r{r))and trans- mitted
(I(t))light are known to be given by
with
F
( 1+ F sin2 ....§...)-1 2
4R/{1+R)2,
(1)
(2 )
( 3)
(4) where
R,nand
dare the surface reflectivity, the refractive index and the thick- ness of the cryffal respectively. The quantity e is the phase difference
concerning to the interference. In the case of the uniaxial crystal with the two surfaces perpendicular to the optical c axis, eq.(4) gives the phase difference for ordinary ray (O-ray)
~if
nis re- placed by the refractive index for O-ray
n~.The phase difference for extraordinary ray (E-ray) eeis shown to be related to the E-ray refractive index nuby
(5)
The condition of maximum transmission (or minimum reflection) is
therefore given by the formulae
m2
0;
=Vnl-
sin2<fJ for a-ray,(6)
and
~e; =
(n.LIn
/I )Y n ~ -
sin 2 <fJ for E-ray,where mo arc the orders of interference for O-ray and E-ray respectively, me being equal to mo at ¢ =
o.
Treating mo andme as functions of A and ¢ : mo= moO,¢) etc., and letting moo..~,O)
=
me (A~ , 0)=
m + Pi' fio ( Ai , ¢)=
m + q" and me ( Ai , ¢ J=
m + Ti, (i=
1,2 J, where mis an integral part of mo 01,0 J
=
meO I ,0) and thus PI is a decimal fraction, we obtain1 (F12 - q,2 J A12 -
(pl - ql )
A ~m= - -
2 (11 - ql ) A12 - (P2 - q2 ) A ~
(8)
andA1 ~---
d
=
2 sin <pV
(PI - ql) (2 m + PI + ql) • (9 )Since the shifts of the order of interference PI' ql' P
2 and q2 can be determined by measuring the ¢-dependence of the interference order at two different wavelengths (AI and 1..2 ) and the A-dependence of the interference order at a nonzero incident angle (<p) as will be de- scribed in the next section, the values of d and m can be deter- mined with the use of eqs.(8) and
(9).
Once m and d are deter- mined, the O-ray index nL(A) at an arbitrary wavelength A are com- puted using the formula(10)
where the values of m+q=
moO, <PJ are given by the A-dependence data for O-ray. On the other hand, the E-ray refractive index nu(>") can be determined from the E-ray data on m+r=
me(A, <P) using the values of n.O):(11)
3. Experimental Procedures
Single crystals of CdCI2 , CdBr2 and CdI2 were grown from the melt by the stockbarger technique. Crystal platelets of about 2x5 mm 2 in area and about 5-50~ in thickness were prepared by simply cleaving these crystals, and were mounted on the sample holder of a metal cryostat.
The monochromatic light was incident at an arbitrary angle $ on the sample surface perpendicular to the c axis. The light illuminating the sample was linearly polarized by a Rochon polarizer placed in front of the light source composed of a 500W xenon lamp (in the wavelength region of 7000-2500 A ) and a 200W deuterium lamp (in the shorter wavelength region ), and was chopped at the frequency of about 86 Hz by a cylindrical beam chopper inside the monochro- mator. All the optical measurements were carried out using the double beam detection syst2m reported in ref. 16.
The wavelength Al at which the shifts of the interference order
Pl,ql and ~ of eqs.(8)-(9) are to be determined was fixed at 6000
A. On the other hand the wavelength A2 at which the parameters P2, q2 and r2 are to be determined was fixed near the absorption edge, so as to minimize the experimental error in the measurement of m by introducing a spacing between the A} and A2 in eq.(8) as large as possible
c./..
2 =: 2450 A in CdC12, A2 =2700 A in CdBr2 and A2 = 3700 A in CdI2 ) .At each wavelength of Al and A2, the change in the order of transmission interference of the sample with respect to the change in the incident angle $ was measured for O-ray and E-ray in the range between <I>
=
0 and <I>=
50~ The relative interference-orders corresponding to the successive transmission maxima were plotted against sin 2 $. From an appropriate interpolation of these plots were obtained the quantities q} -11 '
r l -11 '
q2 - P2 and r2 -12
at $=45°together with the decimal part Pl' In the next place the A-depen- dence of the interference order for O-ray and E-ray was measured at
$=45°in the region from 7000 A to the shorter wavelength up to the absorption edge. This measurement was carried out by recording the
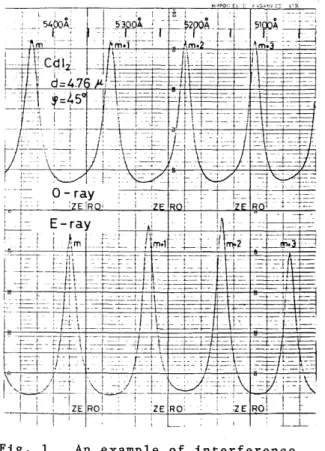
periodi~ change (with respect to A) in the intensity ratio of the transmitted light to the reflected light. An example of the trace of the periodic change is shown in Fig.l. Then the quantitieB q-q}
and r - r l were easily obtained as a function of A by interpolating the plots of the change in the interference order against the in- vers of the photon energy. (The nonlinearity of these plots was an
appropriate measure of the dispersion.) The decimal part s 0 f q i an d r~
Cl
= I , 2 ) determined from the A- dependence data agree well with those determined from the ~-dependence data.From these data the values of q and r were obtained as a function of
A,
and therefore the values of P2' q2 and r 2 could be deter- mined together with the values of ql and r1•4. Experimental Results
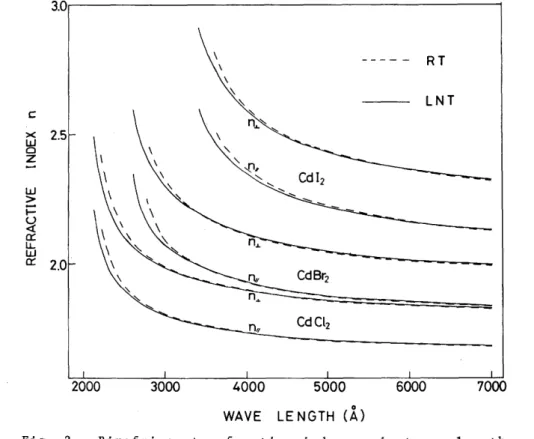
The variations of the O-ray and E-ray refractive indices (n~ and nurespectively ) with wave- length for the single crystals of CdCI2, CdBr2 and CdI2 are illustrated by Fig.2. The values of the indices should be ac- curate within the experi- mental errors of I
%.
It is noteworthy that the close agreement isL :
_~
54,ooA,
Fig. 1 An example of interference spectra for O-ray (upper part) and E-ray (lower part) obtained by
measuring the periodic change in the intensity ratio of the transmitted light to the reflected light with respect to wavelength. The maximum- to-minimum ratio is about 6 for O-ray and about 9 for E-ray.
achieved between the refractive indices of CdI2 (at RT) shown inFig.2 and those reported in ref.14 which were based on photographic measure- ments of interference frings for crystals whose thickness were de- termined by using a polarizing microscope.
As is evident from Fig.2, the cadmium halide crystals other than fluoride show a high birefringence due to their layer structure, and the optical characteristics of the negative uniaxial crystal. The indices n.L and nil increase with increasing halogen atomic number of compounds as in the case of most ionic halides such as alkalj halides.
When the crystals are Gooled from RT to LNT these indices increase by
less than I % at the long wavelengths. The most prominent change is the blue shifts of the absorption edges resulting in the
largerind~sat RT than the :ind:ices at LNT
inthe short wavelengths. In fact the blue shift s were observed for all the materials in the transmission measurements. The refractive indices of CdCl2 and CdBr2 near the absorption edges show
3 . 0 . - - - 1
c r;j 2.5 o
z
w >
~
~
0:: LL W 0:: 2.0
2000 3000
RT
CdCl2
4000 5000 6000 7000
WAVE LE NGTH
cid
Fig. 2 Birefringent refractive index against wavelength for CdC12 , CdBr2 and CdI2 measured at RT and LNT in the region from 7000 A to the shorter wavelength up to the absorption edge.
a large dispersion for E-ray compared with the dispersion for O-ray.
This means that the mechanism of the optical absorption occurring just above the threshold is highly dichroic with a large E-ray absorption coefficient compared with the O-ray one. As for the CdI2 crystal, however, no clear difference between the dispersion for O-ray and that for E-ray is observed near the absorption edge.
It is useful to compare the values of
n~shown in Fig.2 with those obtained from the reflectivity for normal incident light,
R
=
(n,£.- lP/ (n.£.+ 1)2, in a non-absorbing region. The reflectivity
measurements of freshly cleaved surfaces of CdI2 and CdBr2 crystals
(at wavelengths near the absorption edges) give values of
n~that agree with those of Fig.2 within the experimental errors of 2 %.
The values of
n.Lof CdC1
2obtained from the reflecti vi ty measure- ments were smaller than those shown in Fig.2 by about 5 %. This seems to be due to the reduction of the reflectivity during expo- sure of the cleaved faces to air since the CdC1
2samples are highly hygroscopic.
5. Discussion
In materials exhibiting a band gap, the dispersion behavior in the region of photon energy below the gap is related to an absorp- tion process according to the requirement of causality. Using an electronic-dipole oscillator model, the dispersion of the refrac- tive index
nis expressed by
(12) where
mis the electron mass,
Nis the number of molecules per unit volume,
Eis photon energy, and
Eiis the energy of the electronic- dipole oscillator having the strength 4. To discuss the disper- sion of the refractive indices of the cadmium halides shown in Flg.2 in terms of a few oscillators, the first oscillator (of the lowest energy) is isolated and the remaining ones were combined into a sin- gle "'effect i ve" oscillator. Then eq. (12) yields a two-oscillator model of the form
2 47T1i 2 e2 N
n -1
=
--'-'----'-'-=-(13)
m
where the "effective" oscillator energy
Eeff (> E1 )and the "effective"
oscillator strength
Feffare related straightforwardly to all the
f~ ,and
Etof the higher order oscillators
(i > \) •The first term rep- resent the dominant contribution of the optical absorption (above the gap) to the refractive index
nin the energy region well below the gap. The second terTh may contribute to
nmainly in the region near the gap. In the following discussion a convention is used such that, whenever one is concerning with the direction of the polarization of the light in the absorption process, the quantities
n , Eetf, E1,F.ffand
f1in eq. (13) are replaced by
n.L, Eeff.L' E 1.L, Fefhand
f1.Lrespec-
tively for O-ray and by
nil' Eetfll , E111 , Fefflland
fIllrespectively for
E-ray.
It can be shown that the two-oscillator model is effective to ex- plain the dispersion behaviors of the cadmium halide crystals shown in Fig.2. The large dispersion for E-ray compared with that for O-ray, which is observed near the absorption edge in CdC12 and CdBr2, is attributable to the dichroic strength of the first oscil- lator:
f}.L < fIllwith
E1J.- Ell1'This is consistent with the previous prediction: ll ) the E-ray optical transition probability of the first absorption band of CdC12 and CdBr2 exceeds the O-ray one on account of a strong crystal field parallel to the optical c axis. As for the CdI2 crystal the difference in the values between
flitand
fv.seems to be small, since no clear difference in the dispersions be- tween
niland
n~is observed near the edge. On the oter hand, in order to explain the negative birefringent behavior observed in CdC12, CdBr2 and
CdI2 over the long wavelength range, the "effective"
oscillator must be assumed to be more dichroic with a fairly large.
oscillator strength for O-ray compared to that for E-ray. The ori- gin of the negative birefringent property of the layer cadmium hal- ide crystals is therefore different from that of a typical negative birefringent crystal such as calcite; in the calcite the negative birefringence in the transparent region is based on the first strong absorption band observed only for O_ray.17)
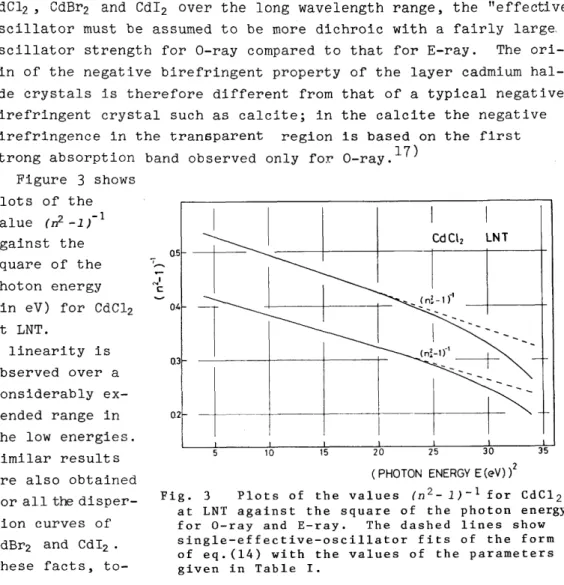
Figure 3 shows plots of the value
(n2 _1)-1against the
square of the - photon energy
(in eV) for CdC12 at LNT.
A linearity is observed over a considerably ex-
CdCl2 LNT
0.5
0.4
0.3
tended range in
~the low energies.
Similar results are also obtained for all the disper- sion curves of CdBr2 and CdI2 . These facts, to-
10 20
(PHOTON ENERGY E (eV) )2 Fig. 3 Plots of the values (n2 - 1)-1 for CdC12
at LNT against the square of the photon energy for O-ray and E-ray. The dashed lines show single-effective-oscillator fits of the form of eq.(14) with the values of the parameters given in Table I.
gether with the dichroic nature of the first oscillator strength, i.
e.) flU ~ fl.L,indicate that the dominant contribution to the re- fractive indices at the low energies of the cadmium halides comes, in fact, from the "effective" oscillator, since otherwise the valu.es of nushould exceed the values of
n.L(see eq.(13)). Deviations from the linearity at the high energies are attributed to the first os- cillator.
In isotropic materials, the dispersion behaviors below the
interband absorption edge have been successfully analyzed in ref.15 using a single-effective-oscillator model of the form
(14) where
Etis the dispersion energy which is a measure of the
strength of interband optical transitions, and
Eois the single os- cillator energy equivalent to the parameter
Eeffin eq. (13). As is sug- gested in the last paragraph, a single-oscillator represehtation appears to be effective for the cadmium halides in the energy re- gion well below the gap. It is tempting, therefore, to analyze the results shown in Fig.2 using eq.(14). Optimum fits in the energy region sufficiently below the threshold are obtained with the val- ues of the parameters
Ed..L ,Ell" , EO.Land
EOI!given in Table I. (The parameters
EtI.and
Eoin eq. (14) are replaced by
E~.t.and
Eo.J.respec- tively for O-ray, and by
Et/.IIand
Bollrespectively for E-ray.) The threshold energy
Et.J.obtained for O-ray from the transmission measurements and the ratio
EO.L/ E~Lare also given in the last two columns of the table.
It has been reported in ref.15 that, in isotropic materials, the
Table I. O-ray and E-ray single-oscillator parametersof CdCI2, CdBr2 and CdI2 at LNT. In the table are also given the O-ray single-oscillator parameters for BiI3 reported in ref.18 and those for PbI2 determined from the refractive index data reported in ref.14.
Ed..L
(eV)
EJII(eV)
Eu(eV)
Eo"(eV)
Et.L(eV)
EO.L / E t.LCdCl2
19.2 15.9 8.5 9.0 5.6 1.53
CdBr2
19.9 16.3 7.1 7.3 4.8 1.48
CdI2
23.1 18.7 5.8 5.8 3.6 1.61
PbI2
19.4 3.8 2.4 1.58
BiI3
17.2 3.1 1.9 1.63
parameters Eo and Et obey two simple empirical rules. The first is that the oscillator energy Eo is related to the threshold energy Et
by Eo/E't-l.5. The second rule is concerned with the dispersion en- ergy and is stated in the form Ed, = f3Nc Z .. Ne, where Ne is the coordi- nation number of the cation nearest neighbor to the anion, za is the formal chemical valency of the ani~r, Ne is the effective number of valence electrons per anion, and
a
is a· essentially two-valued coef- ficient ranging between a lower limit, i.e., an "ionic" limit, and a higher limit, i.e., a"covalent" limit.As is shown in Table I , each of the ratio EO.L/ Eu of the cadmium halides is close to the 1.5. Similar results are also obtained for
*
E-ray using the same values of E'tfl as the values of Et.L. Therefore the empirical rules found in the isotropic materials seem to be ap- plicable to the cace of the cadmium halides. The values of the pa- rameters E~~ of CdClz and CdBrz are close to each other. Compared with these values, the CdI2 crystal shows a relatively large value of Ed.~. Similar arguments hold for E-ray. Therefore the value of the coefficient
a
in CdIz is larger than that in CdC12 and CdBr2 , since each of the values of Nc ,zcl. and Ne for CdI2 are equal to the corresponding value for CdClz and CdBrz. It can thus be stated in terms of the second rule mentioned above that the CdI2 crystal shows a certain covalency.In Table I are also given the single-oscillator parameters for BiI3 reported in ref.18**and those for PbI z determined from the re- fractive index data reported in ref.14. The values of the ratio EoJ../ EtJ. for these compounds are compared favorably with the 1.5 again. The value of the parameter El~ of PbIz together with that of CdClz and CdBr2 suggests the "ionic" limit of the O-ray disper- sion energy for the layer di-halides. The bismus tri-iodide however shows a small value of EtL compared with these compounds. This dif- ference seems to be attributable to the difference in ~ , the coor- dination number of the cation nearest neighbor to the anion. In fact the value EJ..L
=
17.2 in Bi13 , if multiplied by 3/2, exceeds* According to our recent data on the optical reflectance measure- ments, the peak energies of the first absorption bands for E-ray are nearly equal to those for O-ray.
** Single-oscillator parameters are also given in ref. 18 for CdI z and PbI 2. However these values are based on the "apparent"refractlve index data of ref~ 13.
even the value in CdI2 possibly due to the difference in the covalency.
The causality requirement of the radiation process gives a direct relationship of the parameters Eo and Ed to the imaginary electronic dielectric function £,.(E): 15)
where M,. is the rth moment of £z.(E) defined by
Mr
= 2
7T fE"" ET£.z.(E) dE. t(15)
(16)
(17)
Therefore the values of the parameters Eo and E~ can be computed using the reflectance spectrum from which the £2(E) spectrum is ob- tained through the kramers-kronig analysis. The values of Eo~ ob- tained from the O-ray reflectance spectra measured up to about 12 eV for CdC12 , CdBr2 and CdI2 are close to those shown in Table I within the difference of 10
%.
(In the computations the high en- ergy part of the integration in eq.(17) was truncated at 12 eV.) On the other hand the computed values of the dispersion energy Ei~are smaller than those of Table I by 20-50
%.
This can be attrib- uted to the truncated integration in eq.(17), since the value of M-l is more sensitive to the high-energy £~(E) spectrum than the value of M-3 •Acknowledgments
The authors are ind9bted to Prof. Y. Nakai) Kyoto University, for mak- ing the monochromator available to them. They also wish to thank Prof. H. Yagi and members of Experimental Institute for Low Temper- ature Physics, Fukui University, for supplying them liquid nitro- gen.
References
1) K. J. Best: Phys. Kondens. Materie 1 (1963) 316.
2) D. L. Greenaway and R. Nitsche: J. Phys. Chern. Solids 26 (1965) 1445.
3) D. L. Greenaway and G. Harbeke: J. Phys. Soc. Japan 21 Supplement
(1966) 151.
4)
M. R. Tubbs: J. Phys. Chern. Solids 29(1968) 1191.
5)
K.A.
Kalder andA.
F. Malysheva: Eesti NSV Teaduste Akad.Fiusica Astron. Inst. Uurirnused (USSR)36 (1969) 154.
6)
P. A. Lee,G.
Said, R. Davis and T.H.
Lim: J. Phys. Chern. Solids 30(1969) 2719.
7)
M. R. Tubbs: Phys. Status Solidi (b) 49(1972) 11
(Review Article).8)
T. Abe,H.
Nakagawa and H. Matsumoto: Mem. Fac. Engng. Fukui Univ.23 (1975) 67.
9) A.
D. Brothers and J. T. Pajor: Phys. Rev. B 14(1976) 4570.
10)
S. Kondo and H. Matsumoto: Mem. Fac. Engng. Fukui Univ.25 (1977) 41.
11)
S. Kondo and H. Matsumoto: Solid State Commun. 24(1977) 695.
12) S. Kondo, T. Mitsunari, H. Matsumoto and H. Arima: Mem. Fac. Engng.
Fukui Univ. 26 (1978) 359.