Satellite derived aerosol information over East Asia in spring of 2003 Itaru Sano and Sonoyo Mukai
Kinki University, Faculty of Science and Technology 3-4-1 Kowakae, Higashi-Osaka 577-8502, Japan
(Received January 20, 2006)
Abstract
Japanese observing satellite, called ADEOS-2 (Advanced Earth Observing Satellite-2), carried POLDER-2 (Polarization and Directionality of Earth Reflectances) and operated from April to the end of October in 2003. This work shows the aerosol information, over East Asia region from April to June derived from POLDER-2 data. Our retrieval algorithm for aerosols is based on the light scattering behavior of the atmospheric particles in the visible and near infrared wavelengths. It is shown that very thick aerosol layer has covered over East Asia during the period. The retrieved results are validated with ground based sun photometry.
Keywords: Aerosol, Polarization, POLDER-2, ADEOS-2.
1. Introduction
The IPCC (Intergovernmental Panel on Climate Change)-2001 reported the role of aerosol is still poorly known in direct and indirect effects'. Aerosol information on a global scale, especially over the continent, is strongly desired for study of Earth's radiation budge and climate change. It is known that aerosol retrieval over land is much more difficult than that over ocean due to the complication of surface properties. POLDER mounted on the satellite ADEOS-1 and -2 operated from 1996 to 1997 and in 2003, respectively, measure the directional semi-Stokes parameters (I, Q, and U) of Earth's reflectance 2) A parameter I represents the total radiance, which is the usual quantity with other satellite sensors. On the contrary, both components Q and U indicate the polarized radiance and the angle of polarization. It has been shown that almost all of polarization
information involved in the satellite data is due to the atmospheric scattering 3) This means that polarization is very useful to estimate the information of atmospheric aerosols4' 5)• This work shows such a potential information as polarization is useful for retrieving aerosols over ground and available to estimate the forest fire smokes over East Asia during ADEOS-2 operational period.
2. Retrieval of aerosol optical thickness
An algorithm of aerosol retrieval over the ocean has been proposed in the previous wore.
The brief description is shown here as:
1) Aerosol optical thickness (AOT), Angstrom exponent and complex refractive
index are estimated based on comparison
of satellite data with the scattering
simulations with respect to the reflectance
and polarization degree through the two (0.670 and 0.865 µ m) -channel relationship
in the near infrared wavelengths.
2) The water-leaving radiance is negligible in the near infrared wavelengths.
3) The sea surface is described with Cox and Munk model.
The satellite data over the land consist of both atmospheric scattered light and reflected light by the ground surface. In general, the latter is larger than the former in magnitude.
Figure 1 shows the simulated reflectance (panel a), degree of polarization (panel b) and polarized reflectance (panel c), where the aerosol optical thickness is fixed at 0.4, the Angstrom exponent is 1.0, and the surface albedo ranges from 0.1 to 0.6. Panel (a) shows that the simulated reflectance increases with surface albedo. The polarization degree in panel (b) is also affected by the surface conditions. In contrast, polarized reflectance in panel (c) is independent of the surface albedo.
It is found from these figures that the reflectance and polarization degree are very sensitive to ground surface, but polarized reflectance is produced by atmosphere alone in this simulation. Thus the polarized reflectance looks promising for aerosol retrieval over the land.
However, it should be considered small effect of polarized reflectance from ground, because real ground surface is not the same as Lambert type from the scattering point of view.
IGBP (International Geosphere-Biosphere Programme) compiled the global land classification map for each 1km square based on NOAA/AVHRR satellite data7). Seventeen classification categories are adopted, i.e., several categories of forest, shrubland, and savanna, as well as urban, snow and ice, and water. In this work, lots of surface models are reduced to four categories such as forest, shrubland, desert, and others. However, seasonal changes especially for categories of forest, shrubland and desert are considered based on NDVI (Normalized Differential
Vegetation Index) values. Ground surface reflection characteristics, what one calls bi-directional polarized reflectance distribution function (BPRDF), are evaluated with above ground category as well as NDVI value8 .
(a) Reflectance (X=0.670 gm)
Scattering Angle (deg.)
Figure 1. Reflectance (a), degree of polarization (b), and polarized reflectance (c) at a wavelength of 0.670gm versus scattering angle.
Simulated polarized reflectance at top of the atmosphere (TOA) can be obtained by solving full Stokes vector for the radiative transfer equation (RTE) with pre-defined atmospheric parameters (molecular and specific aerosol information) as well as specific BPRDF.
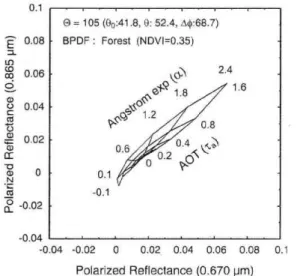
Figure 2 shows the calculated polarized reflectance at TOA at the wavelengths of 0.670 and 0.865!um under the specific geometrical condition (Sun - target atmosphere - Satellite).
Each solid line shows each result with following aerosol parameter as: [0.0, 1.6] for AOT, and [0.0, 2.4] for Angstrom exponent, where the complex refractive index is fixed at
1.45-0.0005i, over dense forest BPRDF surface model. It is of interest to mention that polarized reflectance is sensitive to small aerosols (i.e.
large Angstrom exponent value) as demonstrated. And hence polarization information is effective for anthropogenic aerosols because anthropogenic particles are usually known to be small.
by GSFC/NASA) on 20th May 2003. In order to obtain the optical properties of smoke aerosols, the optical thickness of aerosols (AOT) in the spring of 2003 is retrieved by using POLDER-2 data. Figure 4 presents the maps of the obtained aerosol optical thickness at a wavelength of 0.55 µm around East Asia.
Each image in figure 4 shows the averaged values over ten days, i.e., result from 1 to 10 April is presented in the panel a), 11 to 20 April in the panel b), and so on. It is clearly shown that the smokes widely spread over north east of China, Korea and Japan and the values of AOT exceed 0.6. The images show the forest fire occurred around the lake Bikal in Siberia in April, and then biomass burning grew and spread over East Asia on westerly winds, and calmed down at the end of June.
-U . U4 -U.UC U U.UC U.U4 U.Ub U.U23 U. I
Polarized Reflectance (0.670 pm)
Figure 2. Examples of the relationship between polarized reflectance at wavelength of 0.670 µm and that of 0.865 p.m as a function of optical thickness of aerosols (0.55 pm) and Angstrom exponent in the case of scattering angle = 105 degrees with a dense forest bi-polarization distribution function model.
3. Local analysis of aerosols
It is known that very hazy smoke has covered over East Asia in spring of 2003. Many hot spots have been clearly detected during this period with the rapid fire response system, which is based on the analysis of short infrared wavelength data taken by Terra/MODIS. Figure 3 represents hot spot region (black dotted) superimposed over MODIS image (processed
Figure 3. Siberian hot spots (dotted) region over MODIS/Terra composite image which is taken on 20th May 2003. Gray and white colors represent biomass burning plumes and clouds, respectively. The image is created by NASA/ GSFC (http://rapidfire.sci.gsfc.nasa.
gov/).
Figure 4. Aerosol optical thickness at a wavelength of 0.551.tm over East Asia in spring of 2003. The panel a) presents the averaged values over ten days from 1 to 10 April in 2003. The panels from b) to i) represent the similar averaged values from 11- 20 April to 20-30 June, respectively.
A Cimel CE-318-1 sun/sky radiometer has been set up at Shirahama since October 2000 as a part of NASA/AERONET9' 10). Figure 5 presents a scattergram of aerosol optical thickness at a wavelength of 0.55 pm against the Angstrom exponent from April to June in 2003 at Shirahama site"). The aerosol event in this figure, which gives large AOT and
Angstrom exponent, represents the Siberian biomass burning as mentioned above in Figure 4. High AOT > 0.5 are measured on 16 May, 20-23 May, 5-6 June and 20-21 June at Shirahama. Some of these events are involved in Figures 4. More detailed analysis is required though, AERONET measurements well explain the satellite images of big biomass burning in
Siberia presented in Figure 4.
Acknowledgments
The authors would like to acknowledge the CNES/POLDER team for POLDER- 2 data distribution, and B.N. Holben, and N.Wayne for help to maintain Shirahama AERONET station. Hot spot map over MODIS image (figure 3) is provided from NASA Goddard Space Flight Center.
References
.JI.VI•J
Aerosol optical thickness (0.55 pm)
.l
Figure 5. AERONET/AOT and Angstrom exponent from April to June in 2003 at Shirahama.
4. Conclusions
An algorithm for aerosol retrieval by using polarization data has been described here. The maps of aerosol optical thickness retrieved from POLDER-2 data during the Siberian forest fire from May to June in 2003 clearly indicates that the smokes widely spread over north east of China, Korea and Japan. The obtained values of aerosol optical thickness are partially examined with those by the ground sun photometry. Huge amount of aerosols produced by industrial activities in the East Asia as well as biomass burning from Siberia concerned here could affect the cloud nucleation and/or properties. The aerosol and cloud interaction should be examined in the further work in order to understand the role of aerosols in climate change.
[1] IPCC (2001), Climate change 2001 : The scientific basis, Cambridge university press.
[2] Descamps, P. -Y., F. M. Breon, M. Leroy, A. Podaire, A. Bricaud, J. C. Buriez, and G. Seze (1994): The
POLDER mission: Instrument characteristics and
scientific objectives, IEEE Trans. Geosci. Remote
Sensing, 32, pp.598-615.
[3] Herman, M., J. L. Deuze, C. Devaux, P. Goloub, F.
M. Breon, and D. Tanre (1997) : Remote Sensing of Aerosols over Land Surfaces including Polarization
Measurements and Application to POLDER
Measurements, J. Geophys. Res., 102, 17039-17049.
[4] Deuze, J.L., F. M. Breon, C. Devaux, P. Goloub, M.
Herman, B. Lafrance, M. Maignan, A. Marchand, F.
Nadal, G. Perry and D. Tnare (2001) : Remote sensing of aerosols over land surfaces from POLDER-ADEOS-1 polarized measurements, .1 Geophys. Res., 106, pp.4913-4926.
[5] Sano, I. (2004) : Optical properties and Angstrom
exponent of aerosols over the land and ocean from space-borne polarimetric data, Adv. Space Res., 34(4), pp 833-837, doi:10.1016/j.asr.2003.06.039.
[6] Sano, I., and S. Mukai (2000):Algorithm description of system flow for global aerosol distribution, Appl.
Math. and Compu., 116, 79-91.
[7] Loveland, T.R., B.C. Reed, J.F. Brown et al. (2000) : Development of a Global Land Cover
Characteristics Database and IGBP DISCover from
1-km AVHRR Data, Mt. J. Rem. Sen., 21, 1,303-1,330.
[8] Nadal, F., and F. M., Breon (1999) : Parameterization of surface polarized reflectance derived from POLDER spaceborne measurements,
IEEE Trans. Geosci. Remote Sensing, 37, pp.1709-1718.
[9] Holben, B.N., T.F. Eck, I. Slutsker, D. Tani-6, J.P.
Buis, A. Setzer, E. Vermote, J.A. Reagan, Y.
Kaufman, T. Nakajima, F. Lavenu, I. Jankowiak, and
A. Smirnov (1998) : AERONET - A federated
instrument network and data archive for aerosol characterization, Rem. Sens. Environ., 66, 1-16.
[10] Sano, I., S.Mukai, Y.Okada, B.Holben, S.Ohta and T.Takamura (2003): Optical properties of aerosols
during APEX and ACE-Asia experiments, .1
Geophys. Res., 108(D23), 8649, doi:10.1029/2002JD003263 .
[11] Sano, I. (2004) : Aerosol properties over Japan by sun/sky photometry during APEX-E3, Proc. SPIE,
5235, pp.627-634.