Assessment of Wildfire Risk at Recreational Sites in Sri Lanna National Park, Chiang Mai, Northern Thailand,
Using Remote Sensing and GIS Techniques
( GIS
)
Kansuma BURAPAPOL
2018
Assessment of Wildfire Risk at Recreational Sites in Sri Lanna National Park, Chiang Mai, Northern Thailand,
Using Remote Sensing and GIS Techniques
A dissertation presented to
The United Graduate School of Agriculture Sciences,
Tottori University in partial fulfillment of the requirements for a degree of Doctor of Philosophy in Agriculture (Landscape Ecology & GIS)
by
Kansuma BURAPAPOL
Approved by
Professor Dr. Ryota NAGASAWA Faculty of Agriculture, Tottori University
The United Graduate School of Agricultural Sciences Tottori University, Japan
March, 2018
Kansuma BURAPAPOL (2018)
Assessment of wildfire risk at recreational sites in Sri Lanna National Park, Chiang Mai, northern Thailand, Using Remote Sensing and GIS Techniques
The United Graduate School of Agricultural Sciences, Tottori University, Japan March 2018
Ph.D Thesis
Copyright © 2018 Kansuma BURAPAPOL
All rights reserved. No part of this book may be reproduced or utilized in any form by any means, electronic or mechanical, including photocopying, recording, or by any information storage and retrireval system, without written permission from the author.
Declaration
This thesis is submitted for the degree of Doctor of Philosophy at the United Graduate School of Agricultural Sciences, Tottori University. This dissertation is the result of my own work and has not been and is not being, in part or wholly, submitted for another degree, diploma, or similar qualification.
Kansuma BURAPAPOL
Acknowledgement
This Ph.D research was made possible with the funding from Scholarship of Office of National Park, Department of National Park, Wildlife and Plant Conservation (DNP).
This study was performed at the Laboratory of Landscape Ecology & GIS, Faculty of Agriculture, Tottori University, Japan.
Completing the Ph.D and writing this thesis has been a long journey, but also an amazing and enriching experience in both academic and personal terms. I have deep gratitude for many people helping me to build this dissertation over the last three years, and making this doctoral work an unforgettable experience.
First and foremost, I would like to express my sincere gratitude to my advisor Prof.
Ryota NAGASAWA for the continuous support of my Ph.D study and related research, for his support, patience, motivation, and immense knowledge. His guidance helped me in all the time of research and writing of this thesis. I could not have imagined having a better advisor and mentor for my Ph.D study. And special thanks should be given to Mr. Yossawat Thiansawat (the Sri Lanna National Park superintendent) and Mr.
Tanakorn Srisurak for data collection and providing informative data in terms of field survey in Sri Lanna National Park. The important supporters were my DNP colleagues;
Mrs. Rewadee Panyatram and Mr. Alongkot Janbumrung. Thank you for all your helps, continuous supports, good conversations and pleasant meals.
I am also grateful to Office of National Park and DNP for the financial support of Scholarship to study in Tottori University, Japan and for providing the resources and conditions needed for the development of my Ph.D work.
In addition, friends are an essential part of surviving the Ph.D process during three years in Japan. I must thank my friends and lab colleagues (too many to list here but they know who they are!) for providing the support and friendship that I needed. A special thank you to my Indonesian friends; Miss Lissa Fajri Yayusman and Miss Prima Rizky Miralva for their company, creating a great memories and making me laugh even in the not so-good moments.
Of course no acknowledgments would be complete without giving thanks to my family ( ). All of them always gave me much of love and much of
encouragement to complete Ph.D study. I would like to express my deepest appreciation to my parents who work very hard during their entire life to provide the best for me and my sister and brother. To my sister and brother who, although the distance, always gave me the best of the advices and support. Thank you all for support, patient, unwavering belief in me and giving me the strength to finish my Ph.D dissertation. I could not have complete this long journey without family by my side. There are no words that can express my gratitude and appreciation for all you do and are for me. I love you all.
Table of Contents
Acknowledgement ... i
Table of Contents ... iii
List of Tables ... vi
List of Figures ... vii
List of Abbreviation ... ix
CHAPTER 1 ... 1
Introduction 1.1 Research Background ... 1
1.2 Objectives and Research Hypotheses ... 5
1.3 Dissertation Outline ... 6
CHAPTER 2 ... 8
Theoretical and Conceptual Framework 2.1 National Parks and Recreational Areas ... 8
2.2 Wildfire ... 10
2.2.1 Characteristics of Wildfire ... 10
2.2.2 Factors Influencing Wildfire ... 13
2.3 Wildfire Risk Assessment ... 18
2.4 Remote Sensing Data and GIS ... 19
2.4.1 General Concepts of Remote Sensing ... 19
2.4.2 General Concepts of GIS ... 21
2.5 Integrating Remote Sensing and GIS for Wildfire Risk Assessment ... 22
2.6 Overall Conceptual Framework of the Research ... 23
CHAPTER 3 ... 26
Study Area Characteristics - Sri Lanna National Park 3.1 Physical Conditions ... 26
3.1.1 Geographic Location ... 26
3.1.2 Topographical Characteristics ... 27
3.1.3 Geological and Soil Characteristics ... 28
3.2 Meteorological Conditions ... 28
3.3 Resources Base in Sri Lanna National Park ... 29
3.3.1 Forest Resources... 29
3.3.2 Wildlife Resources ... 30
3.4 Human Resources ... 31
3.5 Tourism and Recreation in Sri Lanna National Park ... 31
CHAPTER 4 ... 35
Mapping wildfire fuel load distribution using Landsat 8 Operational Land Imager (OLI) datain Sri Lanna National Park, northern Thailand 4.1 Introduction ... 35
4.2 Materials and methods ... 37
4.2.1 Field data measurement ... 37
4.2.2 Standard leaf biomass calculation ... 37
4.2.3 Leaf fuel load calculation ... 38
4.2.4 Landsat 8 OLI data and preprocessing ... 39
4.2.5 Calculation of VIs ... 39
4.2.6 Leaf biomass estimation equation based on VI ... 41
4.2.7 Leaf fuel load prediction model ... 41
4.3 Results and Discussion ... 43
4.3.1 Relationship between calculated standard leaf biomass and VIs ... 43
4.3.2 Leaf biomass estimation equation based on VI ... 45
4.3.3 Leaf fuel load prediction model ... 47
4.4 Conclusions ... 52
CHAPTER 5 ... 54
Mapping Soil Moisture as an Indicator of Wildfire Risk Using Landsat 8 Images in Sri Lanna National Park, Northern Thailand 5.1 Introduction ... 54
5.2 Materials and methods ... 56
5.2.1 Field data measurement ... 56
5.2.2 Gravimetric Soil Moisture Measurements ... 57
5.2.3 Leaf Fuel Moisture Measurements ... 58
5.2.4 Remotely Sensed Data and Preprocessing ... 58
5.2.5 Soil Moisture Estimates ... 59
5.2.6 Analysis of the Relationship Between Estimated Soil Moisture and Leaf Fuel Moisture ... 62
5.3 Results and Discussion ... 62
5.4 Conclusions ... 68
CHAPTER 6 ... 70
Assessment of Wildfire Risk at Recreational Sites in Sri Lanna National Park, Chiang Mai, Northern Thailand, using Remote Sensing and GIS Techniques 6.1 Introduction ... 70
6.2 Materials and methods ... 71
6.2.1 Dataset ... 71
6.2.2 Methodology ... 74
6.3 Results and Discussion ... 78
6.4 Conclusions ... 88
CHAPTER 7 ... 90
General Discussions and Conclusions 7.1 Discussion and Conclusions ... 90
7.2 Recommendations ... 94
References... 95
List of Publications ... 109
Appendix ... 110
Summary ... 115
Japanese Summary ... 118
List of Tables
Table 2.1 Causes of wildfire ignition in Thailand ... 17
Table 2.2 Previous studies that have used remote sensing (RS) and GIS for assessing wildfire risk ... 24
Table 3.1 Variety of forest types in Sri Lanna national park ... 30
Table 3.2 Wildlife resources in Sri Lanna national park ... 31
Table 3.3 List of attractive places and recreational sites in Sri Lanna national park . 34 Table 4.1 Summary of leaf biomass equations for dipterocarp and deciduous forests . 44 Table 4.2 Estimated leaf fuel biomass in normal and dry seasons, and a comparison between the missing leaf biomass or predicted leaf fuel loads and the calculated leaf fuel loads in the field ... 48
Table 4.3 Statistical validations of leaf fuel load prediction models for dipterocarp and deciduous forests ... 49
Table 5.1 Selected Landsat 8 and MODIS images for dry season ... 59
Table 5.2 Comparison of statistical soil moisture models ... 65
Table 5.3 Statistical validation between the actual and soil moisture estimated from the model ... 65
Table 6.1 Data sources of parameters used for modeling and mapping wildfire risk and evaluating wildfire risk to recreational sites ... 73
Table 6.2 Subclasses of each factor ... 75
Table 6.3 Numerical rating of the fundamental scale ... 76
Table 6.4 Confusion matrix modified from Congalton (1991) ... 77
Table 6.5 Rating wildfire sensitivity scores assigned to subclasses for wildfire risk modeling ... 79
Table 6.6 Calculation of factor weightings based on pairwise comparison matrix of three experts in wildfires. ... 83
Table 6.7 Weightings assigned to factors influencing wildfire, based on the judgments of wildfire experts and stakeholders using a pairwise comparison method . 84 Table 6.8 Accuracy assessment of wildfire risk map based on the confusion matrix ... 86
Table 6.9 Results of the wildfire risk map ... 86
Table 6.10 Evaluation of wildfire potential at recreational sites based on the wildfire risk map ... 88
List of Figures
Figure 1.1 ... 2
Figure 1.2 Wildfire frequency and area burned over a number of years within Thai protected forest areas ... 2
Figure 2.1 Different types of forest in Thailand ... 9
Figure 2.2 Natural resources and nature-based recreation activities in Thai national parks ... 10
Figure 2.3 Concepts of fire change across spatial and temporal scales, modified from Mark and Kevin (2009) ... 11
Figure 2.4 Types of wildfire ... 12
Figure 2.5 A surface wildfire in Thailand ... 13
Figure 2.6 Most of the surface fuel in dipterocarp (left) and deciduous (right) forests derives from dead leaves ... 14
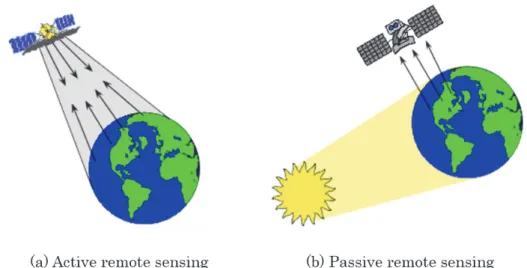
Figure 2.7 Types of remote sensors (a) active remote sensing and (b) passive remote sensing (source: Canada Centre for Remote Sensing-CCRS) ... 20
Figure 2.8 Overall conceptual framework of wildfire risk assessment at recreational areas ... 25
Figure 3.1 Geographic location of Sri Lanna national park ... 26
Figure 3.2 Topographical characteristic of Sri Lanna national park ... 27
Figure 3.3 Average temperature and precipitation in the years 2010 to 2016 ... 29
Figure 3.4 Number of tourists and total income from tourism in Sri Lanna national park in the years 2010 to 2016... 32
Figure 3.5 Attractive places for nature-based tourism and recreational activities in Sri Lanna national park ... 33
Figure 4.1 Sample plots in dipterocarp and deciduous forests ... 37
Figure 4.2 Test results for assumptions of regression leaf biomass equations: (i) the histograms, (ii) probability plots, and (iii) scatter plots-dispersion plots: (a) dipterocarp and (b) deciduous forests ... 46
Figure 4.3 Distribution of leaf fuel loads from statistical models of (a) dipterocarp and (b) deciduous forests in Sri Lanna National Park during the dry season .. 50
Figure 5.1 Sample plots in dipterocarp and deciduous forests ... 57 Figure 5.2 Simplified presentation of TVDI based on the triangular shape of the
NDVI-LST relationship ... 59 Figure 5.3 Observed relationships for NDVI-LST and NDWI-LST, based on the
conceptual TVDI model ... 63 Figure 5.4 Extraction of a Landsat 8 image from 19 February 2015 for
(a) TVDINDWI-LST and (b) NDDI ... 64 Figure 5.5 Spatial distribution of soil moisture derived from the model generated by
the modified TVDINDWI-LST and the NDDI in Sri Lanna National Park during the dry season on 19 February 2015 ... 66 Figure 5.6 Scatter plot of leaf fuel moisture measured in the field and estimated soil
moisture ... 67 Figure 6.1 Overall methodology ... 72 Figure 6.2 (a) The dNBR in Sri Lanna National Park obtained from Landsat 8 images;
(b) leaf fuel load with rated subclasses; (c) soil moisture with rated subclasses; (d) slope with rated subclasses; (e) aspect with rated
subclasses; (f) elevation with rated subclasses; (g) road buffer with rated subclasses, and (h) settlement buffer with rated subclasses ... 80 Figure 6.3 (a) Spatial map of estimated wildfire risk and (b) estimated wildfire risk
compared with actual wildfire sites ... 85 Figure 6.4 Recreational sites overlaid onto zones of estimated wildfire risk ... 87
List of Abbreviation
ADD : Absolute Average Difference adj-R2 : Adjusted R-squared
AHP : Analytic Hierarchy Process CVI : Chlorophyll Vegetation Index DBH : Diameter at Breast Height DEM : Digital Elevation Model
dNBR : Differenced Normalized Burn Ratio
DNP : Department of National Parks, Wildlife and Plant Conservation of Thailand DNs : Digital Numbers
DVI : Different Vegetation Index EO : Earth observation
EVI2 : Two-band Enhanced Vegetation Index
FAO : Food and Agriculture Organization of the United Nations FMC : Fuel Moisture Content
GBH : Girth at Breast Height
GIS : Geographic Information System
IUCN : International Union for Conservation of Nature and Natural Resources Landsat OLI/ TIRS : Landsat Operational Land Imager/ Thermal Infrared Sensor Landsat TM/ETM : Landsat Thematic Mapper /Enhanced Thermatic Mapper LB : The Estimated Leaf Biomass
LST : Land Surface Temperature
LSTmax : The maximum LST
LSTmin : The minimum LST
MODIS : Moderate Resolution Imaging Spectroradiometer NBR : Normalized Burn Ratio
NDDI : Normalized Difference Drought Index NDVI : Normalized Difference Vegetation Index NDWI : Normalized Difference Water Index NIR : Near-Infrared
P-P plot : probability plot R2 : R-squared
RMSE : Root Mean Square Error RS : Remote Sensing
RVI : Ratio Vegetation Index
SAVI : Soil-Adjusted Vegetation Index SD : Standard Deviation
SWIR : Shortwave Infrared Tb : Brightness Temperature
TVDI : Temperature Vegetation Dryness Index USGS : United States Geological Survey
UTM : Universal Transverse Mercator VI : Vegetation Indix
WFR : The Numerical Index of Wildfire Risk WGS : World Geodetic System
CHAPTER 1 Introduction
1.1 Research Background
The Kingdom of Thailand is located in the tropical area of Southeast Asia between latitudes 50° 35 and 200° 15 north and longitudes 97° 30 and 105° 45 east. Its total area is 513,115 km2 consisting of mountainous areas, highlands and lowlands. Thailand is situated in a hot and humid climatic zone which supports a variety of tropical ecosystems. According to the climate pattern and topography, Thailand has complex and varied types of forests, classified as tropical forests, which are rich in ecosystem diversity, natural communities and habitats. Moreover, forest areas are important places for the protection of ecological systems and natural resources as well as for the provision of recreational and tourism opportunities for people (Boyd, 2006). Therefore, these forest areas have been protected to prevent loss or degradation resulting from natural or man-made causes. National parks represent one type of protected forest area with special habitats, plants and wildlife. National parks are managed by the Department of National Parks, Wildlife and Plant Conservation of Thailand (DNP). A national park is a park with a large area of land that is protected because it has a wide variety of landscapes and a high diversity of native plants and animals. In addition, a national park is an open space providing outdoor recreation and camping opportunities as well as education for the public on the importance of conservation and on the natural wonders of the country in which the national park is located. Therefore, recreation and tourism play an important role in the life of a national park. Recreational areas are open sites which have a wide variety of natural features and landscapes that support tourist attractions and activities. Forests are major recreational areas in national parks, supporting nature-based activities in these areas. Thus, when forests are lost or destroyed, their destruction necessarily has a significant effect on recreational areas.
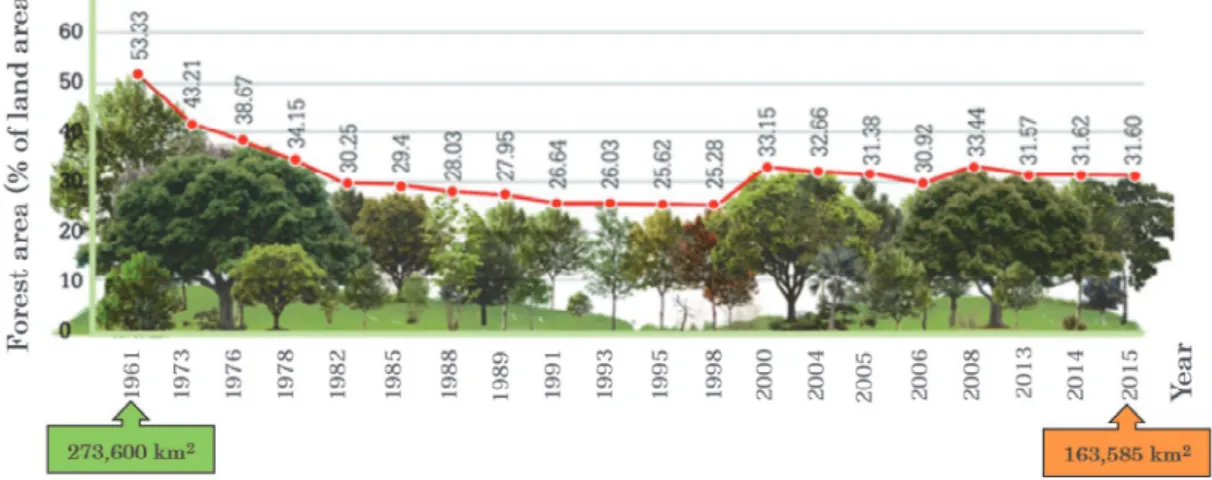
In present times, many forests in Thailand have been completely lost and destroyed, mainly as a result of human activities or natural forces. In the past, Thailand was a country with a high percentage of forest cover: around 27,360,000 hectares (ha) accounting for half of the land area (53.33%). This area is now considerably reduced, and only 31.60% of forest area remains compared to the situation 50 years ago (Figure
1. continuously decreasing trend.
Figure 1.1 (The Seub Nakhasathien foundation, 2017) As previously mentioned, human activities and natural occurrences are the main causes of forest area degradation. In a developing country like Thailand, people interact with nature and forests for their livelihoods, contributing to problems caused by human actions. Plantation agriculture and illegal logging especially are major threats in forest areas. In addition, the damage caused by natural occurrences such as flood, drought and wildfire endanger tropical forest areas to an extreme degree. Interestingly, wildfire can be caused both naturally and by humans. It has become a serious problem in Thailand.
Figure 1.2 Wildfire frequency and area burned over a number of years within Thai protected forest areas (Forest Fire Control Division, 2016)
Wildfire is one of the important causes of devastating impacts on soil nutrient loss, disturbance of wildlife habitat and air pollution, as well as resulting in large burned forest areas. Moreover, wildfire in forest landscapes can also damage the natural resources, biophysical scenery and landscapes which are the bases of tourism and recreation. Since Thailand is located in a hot-humid climate, it can result in a drought.
The dry season runs from November to April. In the dry season, the forest faces a dry and hot climate, resulting in drought conditions, and the forest is therefore vulnerable to fire, which is a major cause of forest degradation. Human activity is also a major cause of fire ignition, especially burning to clear agricultural areas for large plantations and the small fires used in livelihood activities. As a result, fires can burn out of control in degraded landscapes and encroach upon forest areas. Protected forest areas in Thailand have experienced a large number of wildfires over the past few decades. The statistical evidence in Figure 1.2 shows that wildfires occurring in Thai protected forest areas have been increasing in frequency and severity since 2011. This implies that the number of wildfires has been increasing, but that there is also a trend toward larger burned areas. Therefore wildfire has become a problematic phenomenon and wildfire management takes a high priority in protected forest areas, as an integral part of forest management.
FAO (2006) gives a definition of wildfire management as an approach that requires many activities for the protection of burnable forest and other valuable vegetation from fire. It involves the strategic integration of such factors as knowledge of fire regimes, probable fire effects, values at risk, level of forest protection required, cost of fire-related activities and prescribed fire technology into multiple-use planning, decision-making and day-to-day activities to accomplish stated resource management objectives.
Therefore, wildfire management is the process of planning for, preventing and fighting fires in order to protect forest resource including landscape and wildlife. Moreover, the principles of wildfire management state that these processes should be considered before making decisions about what actions to take on wildfires. Wildfire prevention is the most important part of wildfire management. It is directly related to both processes of wildfire, as firstly, it can help to stop wildfires before they start and secondly, it can also reduce the spread and intensity of wildfires after they have started. Therefore, wildfire prevention plays a significant role in wildfire management. There are several strategies for wildfire prevention, such as local community-based approaches, fire detection, fuel reduction, firebreak creation and fire risk assessment. With regard to
wildfire risk assessment, the key approach is to prevent a wildfire from starting and to reduce the intensity of a wildfire, once started. In addition, it can be used for planning and preparation for wildfire suppression activities.
Risk assessments are decision support tools that integrate information regarding the likelihood and magnitude of resource responses to risk factors, in order to synthesize a conclusion about risk that can inform decision-making (Sikder et al., 2006). Assessing wildfire risk essentially requires an understanding of the likelihood of wildfires by intensity level, and the magnitude of the potential beneficial and harmful effects on valued resources from fires at different intensity levels (Finney, 2005). Therefore, wildfire risk assessment is a holistic approach that integrates the likelihood of wildfire and the critical factors responsible for igniting and driving wildfire, in order to evaluate exposure to fire risk and to identify levels of risk. In other words, assessment of wildfire risk must include consideration of the factors responsible for driving wildfire occurrence, based on understanding wildfire behavior and the factors catalyzing wildfire ignition. Wildfire behavior is a product of the environment in which the fire is burning. The fire environment includes the surrounding conditions, influences and modifying forces that determine the behavior of the fire. Fuel, weather and topography are the main interacting influences that make up the fire environment (Pyne et al., 1996). Wildfire risk assessment should also consider other factors contributing to wildfire ignition, particularly human activity, which is a major factor in the occurrence of wildfires. Essentially, through wildfire risk assessment, a combination of many factors (based firstly on fire environment, i.e., fuel, weather and topography and secondly on human activity or anthropogenic factors, i.e., distance from roads and proximity to settlements) should be considered for modeling wildfire risk.
Many tools and techniques are used for assessing wildfire risk, especially Earth observation (EO) and geographic information system (GIS) techniques. The use of EO data enables the detection and classification of objects on the Earth, including on its surface. EO data are normally acquired from remote sensing platforms such as satellites. The use of satellite remote sensing data is traditionally based on the use of various spectral indices. Vegetation indices (VIs) are a mathematical combination of different spectral bands. VIs are widely used and have benefited numerous disciplines concerned with the assessment of biomass, forest detection, plant stress, plant health, crop production and wildfire. Regarding wildfire assessment, VI has been applied in the analysis of wildfires including the effects of fire severity, pre- and post-fire events,
wildfire factors and wildfire risk zones. The use of satellite remote sensing data for the analysis of wildfire risk is traditionally based on the use of various spectral indices.
Hence, the application of VI derived from remote sensing data for the extraction of wildfire factors is an interesting approach to assessing and modeling wildfire risk. GIS is an information system designed to work with data referenced by spatial or geographic coordinates. In other words, a GIS is both a database system with specific capabilities for spatially-referenced data, and also a set of operations for working with the data (Star and Estes, 1990). Therefore, GIS techniques have opened up opportunities for analyzing and integrating a great variety of wildfire factors at all geographic and spatial scales as well as for establishing a GIS-based wildfire risk model. To move forward, both techniques should be combined for the application of wildfire management at large scales and in remote areas. These techniques are suitable for identifying the spatial distribution of wildfire risk at recreation sites located in forest areas, especially in national parks. Using remote sensing and GIS techniques for wildfire risk assessment means that it is typically easier and cheaper to prevent a wildfire from starting than to put it out. In addition, remote sensing and GIS can increase the efficiency of wildfire risk reduction in forest areas and assist in the development of guidelines regarding the prevention of wildfires at recreation sites.
1.2 Objectives and Research Hypotheses
The purpose of this dissertation is firstly to assess wildfire risk and its corresponding risk levels by integrating the techniques of remote sensing and GIS, based on several factors associated with wildfire, and then to exploit the assessed wildfire risk to evaluate the wildfire risk at recreational sites. The factors selected for modeling and mapping wildfire risk are commonly recognized as factors in wildfire occurrence, namely, leaf fuel loads, soil moisture, slope, aspect, elevation, distance from roads and proximity to settlements. The capabilities of remote sensing and GIS techniques are utilized for analyzing wildfire risk at recreational sites. Therefore, the objectives of the research were formulated as follows:
(1) To estimate the spatial distribution of the leaf fuel load, as one of the selected factors influencing wildfire, by generating a predictive model of leaf fuel load using remotely sensed data based on VIs derived from a Landsat 8 Operational Land Imager (OLI).
(2) To predict the spatial distribution of soil moisture, as one of the selected factors responsible for wildfire occurrence, by establishing a predictive model of soil moisture using remote sensing based on VIs computed from Landsat 8 OLI/thermal infrared sensor (TIRS) and moderate-resolution imaging spectroradiometer (MODIS) data.
(3) To evaluate the use of soil moisture data for wildfire risk assessment.
(4) To map wildfire risk zones based on the integration of several factors contributing to wildfire, including leaf fuel loads, soil moisture, slope, aspect, elevation, distance from roads and proximity to settlements.
(5) To assess wildfire risk at recreational sites using GIS.
In addressing these objectives, the research concentrated particularly on the following hypotheses:
Regarding the first objective, to study the leaf fuel load estimation based on VIs, we hypothesized that:
Regarding the second objective, to estimate the soil moisture based on VIs, we hypothesized that:
1.3 Dissertation Outline
This dissertation is divided into seven chapters. This first chapter is intended to provide an introduction to the research, and consists of three main elements: the background, the objectives and an outline of the whole thesis. Chapter 2 reviews theoretical definitions of important terms drawn from the literature on national parks and recreational areas, wildfire, wildfire risk assessment and the applications of remote
sensing and GIS techniques in evaluating wildfire risk. This chapter also provides a conceptual framework for the methodology used in the study. Chapter 3 gives the characteristics and details of the study area.
Chapter 4 describes the leaf fuel load estimation required to achieve the first objective. Many potential VIs extracted from remote sensing data are compared for their ability to estimate leaf biomass, and are then used to estimate leaf biomass in normal and dry seasons (a seasonal VI). The leaf fuel load is estimated based on the difference in the estimated leaf biomass in normal and dry seasons. The difference in the estimated leaf biomass can determine the quantity of the missing leaf biomass which is regarded as the leaf fuel load on the ground surface.
To accomplish the second and third objectives, chapter 4 investigates the relationship between VIs (NDVI and NDWI) and the LST before calculating the TVDI. The spatial distribution of soil moisture is estimated based on the TVDI (modified from NDWI and LST) and the normalized difference drought index (NDDI). Based on the results for the estimated soil moisture, the correlation with leaf fuel moisture for wildfire risk assessment is evaluated.
To fulfill the fourth and fifth objectives, chapter 5 integrates crucial factors influencing wildfire computed from remote sensing data, (i.e., leaf fuel load and soil moisture) and GIS data, (i.e., slope, aspect, elevation, distance from roads and proximity to settlements), to establish a wildfire risk model using pairwise comparison and GIS approaches. A map of wildfire risk zones generated from the model is later used to assess the risks of wildfire at recreational sites.
Finally, in chapter 6, overall conclusions are given.
CHAPTER 2 Theoretical and Conceptual Framework
2.1 National Parks and Recreational Areas
Thailand is one of the tropical countries located in Southeast Asia in which forests are valued for their high biodiversity, ecosystems and commercial importance (Kummer and Turner, 1994). Forests in Thailand are rich in biological diversity, containing approximately 6-10% of the total number of species known thus far (Baimai, 2010).
There are various kinds of tropical forest in Thailand including evergreen forest, pine forest, dry dipterocarp forest, mixed deciduous forest, mangrove forest and peat swamp forest (Figure 2.1). These variations in forest type provide a multitude of benefits in terms of goods (timber, food, fuel and bioproducts), ecological functions (habitat for a vast array of plants and wildlife) and places for recreation. Thailand's forests have been managed according to conservation and protection objectives. Forest conservation refers to a range of activities, tools and approaches to maintain forest health and biodiversity. Forest protection refers to the creation of parks and other areas to legally protect them from industrial activity and to help preserve healthy ecosystems. Forests in Thailand representing around 20% of total land area have been placed in protected areas managed by DNP. These protected areas have been divided into four main types and include 130 national parks, 59 wildlife sanctuaries, 79 non-hunting areas, and 120 forests (Office of National Park, 2017). Clearly, national parks make up the largest number of these protected areas and play an important role in sustainable forest management.
National parks are usually large areas of protected land, primarily established for the purpose of conservation and enhancement of the natural scenery, wildlife and cultural heritage (Mallarach, 2008). IUCN defines a national park as a natural area of land or sea which provides a foundation for spiritual, scientific, educational, recreational and visitor opportunities (IUCN, 1994). Hence, national parks encompass a wide range of native plants and animals as well as unspoilt landscapes, and they allow and encourage access for educational, recreational and tourism purposes.
Nowadays, national parks are always open to visitors (Gissibl et al., 2012) and are important tourist destinations. According to Fennel and Smale (1992), national parks are attracting increasing numbers of nature-oriented ecotourists.
Figure 2.1 Different types of forest in Thailand
This means that most national parks provide tourism facilities based on natural outdoor recreation and camping opportunities, as well as classes designed to educate the public on the importance of conservation and on the natural features of the country in which the national park is located. Tourism and conservation objectives are complementary and jointly achievable in both national parks and game reserves, although tourism should be secondary to conservation, as asserted by the proponents of ecological tourism (Yunis, 2003). Therefore, recreational activities and areas play an important role in the life of a national park since they contribute to tourism opportunities and even have the potential to actively promote the sustainable management of the national park.
There are many different kinds of tourism and recreation based on the unique landscape and special scenery of a particular national park, including recreation, outdoor recreation, adventure tourism and nature-based tourism. Recreation can be define
include many different activities such as hiking, climbing and fishing. This definition of recreation therefore pertains to tourism. A recreational area is an area used by the public for recreation and provides satisfaction and pleasure for people. Recreational areas in national parks which are associated with forests and other natural resources (such as mountains, waterfalls, caves, hot springs and beaches), offer nature-based recreational activities (Figure 2.2).
Figure 2.2 Natural resources and nature-based recreation activities in Thai national parks
Hence, forests, natural resources and wildlife in national parks provide recreation opportunities and settings, and support a wide range of activities, (e.g., walking and hiking on trails, nature observation, camping and picnicking, biking, watching birds and wildlife, boating and canoeing). Recently, these recreation activities have become the fastest-growing tourism sector in national parks while the areas supporting these activities have been increasingly threatened in many ways. One of the causes of damage to recreational areas is wildfires. Wildfires have a negative impact on recreational areas due to landscape-scale damage and result in a decline in tourism activities. Hence, it is necessary to recognize the need for professionalism in the management of tourism and recreation in protected areas (Weaver, 2001; Worboys et al., 2001; Eagles et al., 2002;
Newsome, 2002). This therefore implies that providing recreational areas for tourism while also protecting the national park resources from wildfire is an important component of national park management.
2.2 Wildfire
2.2.1 Characteristics of Wildfire
Wildfire is fire in a wild area, especially in a forest, that is not controlled and that can burn a large area of the forest landscape. The pattern of fire effects on forests
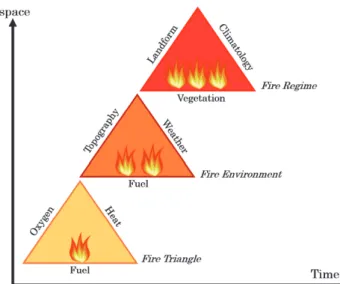
depends on the temporal and spatial scale of fires. Wildfire is one of the most important causes of impacts on landscapes and ecosystems (Brown and Kapler, 2000; Bond and Keeley, 2005; Santi et al., 2013). A concept of three fire triangles can describe the characteristics of wildfire and its role in a forest landscape and ecology (Figure 2.3).
This concept indicates the relative importance of the major factors of climate, fuel and landscape variables at different scales (Timothy, 2014). At the smallest scale (Figure 2.3 lower left), fire begins with combustion as described in the fire triangle. There are three basic components that are required for a fire to ignite, burn and continue to burn.
These are oxygen, heat and fuel. Fuel is any material that can ignite and be burned, oxygen is an essential part of the chemical reaction needed to create fire and heat is needed for ignition.
Figure 2.3 Concepts of fire change across spatial and temporal scales, modified from Mark and Kevin (2009)
At the next temporal and spatial scale (Figure 2.3 middle), there are three factors that make up the fire environment, namely fuel, weather and topography. These factors influence fire behavior including ignition probability, rate of fire spreading, and fire intensity at seasonal to annual time scales (Rothermel, 1972; Pyne et al., 1996). Fire behavior is a product of the environment in which the fire is burning (Pyne et al., 1996).
It refers to the manner in which fuel ignites and flame develops, how fast a fire spreads and how intensely a fire burns. In wildfires, this behavior is primarily related to the fire environment, i.e., the weather, topography, and fuel characteristics. Many researchers have studied fire behavior and found that it is affected by many factors, such as weather conditions (Bailing et al., 1992), fuel characteristics (Mouillot et al.,
2002; Schoenberg, 2003), human activities (Velez, 1992), fire management activities (Fried et al., 2008) and changes in land uses (Rego, 1992) and climate (Flannigan et al., 2000; Fried et al., 2004).
On timescales of decades to millennia (Figure 2.3 upper right), the fire regime triangle describes variables that determine the characteristic pattern, frequency, and intensity of fire at landscape and broader scales, reflecting the linkages between vegetation as a determinant of fuel, climate conditions as a creator of weather and ignition sources, whether human or natural (Parisien and Moritz, 2009; Krawchuk and Moritz, 2011). Therefore, in understanding the characteristics of fire, it is helpful to define linkages between the factors responsible for wildfire and the surrounding conditions, influences and modifying forces that determine fire behavior, and which can affect fire spreading and fire severity across landscape-scale forest areas.
There are three types of wildfire: ground fire, surface fire and crown fire (Figure 2.4).
A ground fire burns organic material in the soil or peat, and other materials which can ignite and burn under the ground. This is a persistent slow-burning fire because the combustible materials (ground fuels) are compacted, have a limited oxygen supply and are protected from wind. A surface fire burns in the surface fuel layer which lies immediately above the ground fuels but below the canopy or aerial fuels. Surface fuels consist of needles, leaves, grass, dead and fallen branches and logs, shrubs, low brush, and short trees (Brown et al., 1982). The rate of surface fire spreading depends on the density of these fuels, the continuity and size of trees and
Figure 2.4 Types of wildfire (source: Slideshare.net)
underbrush, the slope of the terrain and the weather. A crown fire burns and spreads through the crown or canopy of trees. Canopy fuels normally consumed in crown fires consist of live and dead foliage, lichen, and fine live and dead branch wood found in a forest canopy (Scott and Reinhardt, 2001). The influence of wind is greater in the tree canopy and where this canopy is interconnected or continuous, fires can spread quickly and extremely. In general, wildfire in Thailand is classified as surface fire (Figure 2.5).
It occurs annually during the dry season from November to April with the peak period in February and March. The most common surface fires take place mainly in dry dipterocarp forests and in mixed deciduous forests. This is because during the dry season, under certain drought conditions, dipterocarp and deciduous trees shed their leaves in a cycle which helps them to survive in drought conditions. The dead leaves fall to the ground surface and form the largest part of the fuel load. This results in fuel accumulation on the ground surface, which can ignite and burn down to the surface to become a surface fire. Therefore, dipterocarp and deciduous forests are the main areas prone to wildfire in Thailand, and their dead leaves can result in the development of extreme fire behavior, contributing to intense and uncontrolled fires.
Figure 2.5 A surface wildfire in Thailand
2.2.2 Factors Influencing Wildfire
There are several factors that must be considered with regard to wildfire occurrence.
Not only factors based on the fire environment, but also factors derived from human activities influence the stages of wildfire occurrence. At the initial stage of wildfires, human activities are the most important factor contributing to wildfire ignition. After combustion occurs and a fire begins to burn, there are several factors that determine
how the fire behaves and spreads. These factors are based on the fire environment including fuel, weather and topography. Hence, determining these factors can reduce fire likelihood and the occurrence of conditions that contribute to wildfire. The factors affecting wildfire occurrence which are considered in this research for analyzing wildfire risk, are listed below;
Fuel Load
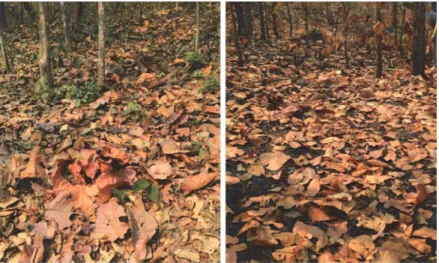
Fuel is any organic material, living or dead, that can ignite and burn. In the case of wildfire, fuels are primarily carbohydrates (cellulose and hemicellulose) derived from vegetative biomass that can be burned (Mark and Kevin, 2009). Bracmort (2013) states that fuel loads typically exclude biomass in live, commercially valuable trees. Thus, fuel loads consist of dead biomass (needles or leaves, branches that have fallen, and older dead cellulose). Therefore, the leaf biomass of trees in forests, especially dipterocarp and deciduous forests, can provide annually available surface fuel, because these leaves are typically shed in the dry season. Consequently, this dead-leaf biomass becomes an important fuel lying on the ground (Figure 2.6).
Figure 2.6 Most of the surface fuel in dipterocarp (left) and deciduous (right) forests derives from dead leaves
As reviewed above, fuel is one of the components of combustion and fire environment;
the amount of fuel has therefore a considerable effect on fire behavior. Thus, analysis of the fuel characteristics is a strategy in the evaluation of fire behavior. Several researchers have devised fuel models to provide estimated values of fuel loadings, surface area to volume ratios, fuel depths, fuel particle density, heat content and moisture of extinction for fire behavior modeling (Rothermel, 1983; Scott and Burgan,
2005). Three sets of fuel models are commonly used in large landscape-scale contexts to describe predicted fire behaviors (Anderson, 1982; Noonan-Wright et al., 2013), fire danger (Deeming and Brown, 1975; Deeming and Burgan, 1977) and fire risk and potential (Burgan et al., 1998). Anderson (1982) states that fuel load and fuel depth are significant fuel properties for predicting whether a fire will be ignited, its rate of spreading and its intensity. Very low volumes of surface fuel can result in a low fire intensity, whereas larger volumes of surface fuel define a risk of high-intensity fires and an extreme overall fuel hazard. Thus, total fuel accumulations (fuel loads) contribute to fire intensity and damage and should be considered when assessing wildfire risk.
Soil Moisture
The climate in Thailand is controlled by tropical monsoons and the weather is
hot or dry season and the rainy season. In reality, however, the weather is relatively hot for most of the year. Dry weather is one of the most important parameters influencing wildfire occurrence (Yongqiang et al., 2010). Drier conditions increase the chances of a fire starting, and help a burning fire spread, resulting in a more intense and long-burning fire. One of the indicators commonly used for detecting drought conditions is the level of soil moisture. Drier conditions cause soils to be drier for longer, increasing the likelihood of drought and a longer wildfire season. Moreover, the level of fire severity depends upon heat transfer in the soil during the combustion of above- ground fuels and surface organic layers (Neary et al., 2005). During the burning process in a wildfire, heat can rapidly transfer from the fire to the dry soil. Consequently, the wildfire spreads quickly and soon becomes intense. Krueger et al. (2015) studied the influence of soil moisture on wildfire size and found that large growing-season wildfires occurred exclusively under conditions of low soil moisture. In addition, soil moisture is positively correlated with fuel moisture, because fuel moisture is fundamentally controlled by plant physiology and soil water availability. Dead-fuel moisture especially is affected by soil moisture (which is also affected by weather) near the dead-fuel surface (Dimitrakopoulos et al., 2011). Therefore, considering soil moisture as a factor linked to wildfire is likely to be effective for evaluating wildfire risk.
Topography
Topography refers to the surface features of the land, and this is the most constant of the three fire environment components. Topographic features can cause dramatic changes in wildfire behavior and can affect how prone the area is to fire. All topographic features, including slope, aspect and elevation, influence fire behavior (Rothermel, 1991; Anderson, 1982) and particularly fire spread (how fast a fire moves in feet per hour), therefore affecting the distribution of burned areas across landscapes.
Slope is the angle of incline on a hillside. Slope can be a primary influence on wildfire behavior because the slope increases the radiation and convection heat transfer up the slope. The steeper the slope the greater the up-slope heat transfer and thus, the higher the fire spreading rate and intensity. Curry and Fons (1938; 1940) suggested that slope resulted in increased heat transfer between the flames and the fuel ahead of them.
McArthur (1968) suggests that slope can significantly affect the rate of spread of fire, especially immediately following ignition. He suggests that when compared to flat terrain, directional fire spreading rates will double on 10-degree slopes and increase fourfold on 20-degree slopes. Therefore, as the steepness of the slope increases, the fire spreads more quickly. On the other hand, fires tend to move more slowly as the slope decreases.
Aspect is the direction in which a slope faces. Aspect affects fire behavior through the degree of solar exposure and the wind that different aspects receive. Normally, in the northern hemisphere, a north-facing slope faces away from the sun and thus is generally cooler and moister than south-facing slopes. Conversely, south and southwest aspects receive more sunshine leading to lower humidities and higher fuel temperatures (Pyne et al., 1996) and therefore have the most favorable conditions for starting and spreading fires.
Elevation is the height of the given terrain above mean sea level. Elevation influences fire spread by impacting the wind behavior and precipitation patterns (Bennett et al., 2010) and thereby plays a large role in determining the conditions and amount of fuel. Fuels at lower elevations will dry out earlier than fuels at a higher elevation due to higher temperature. In extremely high elevations there may be no fuel.
Therefore, low elevation areas are more prone to fire due to higher temperature and less precipitation (Veblen et al., 2000; Harmon, 1982).
Human Activities
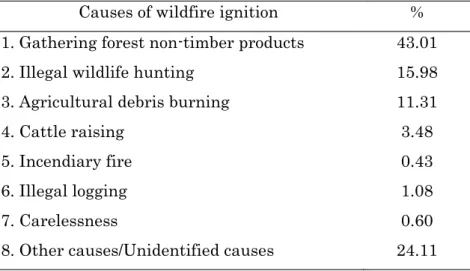
Human activity is the primary cause of wildfires in terms of the probability of ignition and combustion, though it does not influence the behavior of wildfire. Most fires caused by humans are accidental. Accidental fires in forests are usually caused by carelessness or inattention. Some are intentionally set by arsonists. An important cause of wildfire ignition in Thailand is human activity on the part of people living in areas surrounding the forests and visitors traveling through national parks (Table 2.1). The most frequent cause of wildfire ignition, accounting for 43.01% of fires, is the collection of non-timber forest products from forest areas by local people in pursuit of their livelihoods. The second most frequent is unidentified causes associated with campers, hikers or others traveling through the forest, followed by illegal hunting (15.98 %). Even if hunting wildlife is prohibited in forest protected areas, there are still some people, especially local people living in or near the forests, who hunt wildlife for their livelihood.
These people use fire to flush out wildlife. Another important cause is the burning of agricultural debris by farmers (11.31%). Burning debris in agricultural lands can cause fires to spread to nearby forests accidentally. Since most wildfires are ignited as a result of human activity and behavior, these anthropogenic sources should be considered as a wildfire factor. Anthropogenic factors which are important variables influencing fire occurrences are represented by factors such as distance from roads and proximity to settlements (Avila-Flores et al., 2010).
Table 2.1 Causes of wildfire ignition in Thailand (Forest Fire Control Division, 2011) Causes of wildfire ignition %
1. Gathering forest non-timber products 43.01
2. Illegal wildlife hunting 15.98
3. Agricultural debris burning 11.31
4. Cattle raising 3.48
5. Incendiary fire 0.43
6. Illegal logging 1.08
7. Carelessness 0.60
8. Other causes/Unidentified causes 24.11
Distance from roads is an indicator of accessibility to the forest. Forests located near roads are more prone to disturbance than forests located in remote areas which are not easily accessible (Laurance et al., 2009; Nepstad, 2001). This is because roads provide
a transportation route leading to increased human activity and thus roads inside and surrounding the forest provide more opportunities for accidental or man-made fires.
The second factor identified as an anthropogenic causative factor is proximity to settlements. Forest areas near to settlements are more prone to fire ignition because accidental fires can be caused by residents inside the forest through day-to-day or cultural practices (Jaiswal et al., 2005).
In accordance with the reviewed literature, the factors considered in this research that influence wildfire occurrence include leaf fuel load, soil moisture, slope, aspect, elevation, distance from roads and proximity to settlements. These factors are used as inputs into wildfire risk assessments for mapping the wildfire risk of recreational areas in the national park.
2.3 Wildfire Risk Assessment
A risk assessment is conducted when predicted outcomes are uncertain, but possible outcomes can be described and their likelihoods can be estimated (Haynes and Cleaves, 1999). Typically, risk analysis concerns the measurement and communication of uncertain future events with extreme consequences (Brillinger, 2010). In addition, Sikder et al. (2006) consider risk assessments as decision support tools that integrate information regarding the likelihood and magnitude of the resource response to risk factors, in order to synthesize a conclusion about risk that can inform decision-making.
Thus, it can be said that risk assessment is the process of estimating the likelihood and magnitude of the occurrence of an unwanted and adverse effect. The risk assessment is also generally used to describe the potential for loss, determined from estimates of likelihood and associated outcomes. Analysis of risk can help scientists and managers better understand the issues and can serve as a decision support tool regarding the timing, location and potential effects that might occur in future events. Wildfire risk, therefore, is the chance that a fire might start in wild lands or forests, as affected by the nature and incidence of causative factors. Assessing wildfire risk therefore requires the likelihood of wildfire to be analyzed by intensity level, so that the magnitude of potential beneficial and adverse effects to valued resources from fire can be assessed at different intensity levels (Finney, 2005). Bachmann and Allgower (2000) have
terms of probability and outcome, but also considers issues of wildfire occurrence, wildfire behavior, and wildfire effects. Therefore, the concept of risk assessment is
fundamentally related to the factors influencing wildfire occurrence and behavior.
These factors can be used not only to evaluate potential wildfire areas but also to identify, quantify, and prioritize the different intensity classes of the risk.
2.4 Remote Sensing Data and GIS
In the context of wildfire risk assessment at a landscape level, remote sensing and GIS are appropriate techniques for providing a large-scale geospatial assessment of the wildfire risk potential. Application of remote sensing and GIS techniques for wildfire risk mapping is increasingly recognized as a technique for sustainable management of forest resources and recreational areas in national parks. Therefore, understanding remote sensing and GIS concepts is important in order to apply them to assessing wildfire risk over wide areas.
2.4.1 General Concepts of Remote Sensing
Remote sensing, also called EO, is the technique of observing and analyzing objects
them. There are numerous books devoted to remote sensing, dealing with the general background to remote sensing and its applications (Cracknell and Hayes, 2007; Gibson and Power, 2000; Barrett and Curtis, 1992; Colwell, 1983; Swain and Davis, 1979).
Remote sensing activities include recording, processing, analyzing, interpreting and finally obtaining useful information from the data in the form of images usually generated from sensors on platforms (satellites and aircraft). Remote sensing
regions of the electromagnetic spectrum. Remote sensing systems can be categorized as using active or passive sensors (Figure 2.7). Active sensors provide their own energy source for illumination. For example, a radar sensor sends out sound waves and records the reflected waves coming back from the surface. Advantages of active sensors include the ability to obtain measurements whenever they are required. Passive sensors, on the other hand, need an external energy source. These sensors measure reflected light that was emitted from the sun. They detect sunlight radiation reflected from the Earth and thermal radiation in the visible and infrared parts of the electromagnetic spectrum.
These sensors do not emit their own radiation, but receive natural light and thermal radiation from the Earth's surface. Most passive sensors make use of a scanner for imaging, e.g., Landsat and moderate-resolution imaging spectroradiometer (MODIS) sensors.
Figure 2.7 Types of remote sensors (a) active remote sensing and (b) passive remote sensing (source: Canada Centre for Remote Sensing-CCRS)
Equipped with spectrometers they measure signals in several spectral bands simultaneously, resulting in so-called multispectral images which allow numerous interpretations (Albertz, 2007). Passive systems are therefore much more common than active systems.
Passive systems used in remote sensing applications operate in the visible, infrared, thermal infrared, and microwave portions of the electromagnetic spectrum. These wavelength intervals in the electromagnetic spectrum (bands) are usually used to interpret remote sensing data. Of these, the red ( RED: 0.6-0.7 µm) and near-infrared (NIR) ( NIR: 0.75-1.35 µm) bands have been found to be the most relevant for remote sensing of vegetation (Myneni et al., 1995). Compressing spectral bands into VIs is more effective for the interpretation of remotely sensed data than using reflectance from individual spectral bands.
VIs are mathematical functions calculated from the ratio, difference, ratio difference and sum of the reflectances of two bands (Jackson and Huete, 1991). They are designed to enhance the contribution of vegetation properties and allow reliable spatial and temporal comparisons of terrestrial photosynthetic activity and canopy structural variations (Bannari et al., 1995). Such indices are not only used for vegetation analysis but can also be applied for wildfire analysis. Some VIs have been applied to wildfire assessment. For instance, Escuin et al. (2008) studied the capacity of the NDVI and the normalized burn ratio (NBR) derived from Landsat TM/ETM to enable fire severity assessment. They found that both indices were suitable for discriminating between fire severity levels. Chuvieco et al. (2004) combined NDVI and surface temperature to
obtain an estimate of live fuel moisture content for forest fire danger ratings. The results showed that using NDVI and surface temperature together with data on the seasonal trends of fuel moisture content and vegetation types can provide an empirical model which enables the spatial estimation of fuel moisture content to be derived.
Moreover, Chafer et al. (2004) used different images of NDVI to define six fire severity classes and found that NDVI values produced a high-accuracy classification. Therefore, applying VIs for wildfire risk assessment is likely to be an effective technique in spatial mapping of wildfire factors computed from VIs, (i.e., leaf fuel load and soil moisture).
2.4.2 General Concepts of GIS 2.4.2.1 Definitions of GIS
A GIS is a set of tools for collecting, storing, retrieving, transforming and displaying spatial data from the real world for a particular set of purposes (Burrough, 1986). In addition, a GIS is an organized collection of computer hardware, software, geographic data and personnel, designed to efficiently capture, store, update, manipulate, analyze, and display all forms of geographically referenced information (ESRI, 1990). A GIS is defined by Young (1986) as a method of storing and retrieving data which are held in a structured form, have a location identifier and can therefore be manipulated and mapped in variety of ways. In essence, a GIS is a computer system for capturing, storing, querying, analyzing, and displaying geospatial data (Chang, 2014).
2.4.2.2 Data and Spatial Data Model
Data types in GIS can be classified into two main categories: 1) spatial data used for describing the absolute and relative location of geographic features and 2) attribute data or non-spatial data used for describing the characteristics of the spatial features.
The spatial data, also known as geospatial data, describe both the location and the attributes of spatial features. This means that spatial data in a GIS give information about a physical object that is identified as features and boundaries with a geographic location and represented by numerical values in a geographic coordinate system.
A model is simply a means of representing reality, and spatial data models provide abstractions of spatially referenced features in the real world (Lloyd, 2010). A model of spatial features explains how spatial objects and spatial phenomena are related. The most common form of model, used for representation of real-world objects or phenomena associated with a location on the Earth, is the map. Spatial data can represent real-
world features with discrete boundaries as well as real-world phenomena with non- discrete boundaries. In general, spatial data can be stored and analyzed in vector and raster models. A vector data model uses the geometric objects points, lines and polygons to represent spatial features with a clarified spatial location and boundary. Each feature is assigned an ID so that it can be associated with its attributes. Furthermore, the vector data model uses a two-dimensional Cartesian (x, y) coordinate system to store the shape of a spatial feature.
The raster data model, on the other hand, uses a grid and grid cells to represent spatial features. A matrix of cells (or pixels) is organized into rows and columns (or a grid) where each cell contains a value representing information. Thus, points can be represented by single cells, lines by sequences of neighboring cells, and polygons by collections of contiguous cells. Data stored in a raster format representing real-world phenomena consist of: 1) thematic data representing discrete objects that have known and definable boundaries and 2) continuous data, representing phenomena in which the value at each cell location is measured from a fixed registration point. The main difference between vector and raster data is that raster data have spatial resolution.
The spatial resolution of the raster data set is determined by the size or resolution of individual grid cells. For instance, Landsat satellite image data are raster data with cell sizes of 30m x 30m.
Thus, a GIS data model is a conceptual description of how spatial data are organized for use by the GIS. Combining vector and raster data, i.e., the two different ways of representing spatial data, can create a rich set of informative maps.
2.5 Integrating Remote Sensing and GIS for Wildfire Risk Assessment
Remote sensing and GIS are complementary technologies that, when combined, enable improved monitoring, mapping, and management of forest resources (Franklin, 2001). The integration of the two technologies can efficiently manipulate, spatially analyze and display landscape variables which can support the management of wildfires, (e.g., Chuvieco and Congalton, 1989; Ambrosi et al., 1998; Kuntz and Karteris, 1995). Likewise, these technologies can be used as an effective and powerful method for developing decision support systems for planners or decision makers concerned with wildfire.
With respect to wildfire risk assessment, the combination of remote sensing and GIS techniques has been applied to enhance and develop wildfire risk models and wildfire risk classification maps. Typically, both techniques have been used to analyze wildfire
risk through mathematical modeling for generating wildfire risk classification maps.
Firstly, remote sensing imagery needs to be converted into tangible information which can be utilized in conjunction with other data sets, often within a widely used GIS (Blaschke, 2010). For inputting spatial data in GIS, the resource information must be in the form of a map, hence the mapping of the thematic layers is one of the primary requirements. This means that remote sensing is the primary source for many kinds of thematic data critical to GIS analyses for generating resource maps. In a GIS database, all features must be accurately positioned. Later, all data layers from remotely sensed and GIS data should be correctly georeferenced to a map projection and coordinate system. Finally, these layers are considered as different layers of information in an integrated analysis, using mathematical functions in order to create a specific and useful model and map.
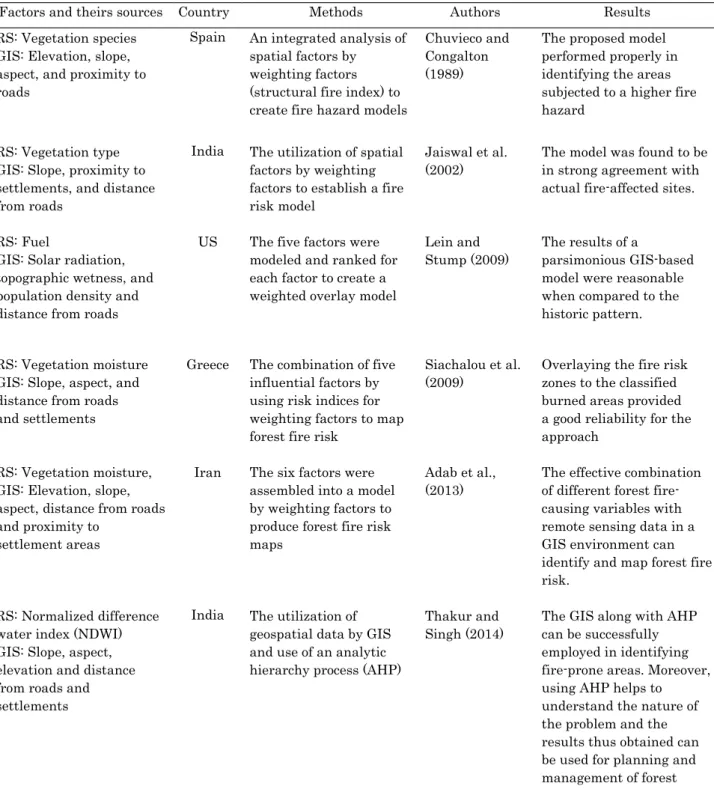
A large number of studies have been carried out using remote sensing and GIS techniques for wildfire risk assessment, as shown in Table 2.2. Based on this table, factors influencing wildfire are produced from remote sensing and GIS data, and are created in different layers and overlaid using many mathematical methods to classify wildfire risk. Therefore, in this research, remote sensing is used as a source of information on leaf fuel load and soil moisture factors, and GIS is used to provide information on other factors such as slope, aspect, elevation, distance from roads and proximity to settlements. Subsequently, GIS processing makes it possible to create wildfire risk models using mathematical functions. For the remote sensing and GIS analysis in this research, ERDAS IMAGINE 9.1 software is used for remote sensing processing and ArcGIS 10.4 software is used for GIS processing.
2.6 Overall Conceptual Framework of the Research
This research sets out to assess and classify wildfire risk in Sri Lanna national park and thereby evaluate the risk at recreation sites in this park. The conceptual definition of a wildfire risk assessment should include the most relevant factors associated with wildfire. Factors chosen for the study are widely recognized as crucial for wildfire occurrences. These factors, especially leaf fuel load and soil moisture, are analyzed using remote sensing data, and subsequently all factors are overlaid using a pairwise comparison matrix to model the wildfire risk classification. Finally, a map produced from this model is used to evaluate recreation sites with respect to wildfire. Figure 2.8 shows the structured methodology applied in the various chapters of the research.
Table 2.2 Previous studies that have used remote sensing (RS) and GIS for assessing wildfire risk
Factors and theirs sources Country Methods Authors Results
RS: Vegetation species GIS: Elevation, slope, aspect, and proximity to roads
Spain An integrated analysis of spatial factors by weighting factors (structural fire index) to create fire hazard models
Chuvieco and Congalton (1989)
The proposed model performed properly in identifying the areas subjected to a higher fire hazard
RS: Vegetation type GIS: Slope, proximity to settlements, and distance from roads
India The utilization of spatial factors by weighting factors to establish a fire risk model
Jaiswal et al.
(2002)
The model was found to be in strong agreement with actual fire-affected sites.
RS: Fuel
GIS: Solar radiation, topographic wetness, and population density and distance from roads
US The five factors were modeled and ranked for each factor to create a weighted overlay model
Lein and Stump (2009)
The results of a
parsimonious GIS-based model were reasonable when compared to the historic pattern.
RS: Vegetation moisture GIS: Slope, aspect, and distance from roads and settlements
Greece The combination of five influential factors by using risk indices for weighting factors to map forest fire risk
Siachalou et al.
(2009)
Overlaying the fire risk zones to the classified burned areas provided a good reliability for the approach
RS: Vegetation moisture, GIS: Elevation, slope, aspect, distance from roads and proximity to
settlement areas
Iran The six factors were assembled into a model by weighting factors to produce forest fire risk maps
Adab et al., (2013)
The effective combination of different forest fire- causing variables with remote sensing data in a GIS environment can identify and map forest fire risk.
RS: Normalized difference water index (NDWI) GIS: Slope, aspect, elevation and distance from roads and settlements
India The utilization of geospatial data by GIS and use of an analytic hierarchy process (AHP)
Thakur and Singh (2014)
The GIS along with AHP can be successfully employed in identifying fire-prone areas. Moreover, using AHP helps to understand the nature of the problem and the results thus obtained can be used for planning and management of forest resources.
MODIS (MOD11A2)
Leaf Biomass (LB) estimated from VIs
NDVI, SAVI, EVI2, RVI, DVI,
NDWI and CVI
Seasonal LB or Seasonal VIs (LBnor - LBdry) or
(VInor - VIdry)
Linear Model of Leaf Fuel Load
NDVI and NDWI
NDDI
LST (Fusion of MODIS and Landsat 8 Surface Temperature)
TVDI
Map of Estimated Soil Moisture Linear Model of
Soil Moisture
Field Soil Moisture Field LB
Field Leaf Fuel loads Validation
Map of Estimated Leaf Fuel Loads
Validation
Validation
Chapter 4 Chapter 5
Leaf Fuel Loads Soil Moisture
Slope Aspect Elevation Distance from roads Proximity to settlements Factors Influencing Wildfire
dNBR NBRnor NBRdry
Landsat 8 OLI
Rating Wildfire Sensitive Scores
Weighting Factors (The pairwise comparison)
GIS-based Wildfire Risk Model Validation
Wildfire Risk Map
Evaluating Recreation sites on Wildfire Recreation sites
Chapter 6
Linear Regression
Linear Regression
Field Fuel Moisture
Remote Sensing Analysis Remote Sensing Analysis
DEM
Pre-processing Landsat 8 OLI/TIRS
Pre-processing
Figure 2.8 Overall conceptual framework of wildfire risk assessment at recreational areas