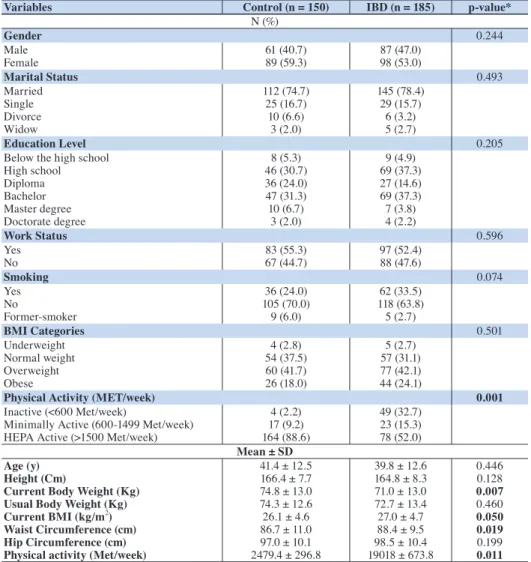
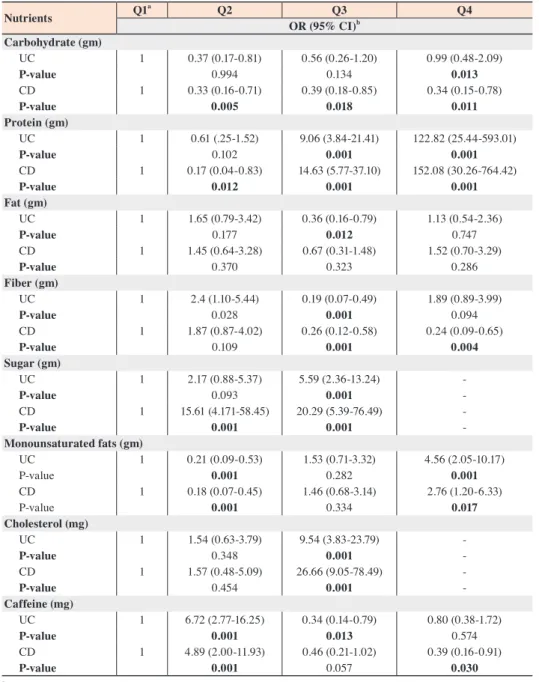
Nutrients Consumed by the Inflammatory Bowel Disease Jordanian Patients
8
0
0
全文
図

関連したドキュメント
Background The aim of the present study was to clarify the risk factors of several types of arteriosclerosis lesions in Japanese individuals with heterozygous
To confirm the relationship between the fall risk assess- ment items and risk factors assumed in this study (to sta- tistically confirm component items of each risk factor),
Recent progress in the etiopathogenesis of pediatric biliary disease, particularly Caroli's disease with congenital hepatic fibrosis and biliary atresia.
To investigate whether defects in the SPATA17 gene are associated with azoospermia due to meiotic arrest, a mutational analysis was conducted, in which the SPATA17 coding regions
Although corticosteroid therapy ameliorated the acute inflammatory pericardial in- volvement in this case, we will carefully monitor the patient for constrictive pericarditis or
Conclusions: Past reported cases of situs inversus and cystic kidney diseases were divided into three groups, i.e., gestational lethal renal dysplasia group, infantile or
The significant effect of orally administered glutamine on the histological change in the liver and regeneration of small bowel mucosa illustrates that glutamine
Methods: IgG and IgM anti-cardiolipin antibodies (aCL), IgG anti-cardiolipin-β 2 glycoprotein I complex antibody (aCL/β 2 GPI), and IgG anti-phosphatidylserine-prothrombin complex
