202
YEAR BOOK 2011Economy Analysis and Statistics Division, Directorate for Science, Technology and Industry, OECD
Hélène Dernis
Hélène Dernis is a statistician in the Directorate for Science, Technology and Industry at the OECD. She has been responsible for the creation of a database on patents and contributed to methodological studies, within the framework of the OECD Patent Project. She is now responsible for the development of a micro-data infrastructure to which patent and trademark data are a central element.
Economy Analysis and Statistics Division, Directorate for Science, Technology and Industry, OECD
Ryo Funakoshi
Ryo Funakoshi is an administrator in the Directorate for Science, Technology and Industry at the OECD since 2010. Before the OECD, he was a patent examiner in the Japan Patent Office and was also in charge of research of technological trends in Patent Applications and planning policy for Industrial Property Digital Library (IPDL).
The Organisation for Economic Co-operation and Development (OECD) launched a project on patent statistics in the late 1990s, aiming at developing a statistical infrastructure for patents. The objectives of the project are 1) to set up a database for patent statistics, 2) to establish methodologies for building patent-related statistics, and 3) to improve quality of patent statistics indicators.
I n t h i s f r a m e w o r k , t h e O E C D , i n 2 0 0 2 , established the Patent Statistics Task Force whose members are European Commission (EC), European Patent Office (EPO), EUROSTAT, Japan Patent Office (JPO), Korean Intellectual Property Office (KIPO1), National Science
Foundation (NSF), United States Patent and Trademark Office (USPTO) and World Intellectual Property Organization (WIPO).
In order to develop a common international database for building patent statistics, the EPO, one of the task force members, developed a new database suitable for statistical analysis, with the support of the OECD. The first edition of the Worldwide Patent Statistical Database, also known as PATSTAT, was released in April 2006. Since then, the OECD patent statistics mainly rely on PATSTAT data. However, before 2006, as there was no common patent database for statistical analysis, the OECD had built its own database which consisted of DOCDB and Epoline datasets distributed by the EPO.
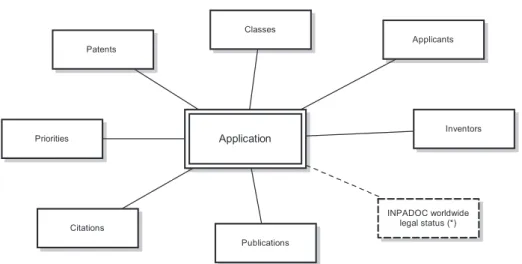
The PATSTAT2 database is released twice
a year (in April and September) and includes bibliographic data on patent filed at more than 80 patent offices worldwide. The data includes information concerning:
- Application data ●PROFILE
1
OECD work
on Patent Statistics
2
Database
for patent statistics
寄稿集
データによる分析と評価
3
- Publication data - Citation data - Family data - Applicant data - Inventor data - Classification dataAs a complement to PATSTAT, the OECD has developed four additional databases for patent statistics.
1) Triadic Patent Families3
A triadic patent family is defined as a set of patents filed at the EPO and the JPO and granted by the USPTO, to protect a same invention.
2) REGPAT4
The REGPAT database provides regional codes based on the addresses of patent applicants and inventors.
3) Citations in EP & PCT patents5
The citations database provides consolidated patent citations from the EPO and international (PCT) patents, in addition to citations to non-patent literature (NPL).
4) HAN database
T h e H A N d a t a b a s e p r o p o s e s a s e t o f harmonized patent applicant names, grouped together according to a common identifier. Each of these databases can be linked to PATSTAT for more elaborate analysis.
The OECD published a first manual “The Measurement of Scientific and Technological Activities: Using Patent Data as Science and Technology Indicators” in 1994, in the context of using patent data as a complementary science and technology indicators. Since the 1990s, the use of patent statistics for analytical purposes has increased markedly not only within OECD member countries but also in academia.
As patent statistics became more visible, concerns were raised about the comparability and the interpretation of patent statistics. Patent statistics were compiled in different ways by governments, IP offices and researchers,
3
Methodology
for Patent Statistics
Application Citations Classes Applicants Inventors Publications Patents Priorities INPADOC worldwide legal status (*)
YEAR BOOK 2011
204
innovation, workload, etc.). The methodologies behind the construction of patent statistics are essential to a better understanding of the statistics and an improved quality of the data. How to define patent families, how to count co-inventions, how to count citations are examples of issues that can be addressed.
In order to clarify these issues, the Patent Statistics Task Force agreed to compile new guidelines regarding the methodology for building and interpreting patent statistics. The OECD, with the support of the Patent Statistics Task Force and researchers interested in the
in 2009 provides methodological guidelines regarding what patent statistics can or cannot be used for, and how patents shall be counted in order to maximize information on Science and Technology activities while minimizing noise and bias.
T h e O E C D h a s d e v e l o p e d a v a r i e t y o f internationally comparable indicators on patents using different approaches – e.g. assessing the innovative performance of countries, of regions,
4
New patent indicators
Fig2. Innovation hot spots in ICT, Biotechnologies and nanotechnologies, 2006-2008 (Source: OECD, STI Scoreboard 2011)
Southern Kanto (JPN) California (USA) Tokai (JPN) Capital Region (KOR) Baden-Wuerttemberg (DEU) Bayern (DEU) Texas (USA) Nordrhein-Westfalen (DEU) Massachusetts (USA) Guangdong (CHN) New York (USA)
Île de France (FRA)
Illinois (USA) New Jersey (USA)
Zuid-Nederland (NLD) Minnesota (USA) Pennsylvania (USA) Washington (USA) South East (GBR)
North Carolina (USA)
Ontario (CAN) Chungcheong Region (KOR) West-Nederland (NLD) Maryland (USA) Hovedstaden (DNK) 1 10 100 0 0 1 0 1 1
Share of region in country's
biotechnology and nanotechnology patents (%)
Share of region in country's ICT-related patents (%) Axes in logarithmic scale
Total patents by region 1 000 patents 10 000 patents 50 000 patents Share of region in country's
biotechnology and nanotechnology patents (%)
Share of region in country's ICT-related patents (%) Axes in logarithmic scale
Total patents by region 1 000 patents 10 000 patents 50 000 patents
寄稿集
データによる分析と評価
3
of firms; the innovative activity in selected technology domains; the co-operation in S&T activities, etc. Some examples are presented
hereafter. The OECD coordinates the organization of
patent statistics conferences and workshops
5
Patent Statistics
Conference and Workshop
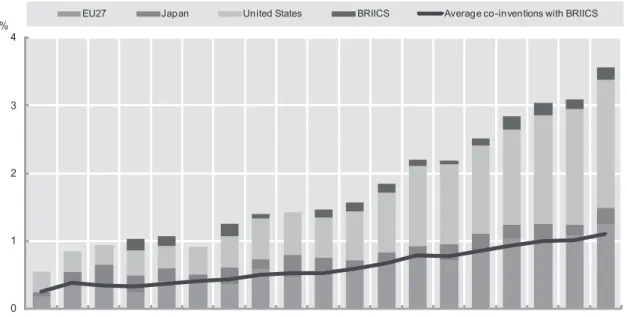
Fig4. Patents and Trademarks per capita, 2007-2009 (Source: OECD, STI Scoreboard 2011) Fig3. Co-inventions with BRICS countries, 1991-2009 (Source: OECD, STI Scoreboard 2011)
0 1 2 3 4 1991 1992 1993 1994 1995 1996 1997 1998 1999 2000 2001 2002 2003 2004 2005 2006 2007 2008 2009 % EU27 Japan United States BRIICS Average co-inventions with BRIICS
ARG AUS AUT BEL BRA BRIICS CAN CHE CHL CHN CZE DEU DNK ESP EST EU27 FIN FRA GBR GRC HUN IND IRL ISL ISR ITA JPN KOR LUX MEX NLD NOR NZL OECD POL PRT RUS SAU SVK SVN SWE TUR USA ZAF 0 1 10 100 0 0 1 0 1 1 0
Triadic patent families per capita Trademarks abroad per capita
500
500
IDN
YEAR BOOK 2011
206
in 2003, with the support of the WIPO. From 2005 to 2010, the EPO organised the annual conference on patent statistics for decision makers in Vienna and Venice (2007). The 2011 event will be held in Alexandria (US) with the support of the USPTO. The annual patent statistics conference aims to gather researchers, industries and IP offices in order to discuss patent related issues, new data and new methodology and relevant policy issues related to patents.
In parallel, workshops have been organized by the OECD to discuss specific issues such as the typologies of patent families, the harmonization of patent applicant names, and, more recently, the development of trademarks statistics.
C o n f e r e n c e s a n d w o r k s h o p s o n p a t e n t statistics are typically the place where new methodological development, new statistics and new data emerge.
For further information on the OECD patent-related analysis and access to the OECD patent statistics, please refer to the OECD web site at : www.oecd.org/sti/ipr-statistics
<Annotation>
1. KIPO joined in Patent Statistics Task Force in 2010.
2. See EPO’s web site for details.
http://www.epo.org/searching/subscription/ raw/product-14-24.html
Working Paper 2004/2, Statistical Analysis of Science, Technology and Industry”
4. See “Stéphane Maraut, Hélène Dernis, Colin Webb, Vincenzo Spiezia and Dominique Guellec, THE OECD REGPAT DATABASE: A Presentation, STI Working Paper 2008/2, Statistical Analysis of Science, Technology and Industry”
5. See “Webb.C, H.Dernis, D.Harhoff and L.Hoisl, Analysing European and International Patent Citations: A set of EPO Patent Database Building Blocks”, STI Working Paper 2005/9”
寄稿集
データによる分析と評価
3
OECD(経済協力開発機構)は、1990 年代後半に 特許統計のインフラ発展を目指し、特許統計に関するプ ロジェクトを立ち上げた。そのプロジェクトの目的は、 1)特許統計用のデータベースを設けること、2)特許 統計の方法論を確立すること、3)特許統計の指標の質 を向上させること、である。 この枠組みの中で、OECD は 2002 年に、特許統計 タスクフォースを設立した。タスクフォースメンバー は、欧州委員会(EC)、 欧州特許庁(EPO)、欧州連合 統計局(Eurostat)、日本特許庁(JPO)、韓国特許庁 (KIPO1),米国国立科学財団(NSF)、米国特許商標庁 (USPTO)、世界知的所有権機関(WIPO)である。 共有で且つ国際的な特許統計用のデータベースを開 発するため、特許統計タスクフォースメンバーの一員で ある EPO は OECD の協力のもと、統計分析に適する 新しいデータベースを開発した。そして PATSTAT と して知られるワールドワイドな特許統計データベース の第 1 版が 2006 年 4 月にリリースされた。それ以 降、OECD の特許統計は PATSTAT を用いることが 主流である。しかしながら、2006 年以前は、共有の 統計分析用の特許データベースは存在していなかった。 そのため、OECD は EPO が提供している DOCDB と Epoline のデータから成る自前のデータベースを構築 し、それを利用していた。 PATSTAT は年に2回(4 月と9月)リリースされ、 80以上の特許庁の書誌情報を含んで成る。これらの書 誌情報は、 -出願データ -公報データ -引用データ -ファミリーデータ -出願人データ -発明者データ -分類データ などから構成される。 OECD では、PATSTAT を補足するものとして、4 つの特許統計用の付加的データベースを開発している。 1)Triadic Patent Families2ここでの三極ファミリーの定義は、同じ発明を保護 するために、EPO と JPO に出願されたものであって、 USPTO で特許になった一連の特許出願と定義してい る。 2)REGPAT3 REGPAT は出願人の住所と発明者の住所の各々に地
2
特許統計用データベース
1
OECD の特許統計に対する
取り組み
OECDの特許統計に対する取り組み(和訳)
経済協力開発機構 科学技術産業局経済分析統計課Hélène Dernis
OECD 科学技術産業局の統計専門官。OECD 特許プロジェクトにおいて、特許に関するデータベースの構築および 方法論の研究に従事している。現在は特許と商標を中心としたマイクロデータのインフラ開発に力を注いでいる。 経済協力開発機構 科学技術産業局経済分析統計課船越 亮
2001 年に特許庁入庁。情報分野の特許審査、特許出願動向調査の担当、IPDL(特許電子図書館)の企画担当、ケ ンブリッジ大学客員研究員などを経て、2010 年より OECD に出向。YEAR BOOK 2011
208
域コードを付与したものである。 3)Citations in EP & PCT patents4
このデータベースは、EPO 出願および国際的出願 (PCT)における引用文献を収集しており、特許文献だ けでなく非特許文献も含まれている。 4)HAN database HAN データベースは名寄せされた一連の特許出願人 名であり、共通の識別子によりグループ化されている。 いずれのデータベースもより詳細な分析のために、 PATSTAT とリンクを図ることが可能である。
OECD は 最 初 の マ ニ ュ ア ル“The Measurement of Scientific and Technological Activities: Using Patent Data as Science and Technology Indicators”を 1994 年に発行した。このマニュアル では、科学技術指標を補足するものとして、特許データ の利用が取りあげられていた。そして 1990 年代以降、 分析を目的とした特許統計の利用は、OECD 加盟国だ けではなく、大学においても飛躍的に増加した。 特許統計が普及する一方で、特許統計データの比較性 および解釈についての関心事が提起された。これは、特 許統計が、各政府、各特許庁、そして研究者の分析軸 (R&D のアウトプットを測定するために特許をカウン トするのか、イノベーションを測定する目的なのか、そ れとも、ワークロードを測定する目的なのか、等々)に より異なる手法で収集されたことによる。特許統計を解 釈する際の背景にある方法論には統計に対する理解と データの質向上が不可欠である。パテントファミリーを どのように定義するのか、共同発明者の場合は発明者を どのようにカウントするのか、引用文献が複数ある場合 は引用文献をどのようにカウントするのか、などは提起 された例の一例である。 これらの論点を明らかにするため、特許統計タス クフォースは特許統計の構築と解釈に向けた方法論に 関する新しいガイドラインを編集することに同意し た。OECD は、特許統計タスクフォース及びその分 野の研究者の協力のもと、前述したマニュアルを大々 的に改訂した。そして、2009 年に”OECD Patent Statistics Manual”が発行された。このマニュアルは、 何に対して特許統計を利用することが可能であり、何に 対しては利用されないのか、そして、ノイズやバイアス を最小限にする一方で、科学技術に関する情報を最大化 するために、どのように特許をカウントするべきか等に ついて、方法論的な指針を示している。 Application Citations Inventors Publications Priorities INPADOC worldwide legal status (*)
図 1 PATSTAT の概要(出典:PATSTAT April 2011)
寄稿集
データによる分析と評価
3
OECD は様々なアプローチに基づいて、国際的に比 較可能な特許指標を幅広く創出している。たとえば、各 国、各地域、各企業のイノベーティブなパフォーマンス を評価するための指標、特定の科学技術領域でのイノ ベーティブなパフォーマンスを評価するための指標、科 学技術領域における共同活動を評価するための指標、等 である。以下にその例を示す。4
特許に関する新しい指標
OECD はタスクフォースメンバーと共催で、世界中 で特許統計カンファレンスとワークショップを開催して いる。最初は WIPO の協力のもと、2003 年にジュネー ブで開催した。2005 年から 2010 年は毎年、EPO がウィーンとベネチア(2007 年)において、政策立 案者を対象としたカンファレンスを開催した。2011 年は USPTO の協力のもと、アレキサンドリア(米国) で開催される予定である。特許統計カンファレンスの目 的は大学、産業界、各特許庁を一同に集め、特許に関連 した問題、新しいデータや方法論、そして特許に関連し た政策について議論をすることである。またカンファレ ンスと並行して行われる OECD 開催のワークショップ 図 2 ICT、バイオテクノロジー、ナノテクノロジー分野におけるイノベーションホットスポット、2006-2008 (出典:OECD STI Scoreboard2011)Southern Kanto (JPN) California (USA) Tokai (JPN) Capital Region (KOR) Baden-Wuerttemberg (DEU) Bayern (DEU) Texas (USA) Nordrhein-Westfalen (DEU) Massachusetts (USA) Guangdong (CHN) New York (USA)
Île de France (FRA)
Illinois (USA) New Jersey (USA)
Zuid-Nederland (NLD) Minnesota (USA) Pennsylvania (USA) Washington (USA) South East (GBR)
North Carolina (USA)
Ontario (CAN) Chungcheong Region (KOR) West-Nederland (NLD) Maryland (USA) Hovedstaden (DNK) 1 10 100 0 0 1 0 1 1
Share of region in country's
biotechnology and nanotechnology patents (%)
Share of region in country's ICT-related patents (%) Axes in logarithmic scale
Total patents by region 1 000 patents 10 000 patents 50 000 patents Share of region in country's
biotechnology and nanotechnology patents (%)
Share of region in country's ICT-related patents (%) Axes in logarithmic scale
Total patents by region 1 000 patents 10 000 patents 50 000 patents
YEAR BOOK 2011
210
では、パテントファミリーの類型、出願人名の名寄せ、 そして最近では商標統計の開発についての議論を行って いる。
図 3 Brics との共同発明、1991-2009(出典:OECD STI Scoreboard2011)
0 1 2 3 1991 1992 1993 1994 1995 1996 1997 1998 1999 2000 2001 2002 2003 2004 2005 2006 2007 2008 2009 特許統計に関するカンファレンスとワークショップ は、新しい方法論の開発、新しい統計、新しいデータが 創出される場所となっている。
図 4 各国一人当たりの特許出願と商標出願、2007-2009(出典:OECD STI Scoreboard2011)
ARG AUS AUT BEL BRA BRIICS CAN CHE CHL CHN CZE DEU DNK ESP EST EU27 FIN FRA GBR GRC HUN IND IRL ISL ISR ITA JPN KOR LUX MEX NLD NOR NZL OECD POL PRT RUS SAU SVK SVN SWE TUR USA ZAF 0 1 10 100 0 0 1 0 1 1 0
Triadic patent families per capita Trademarks abroad per capita
500
500
IDN
寄稿集
データによる分析と評価
3
OECD の特許分析についての詳細な情報、OECD の 特許統計にアクセスするためには、OECD のウエブサ イトを訪問してください。 www.oecd.org/sti/ipr-statistics<注釈>
1. 2010 年に KIPO が特許統計タスクフォースとし て参加した。 2. 詳細は EPO のウエブサイトを参照。 http://www.epo.org/searching/subscription/ raw/product-14-24.html3. “Hélène Dernis and Mosahid Khan, Triadic Patent Families Methodology, STI Working Paper 2004/2, Statistical Analysis of Science, Technology and Industry”を参照。 4. “Stéphane Maraut, Hélène Dernis, Colin
Webb, Vincenzo Spiezia and Dominique Guellec, THE OECD REGPAT DATABASE: A Presentation, STI Working Paper 2008/2, Statistical Analysis of Science, Technology and Industry”を参照。
5. “Webb.C, H.Dernis, D.Harhoff and L.Hoisl, Analysing European and International Patent Citations: A set of EPO Patent Database Building Blocks”, STI Working Paper 2005/9” を参照。