Abbreviations: BMI, body mass index; BP, blood pressure; DECODA, Diabetes Epidemiology: Collaborative analysis Of Diag-nostic criteria in Asia; DECODE, Diabetes Epidemiology: Collaborative analysis Of DiagDiag-nostic criteria in Europe; DM, diabetes mellitus; FPG, fasting plasma glucose; IFG, impaired fasting glucose; IGT, impaired glucose tolerance; OGTT, oral glucose toler-ance test; ROC, receiver operating characteristic; WHO, World Health Organization
Screening Criteria of Diabetes Mellitus and
Impaired Glucose Tolerance of the Japanese Population
in a Rural Area of Japan: The Tottori-Kofu Study
Tsuyoshi Ohkura, Shin-ichi Taniguchi, Kazuoki Inoue, Naoya Yamamoto, Kazuhiko Matsuzawa, Youhei Fujioka, Keisuke Sumi, Shoichiro Izawa, Mikio Takechi*, Yoneatsu Osaki† and Chiaki Shigemasa
Division of Molecular Medicine and Therapeutics, Department of Multidisciplinary Internal Medicine, School of Medicine, Tottori University Faculty of Medicine, Yonago 683-8504, *Ebi Clinic, Kofu 689-4401, †Division of Environmental and Preventive Medicine, Department of Social Medicine, School of Medicine, Tottori University Faculty of Medicine, Yonago 683-8503 Japan
We performed the Tottori-Kofu Study to develop an early detection method of the Japa-nese with diabetes mellitus (DM) and impaired glucose tolerance (IGT), using simple pre-dictors such as fasting plasma glucose (FPG) and other risk information obtainable from basic medical check-ups. In 2005, 734 residents of Kofu Town received a basic medical check-up including blood examination. Some of them meeting the following criteria fur-ther underwent the oral glucose tolerance test (OGTT): 5.5 mmol/L (100 mg/dL) ≤ FPG < 7.0 mmol/L (126 mg/dL); or FPG < 5.5 mmol/L, HbA1c ≥ 5.5%, BMI ≥ 25 kg/m2, triglycer-ide ≥ 1.69 mmol/L (150 mg/dL), hypertension treatment and family history of DM. Among the 734, only 4 persons with FPG ≥ 7.0 mmol/L were newly diagnosed as having DM, and 17 persons with FPG ≥ 6.1 mmol/L (110 mg/dL) were diagnosed with impaired fasting glu-cose. Among 220 persons who received the OGTT, 115 had normal glucose tolerance, 85 had IGT and 20 had DM. When the above-mentioned criteria were added to FPG levels, additional 67 persons with abnormal glucose tolerance were found. The optimal level to detect IGT and DM was 5.2 mmol/L (93 mg/dL) for FPG and 5.3% for HbA1c. Of persons only with the single risk factor of hypertension treatment, 39.3% had IGT. In conclusion, the results indicate that FPG of 5.2 mmol/L (93 mg/dL), HbA1c of 5.3% and hypertension treatment are useful in detecting early stages of IGT and DM.
Key words: diabetes; hyperetension; Japanese; risk factor
Atherosclerotic diseases such as heart disease and cerebral stroke are increasing in Japan with the aging of population in Japan and with changes of lifestyle. It is necessary to elucidate risk factors and to establish a useful and cost-benefit method to prevent the onset of diabetes mellitus (DM) and
impaired glucose tolerance (IGT). The American Diabetes Association proposed new criteria for the diagnosis of diabetes (1997). The Associa-tion recommended the diagnosis of diabetes with the fasting plasma glucose (FPG) levels and not with the oral glucose tolerance test (OGTT) in a
clinical setting, from the viewpoint of cost and convenience (Expert Committee on the Diagno-sis and Classification of Diabetes Mellitus, 1997). The use of OGTT is still emphasized for clinical diagnosis of IGT and DM in Japan. In 1999, the Japan Diabetes Society published new diagnostic criteria of diabetes, and had left the OGTT as a method of diagnosis (Kuzuya et al., 2002). The use of OGTT stems from the fact that the pathology of diabetes in Asians including the Japanese does not arise mainly from obesity and insulin resistance, as in Europeans and Americans. In Japan, half of diabetics have a genetic background, and in lean persons, insulin secretion is impaired. Therefore, it is difficult to detect diabetes in its early stages with the FPG level alone (Kadowaki et al., 1984, 1994). The DECODA Study showed that 45% of diabetics were missed when the OGTT was not performed (Qiao et al., 2000). Therefore, the World Health Organization (WHO) also has recommended the OGTT as a screening for diabetes (Alberti et al., 1998). We think it important to develop a screen-ing protocol for persons at high risk of diabetes by using a combination of FPG and HbA1c because of its simplicity.
The criteria for glucose intolerance in the ba-sic health examination of residents are established in the Law of Health and Medical Service for the Aged in Japan. The criteria recommend that medi-cal treatment is necessary in persons with FPG ≥ 7.0 mmol/L (126 mg/dL), casual plasma glucose ≥ 11.1 mmol/L (200 mg/dL) and HbA1c ≥ 6.1%. How-ever, if the test results are the following, the patient will need lifestyle guidance and will not require the intensive examination at a medical institu-tion: 6.1 mmol/L (110 mg/dL) ≤ FPG < 7.0 mmol/ L (126 mg/dL), 7.8 mmol/L (140 mg/dL) ≤ casual plasma glucose < 11.1 mmol/L (200 mg/dL), 5.5% ≤ HbA1c < 6.1%. The persons with the following results will be considered to have no abnormality: FPG < 6.1 mmol/L (110 mg/dL), casual plasma glu-cose < 7.8 mmol/L (140 mg/dL) and HbA1c < 5.5%. There have been reports that the following criteria have high sensitivity to detect diabetes in Japanese: FPG ≥7.0 mmol/L (126 mg/dL) and HbA1c ≥ 6.1% (Takahashi et al., 2000; Ito et al., 2000). However,
it has been reported that a plasma glucose level of 11.1 mmol/L (200 mg/dL) at 2 h after glucose load (2 h-LPG) was equivalent to FPG level of 5.8 mmol/ L (104 mg/dL) in Asians (Nakagami et al., 2002). Moreover, in 2003, the American Diabetes Associ-ation indicated that the cutoff level for IFG should be reduced from 110 to 100 mg/dL, and that IFG should be redefined as an FPG of 100 to 125 mg/ dL (5.6–6.9 mmol/L) (The Expert Committee on the Diagnosis and Classification of Diabetes Mel-litus, 2003). Although the criteria described above appear to be sensitive enough to detect apparent diabetes, persons with early stage diabetes or IGT may be missed.
Kofu Town is located near the Tottori Univer-sity Faculty of Medicine. The residents of Kofu Town have suffered from a 3-fold higher incidence of cerebral stroke than the national average in Japan. In order to prevent cerebral stroke events, a new program called the Tottori-Kofu Study was started in 2005. The program intends to detect high-risk persons for cerebral stroke and recruit them into early intervention protocols such as lifestyle guid-ance. Within the program, we tried to develop an effective screening method for IGT or DM, since IGT or DM are recognized as high-risk factors for stroke. The aim of this study is to develop an effec-tive and low-cost strategy for early detection of DM and IGT. This strategy utilized simple predictors including FPG, HbA1c and body mass index (BMI) from the basic examination results.
Subjects and Methods Research design and subjects
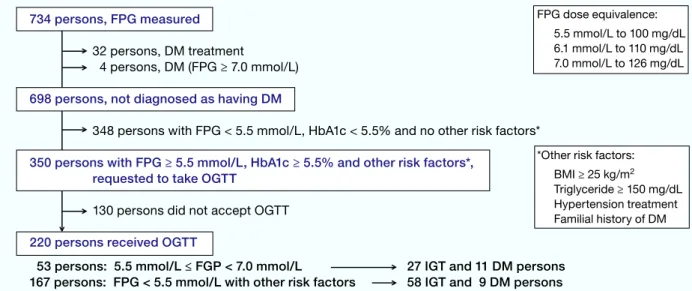
This is a cross-sectional study. The subjects were 734 residents aged 35 years or older who had un-dergone a basic medical check-up in 2005 in Kofu Town, Tottori Prefecture, Japan (Fig. 1).
Confirmation of risk factors
At the basic medical check-up for the 734 resi-dents, height, weight and blood pressure (BP) were
measured. Blood was also collected and plasma glucose, HbA1c and serum triglyceride levels were measured. Plasma glucose was measured with the glucose oxidase method, and HbA1c by high-per-formance liquid chromatography. The BMI [body weight (kg)/height2 (m2)] and serum triglyceride
levels were used to determine whether or not the persons were overweight (BMI ≥ 25 kg/m2:
high-BMI) or hypertriglyceridemic [triglyceride ≥ 1.69 mmol/L (150 mg/dL): high-triglyceride]. In addi-tion, the following history was confirmed: history of hypertension treatment and family history of diabetes in relatives within 3 degrees of kinship.
To establish the risk criteria for this study, we referred to past reports in the literature. One of the reports examined plasma glucose and HbA1c of an-other Asians, Chinese subjects. It stated that FPG ≥ 5.6 mmol/L (104 mg/dL) and HbA1c ≥ 5.5% were the most sensitive and specific (Ko et al., 1998). In Japanese persons, the risk of DM for those under 60 years of age and with BMI ≥ 25 kg/m2 is 50%
higher than for those who do not meet these condi-tions (Ito et al., 1994). When factors related to 2 h-LPG were examined, the profiles of age, BMI, triglyceride and hypertension were considered to be predictors for 2 h-LPG (Bando et al., 2001). Ac-cording to the DECODE (DECODE Study Group, 2003), DECODA (Nakagami and DECODA Study Group, 2004), Hisayama (Fujishima et al.,
1996) and Funagata (Tominaga et al., 1999) Stud-ies, the risk of a cardiovascular event in IGT was approximately 2 times higher than in the normal type. The Third National Health and Nutrition Examination Survey in the United States indicated that the IGT risk is high in those with risks such as FPG ≥ 5.5 mmol/L (100 mg/dL), age of 64 to 74 years, triglyceride ≥ 1.69 mmol/L (150 mg/dL), BMI ≥ 30 kg/m2 and hypertension (Nelson et al.,
2003). Moreover, another Japanese study reported that the familial history for hypertension, diabetes and dyslipidemia is an important aid towards a prevention strategy and public health practice for metabolic disorders (Wada et al., 2006). Based on the previous reports, we applied the OGTT for our subjects who had a risk of 5.5 mmol/L (100 mg/ dL) ≤ FPG < 7.0 mmol/L (126 mg/dL); or who had FPG < 5.5 mmol/L but had HbA1c ≥ 5.5%, BMI ≥ 25 kg/m2, triglyceride ≥ 1.69 mmol/L (150 mg/
dL), hypertension treatment or family history of DM. The number of high-risk residents of the lat-ter group was 350. However, diabetics with FPG < 5.5 mmol/L and HbA1c < 5.5% are rare, as re-ported in Chinese and Japanese population studies as only 2% of these participants was DM (Ko et al., 1998; Takahashi et al., 2001). When the BMI was less than 25, 24.9% of the sample population was diabetic (Ito, 1983). When the triglyceride level was less than 150 mg/dL, 4% of the sample population
FPG dose equivalence: 5.5 mmol/L to 100 mg/dL 6.1 mmol/L to 110 mg/dL 7.0 mmol/L to 126 mg/dL
*Other risk factors: BMI ≥ 25 kg/m2
Triglyceride ≥ 150 mg/dL Hypertension treatment Familial history of DM
Fig. 1. Cross-sectional study design for the Tottori-Kofu Study. BMI, body mass index; DM, diabetes mellitus; FPG, fast-ing plasma glucose; IFG, impaired fastfast-ing glucose; IGT, impaired glucose tolerance; OGTT, oral glucose tolerance test.
734 persons, FPG measured
32 persons, DM treatment
4 persons, DM (FPG ≥ 7.0 mmol/L)
698 persons, not diagnosed as having DM
348 persons with FPG < 5.5 mmol/L, HbA1c < 5.5% and no other risk factors*
350 persons with FPG ≥ 5.5 mmol/L, HbA1c ≥ 5.5% and other risk factors*, requested to take OGTT
130 persons did not accept OGTT
220 persons received OGTT
53 persons: 5.5 mmol/L ≤ FGP < 7.0 mmol/L 27 IGT and 11 DM persons
was diabetic (Kametani et al., 2002). According to these studies, in participants with FPG < 5.5 mmol/L, HbA1c < 5.5%, BMI < 25 kg/m2 and
trig-lyceride < 1.69 mmol/L, the percentage of DM was calculated as 2% by 25% by 4%, resulting as 0.02%. So, we did not apply the OGTT to the 348 residents with FPG < 5.5 mmol/L, HbA1c < 5.5%, BMI < 25kg/m2, triglyceride < 1.69 mmol/L, with no
fam-ily history of DM or with no hypertension treat-ment. Finally, the OGTT was performed on 220 residents of the 350, the remaining 130 refusing the test. However, there was no significant difference between the 220 performed and 130 nonperformed residents according to age, BMI, FPG, HbA1c, trig-lyceride level, SBP and DPB (unpaired t-test, data not shown).
Measurement of waist circumference is not included in a routine medical check-up under the Health and Medical Service Law for the Aged. But in this study, we decided to measure waist circum-ference to estimate the clinical relevance of waist abnormality. The diagnostic criteria of metabolic syndrome in Japan were applied to determine the abnormal waist circumference sizes as ≥ 85 cm for males and ≥ 90 cm for females (Examination Com-mittee of Criteria for ‘Obesity Disease’ in Japan, 2002).
Determination of abnormal glucose tolerance
As a secondary screening test, the 75-g OGTT was used for persons who accepted to take the test. The determination of diabetes was based on the 1998 diagnostic criteria of the WHO and with the levels of FPG and 2 h-LPG (Alberti et al., 1998). The subjects were determined to have DM if they had FPG ≥ 7.0 mmol/L (126 mg/dL) or 2 h-LPG ≥ 11.1 mmol/L (200 mg/dL). The subjects were de-termined to have IGT if they had FPG < 7.0 mmol/ L (126 mg/dL) and 7.8 mmol/L (140 mg/dL) ≤ 2 h-LPG < 11.1 mmol/L (200 mg/dL). The subjects were determined to have impaired fasting glucose (IFG) if they had 6.1 mmol/L (110 mg/dL) ≤ FPG < 7.0 mmol/L (126 mg/dL) and 2 h-LPG < 7.8 mmol/ L (140 mg/dL). Even if the subjects were normal based on the WHO criteria, if a Japanese has 1
h-LPG ≥ 10.0 mmol/L (180 mg/dL), the risk of developing diabetes is higher than those having 1 h-LPG < 10.0 mmol/L. The persons with 1 h-LPG ≥ 10.0 mmol/L should be handled as with IGT ac-cordingly (Kuzuya et al., 2002). In a recent report, the cutoff value for impaired glucose regulation was 10.1 mmol/L (182 mg/dL) for blood glucose at 60 min (Zhou et al., 2006a, 2006b). One study from the United States indicates that a high level of plasma glucose at 30 to 90 min is associated with increased cardiovascular risk factors, even in groups with normal FPG and 2 h-LPG (Modan et al., 1989). Therefore, persons with 1 h-LPG ≥ 10.0 mmol/L (180 mg/dL) were determined to have IGT. Persons not classified into either group were deter-mined to have normal glucose tolerance: their FPG was < 6.1 mmol/L (110 mg/dL), 1 h-LPG < 10.0 mmol/L (180 mg/dL) and 2 h-LPG < 7.8 mmol/L (140 mg/dL).
Statistical analysis
Data were expressed as mean ± SEM. Significance of differences in mean values was determined by using unpaired t-tests. In the logistic regression analysis, the persons determined to have IGT and DM were combined as persons with abnormal glu-cose tolerance (IGT + DM). The dependent vari-able was abnormal glucose tolerance (IGT + DM), and the explanatory variables were male, HbA1c ≥ 5.5%, high-BMI, high-triglyceride, hypertension treatment, family history of diabetes, family histo-ry of hypertension, waist abnormality and age. Bi-nomial logistic regression was performed, and the factors with significant odds ratios were obtained. Odds ratios were determined if the explanatory variables were redundant. A P value, 0.05 or less, was considered to be statistically significant.
To evaluate the DM + IGT, we determined the cutoff values from the receiver operating char-acteristic (ROC) analysis of the optimal FPG and HbA1c. The sensitivity of FPG and HbA1c cutoff points on the results of the basic medical check-up was defined as its ability to correctly identify persons who had abnormal glucose tolerance (IGT or DM) in the OGTT. The specificity was defined
as its ability to correctly identify persons who had NGT in the OGTT. To compare the ability of FPG and HbA1c measurements to detect the presence or absence of abnormal glucose tolerance (IGT or DM), we plotted ROC curves. The diagnostic properties of specific cutoff levels of FPG and HbA1c were defined by maximizing the sensitivity and specificity to identify IGT or DM. An ROC curve is a graph of sensitivity versus (1 – speci-ficity) for various cutoff definitions of a positive diagnostic test result. The optimal cutoff points were obtained from the Youden index [maximum (sensitivity + specificity – 1)], and the point on the ROC curve closest to (0,1) was calculated as the minimum value of the square root of [(1 – sensitiv-ity)2 + (1 – specificity)2] (Youden, 1950; Perkins et
al., 2006). Greater accuracy is reflected by a larger Youden index and a smaller distance to (0, 1). SPSS 15.0 (SPSS, Chicago, IL) was used for analysis.
Results
The present 734 subjects consisted of 272 males and 462 females. Their mean age was 66.4 years, mean BMI 22.7 kg/m2, mean FPG 5.07 mmol/L
(91.4 mg/d L), mean HbA1c 5.19%, mean systolic BP 127.8 mmHg, mean diastolic BP 76.0 mmHg and mean fasting triglyceride 1.16 mmol/L (103.5 mg/dL) (Table 1). From the 734, 32 persons who had already been treated for diabetes were ex-cluded. Of the 702 not treated for diabetes, only 4 persons with FPG ≥ 7.0 mmol/L (126 mg/dL) were newly diagnosed as having diabetes and only 17 persons with 6.1 mmol/L (110 mg/dL) ≤ FPG < 7.0 mmol/L, as having IFG (Table 2). As described in the Subjects and Methods, a total of 220 persons accepted the OGTT as the secondary examination. In the results of the OGTT for the 220 per-sons, mean BMI was 23.9 kg/m2, mean FPG, 5.17
mmol/L (93.0 mg/dL) and mean HbA1c, 5.20% (Table 1). Mean levels in BMI, systolic BP, diastol-ic BP and triglyceride were signifdiastol-icantly higher in the OGTT-received persons than the basic medical checked-up, but those in FPG and HbA1c were not. Among the OGTT-received persons, 115 (52.3%) had normal glucose tolerance, 85 (38.6%) had IGT and 20 (9.1%) had DM (Table 2). No person had IFG. Among 14 persons with 6.1 mmol/L (110 mg/ dL) ≤ FPG < 7.0 mmol/L (126 mg/dL), 5 persons (35.7%) had IGT and 7 persons (50%) had DM. Two persons showed normal glucose tolerance
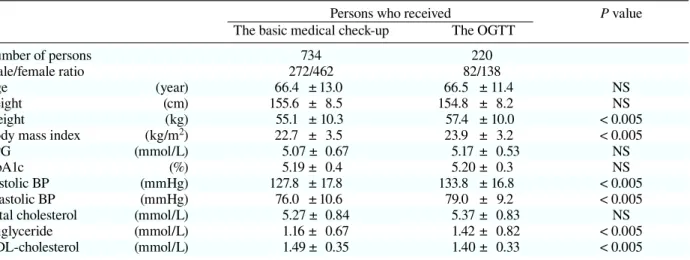
Table 1. Clinical characteristics of persons who received the basic medical check-up and the sec-ondary OGTT
Persons who received P value
The basic medical check-up The OGTT
Number of persons 734 220
Male/female ratio 272/462 82/138
Age (year) 66.4 ± 13.0 66.5 ± 11.4 NS
Height (cm) 155.6 ± 8.5 154.8 ± 8.2 NS
Weight (kg) 55.1 ± 10.3 57.4 ± 10.0 < 0.005
Body mass index (kg/m2) 22.7 ± 3.5 23.9 ± 3.2 < 0.005
FPG (mmol/L) 5.07 ± 0.67 5.17 ± 0.53 NS
HbA1c (%) 5.19 ± 0.4 5.20 ± 0.3 NS
Systolic BP (mmHg) 127.8 ± 17.8 133.8 ± 16.8 < 0.005
Diastolic BP (mmHg) 76.0 ± 10.6 79.0 ± 9.2 < 0.005
Total cholesterol (mmol/L) 5.27 ± 0.84 5.37 ± 0.83 NS
Triglyceride (mmol/L) 1.16 ± 0.67 1.42 ± 0.82 < 0.005
HDL-cholesterol (mmol/L) 1.49 ± 0.35 1.40 ± 0.33 < 0.005
Data represent mean ± SD.
P values represent results of comparison between groups of persons receiving the basic check-up and the secondary OGTT. Unpaired t-test was used for statistical analysis.
BP, blood pressure; FPG, fasting plasma glucose; HDL, high-density lipoprotein; NS, not significant; OGTT, oral glucose tol-erance test.
with FPG < 6.1 mmol/L (110 mg/dL) in the OGTT in spite of their FPG ≥ 6.1 mmol/L in the basic medical check-up. Among the 39 persons with 5.5 mmol/L (100 mg/dL) ≤ FPG < 6.1 mmol/L (110 mg/dL), 22 persons (56.4%) had IGT and 4 persons (10.3%) had DM. Among 167 persons with FPG < 5.5 mmol/L (100 mg/dL) with other risk factors, 58 persons (34.7%) had IGT and 9 persons (5.3%) had DM.
In analyzing persons with FPG < 5.5 mmol/ L (100 mg/dL) and with another single risk fac-tor (Table 3), persons with a single risk facfac-tor of
HbA1c ≥ 5.5% were accounted for 22, who includ-ed 12 IGT persons (54.6%) and 6 DM persons (27%). Persons with a single risk factor of high-BMI were accounted for 33, who included 9 IGT persons (27.3%). Those with a single risk factor of high-triglyceride were 16, including 1 IGT person (6.3%) and 1 DM person (6.3%). Those with a single risk factor of hypertension treatment were 61, including 24 IGT persons (39.3%). Those with a single risk factor of family history of DM were 7, including 2 IGT persons (28%). Therefore, of all 220 persons who received the OGTT, a total number of persons
Table 2. Results of OGTT classified by FPG levels and other factors
FPG level Persons who received Results of the OGTT
in the basic medical The basic medical The Normal Abnormal
check-up check-up OGTT (NGT) IGT DM IGT + DM
DM treatment (+) 32
7.0 mmol/L ≤ FPG 4
6.1 mmol/L ≤ FPG < 7.0 mmol/L 17 14 2 (14.3) 5 (35.7) 7 (50.0) 12 (85.7) 5.5 mmol/L ≤ FPG < 6.1 mmol/L 60 39 13 (33.3) 22 (56.4) 4 (10.3) 26 (66.7) FPG < 5.5 mmol/L with other risk factors 238 167 100 (59.8) 58 (34.7) 9 ( 5.3) 67 (40.1) FPG < 5.5 mmol/L and HbA1c < 5.5%
with no other risk factors 348
Total 734 220 115 (52.3) 85 (38.6) 20 ( 9.1) 105 (47.7)
FPG dose equivalence: 5.5 mmol/L equivalent to 100 mg/dL; 6.1 mmol/L, to 110 mg/dL; 7.0 mmol/L, to 126 mg/dL. Data represent number of persons: ( ), %.
No one with impaired fasting glucose.
DM, diabetes mellitus; FPG, fasting plasma glucose; IGT, impaired glucose tolerance; NGT, normal glucose tolerance; OGGT, oral glucose tolerance test.
Table 3. Results of the OGTT in persons with FPG < 5.5 mmol/L and other risk factors
Risk factor Results of the OGTT
HbA1c BMI Triglyceride Hyper- Familial Number Normal Abnormal
≥ 5.5 ≥ 25 ≥ 1.69 tension history of (NGT) IGT DM IGT + DM
kg/m2 mmol/L treatment of DM persons
+ + or – + or – + or – + or – 22 4 ( 18.2) 12 (54.6) 6 (27.3) 18 (81.8) – + – – + or – 33 24 ( 72.7) 9 (27.3) 0 ( 0 ) 9 (27.3) – – + – + or – 16 14 ( 87.5) 1 ( 6.3) 1 ( 6.3) 2 (12.6) – – – + + or – 61 37 ( 60.7) 24 (39.3) 0 ( 0 ) 24 (39.3) – + + – + or – 14 7 ( 50.0) 6 (42.8) 1 ( 7.1) 7 (50.0) – + – + + or – 4 2 ( 50.0) 2 (50.0) 0 ( 0 ) 2 (50.0) – – + + + or – 5 2 ( 40.0) 2 (40.0) 1 (20.0) 3 (60.0) – + + + + or – 5 5 (100 ) 0 ( 0 ) 0 ( 0 ) 0 ( 0) – – – – + 7 5 ( 71.4) 2 (28.6) 0 ( 0 ) 2 (28.6)
Subtotal in FPG < 5.5 mmol/L with other risk factors 167 100 ( 59.8) 58 (34.7) 9 ( 5.3) 67 (40.1) FPG dose equivalence: 5.5 mmol/L equivalent to 100 mg/dL.
Data represent number of persons: ( ), %.
BMI, body mass index; DM, diabetes mellitus; FPG, fasting plasma glucose; IGT, impaired glucose tolerance; NGT, normal glucose tolerance; OGGT, oral glucose tolerance test.
with glucose intolerance was 105 (47.7%). When the above-mentioned criteria were added to FPG for the 220, additional 67 abnormal persons were detected (Table 3).
Logistic analysis was applied to statistically examine the risk factors for abnormal glucose tol-erance (DM + IGT). For abnormal glucose toler-ance (DM + IGT), the odds ratio of hypertension treatment was 2.43 (P = 0.077; 95% confidence interval, 0.91–6.49) and that of familial history of DM was 2.64 (P = 0.094; 95% confidence interval, 0.85–8.23), indicating a weak tendency, respec-tively (Table 4). We also examined the criteria of the abnormal waist size as ≥ 85 cm for males and ≥ 90 cm for females, but the abnormal waist size was not a significant risk factor. Next, we determined FPG with the highest sensitivity and specificity us-ing the ROC curve for abnormal glucose tolerance (DM + IGT). The optimal FPG was 5.2 mmol/L (93 mg/dL) (sensitivity, 0.62 and specificity, 0.65) (Fig. 2a), and the optimal HbA1c, 5.3% (sensitivity, 0.57 and specificity, 0.74) (Fig. 2b).
Discussion
In this study, the Government-driven criteria were specific to detect relevant IGT and DM; however, it was not sufficient for early detection of mild DM and IGT. When a condition such as high-triglyceride or hypertension treatment was added to Government-driven FPG and HbA1c criteria, we could detect many people with abnormal glucose tolerance.
The optimal HbA1c to detect the IGT + DM pattern in the ROC analysis was 5.3%: this result was compatible with other studies in Asians (Na-kagami et al., 2002). However, the optimal FPG we observed to detect IGT + DM was 5.2 mmol/ L (93 mg/dL). Our sample population was much smaller than that of the DECODA Study. Recently, the High-risk and Population Strategy for Occu-pational Health Promotion Study reported that the risk of diabetes abruptly rose in persons with blood glucose levels higher than 5.2 mmol/L (94 mg/dL) (Hayashino et al., 2007). We consider that FPG 5.2
Table 4. Odds ratio for IGT + DM by multiple re-gression analysis
Risk factor Abnormal glucose tolerance (IGT + DM)
Odds P 95%
ratio value Confidence
interval Age 0.99 0.618 0.96–1.02 Gender (male) 1.10 0.803 0.50–2.45 BMI ≥ 25.0 kg/m2 1.70 0.294 0.63–4.55 Triglyceride ≥ 1.69 mmol/L 0.95 0.899 0.40–2.23 Hypertension treatment 2.43 0.077 0.91–6.49 HbA1c ≥ 5.5% 16.3 0.001 4.09–65.8 Familial history of DM 2.64 0.094 0.85–8.23 Familial history of hypertension 1.29 0.532 0.58–2.84 Waist abnormality 1.32 0.558 0.52–3.39 Data are the dependent variable (abnormal glucose toler-ance) versus the explanatory variable (NGT): abnormal glucose tolerance, DM in 20 and IGT in 85 persons; NGT in 115 persons.
Adjusted for all explanatory variables.
BMI, body mass index; DM, diabetes mellitus; IGT, im-paired glucose tolerance; NGT, normal glucose tolerance.
Fig. 2. Receiver operating characteristic curves for FPG and HbA1c in predicting DM + IGT in the OGTT. Sen-sitivity is plotted as a function of (1 – specificity). Points on the curve representing optimal FPG and HbA1c are marked with circles. DM, diabetes mellitus; FPG, fasting plasma glucose; IGT, impaired glucose tolerance; OGTT, oral glucose tolerance test.
1 – Specificity
Sensitivity
Abnormal glucose tolerance (DM + IGT)
Sensitivity 1.0 0.8 0.6 0.4 0.2 0.0 0.0 0.2 0.4 0.6 0.8 1.0 1 – Specificity 1.0 0.8 0.6 0.4 0.2 0.0 0.0 0.2 0.4 0.6 0.8 1.0 FPG HbA1c FPG 5.2 mmol/L (93 mg/dL) HbA1c 5.3%
a
b
mmol/L and HbA1c 5.3% were effective to detect IGT and DM.
Of persons with only a single risk factor of hypertension treatment, 39.3% showed the IGT pat-tern. These results indicated that FPG and HbA1c are effective enough to find DM, but FPG and HbA1c alone are insufficient to find IGT. It is im-portant to examine risk factors additional to hyper-tension treatment. In general, hyperhyper-tension alone is not considered as a high-risk factor for abnormal glucose tolerance. However, there are several re-ports that hypertension is associated with the an-giotensin II and aldosterone system, which affects insulin resistance (Folli et al., 1997; Sowers, 2004; Catena et al., 2006; Colussi et al., 2007). Based on the present study, hypertension was a major risk factor for IGT. These results are very interest-ing from the view of novel IGT criteria. Recently, the United States Preventive Services Task Force reported that evidence is lacking on the health ben-efits of detecting type 2 diabetes by either targeted or mass screening, but persons with hypertension probably benefit from screening (Norris et al., 2008). According to the 2004 survey of hyperten-sion treatment of Kofu Town, 289 patients had re-ceived hypertension treatment: 216 patients (74.7%) used a calcium antagonist, 33 patients (11.4%) used an angiotensin-converting enzyme inhibitor, 163 patients (56.4%) used an angiotension II receptor blocker, 113 patients (39.1%) used an alpha-blocker, 17 patients (5.8%) used a beta-blocker and 63 pa-tients (21.8%) used a diuretic (data not shown). In the present study, we did not examine the preva-lence of glucose intolerance according to the hy-pertension drugs. However, risk analysis by each drug would be a topic of future study.
There are few reports describing criteria for screening IGT and DM in Japanese and Asian populations. The criteria we presented here are a novel method to target early stages of IGT and DM in Japanese and Asian populations. The Japanese Government plans to drop the FPG criteria from 6.1 to 5.5 mmol/L (110 to 100 mg/dL), in order to find the early stage of diabetes and prevent the follow-ing cardiovascular event. Although the interpreta-tion of this study is limited because of the small
number of participants and no cohort study, this study supports such a new guideline for the Japa-nese population and any other Asians. Residents of Kofu Town have shown a high incidence of cerebral stroke. According to NIPPON DATA80, which is an observation cohort study on stroke in the Japanese population, the stroke mortality tended to be almost 2 times higher in rural areas than in urban areas in Japan (Nishi et al., 2007). The mortality rate of stroke in rural areas is nearly equal to that of Kofu Town. The reason for this geographical variation is likely to be related to the prevalence of hypertension. This type of environ-ment is similar to Kofu Town, so our criteria would be applicable to other rural areas in Japan.
In conclusion, we were able to detect early stages of abnormal glucose tolerance using com-binations of FPG, HbA1c, BMI, triglyceride, hy-pertension treatment and family history of DM. The results indicate that only FPG ≥ 6.1 mmol/L (110 mg/dL) is not sufficient to detect early stages of DM and IGT. The most useful criteria for early detection of IGT and DM were FPG ≥ 5.2 mmol/ L (93 mg/dL) and HbA1c ≥ 5.3%. In addition, even if FPG was less than 5.5 mmol/L (100 mg/dL), hy-pertension treatment might be taken into account for the IGT risk, since 39.3% of persons with a single risk factor of hypertension treatment showed the IGT pattern. The interpretation of this study was limited, since it was not a cohort study and the group of 220 OGTT-received residents was biased.
References
1 Alberti KG, Zimmet PZ. Definition, diagnosis and classification of diabetes mellitus and its complications. Part 1: diagnosis and classification of diabetes mellitus provisional report of a WHO consultation. Diabet Med 1998;15:539–553.
2 Bando Y, Ushiogi Y, Okafuji K, Toya D, Tanaka N, Fujisawa M. The relationship of fasting plasma glucose values and other variables to 2-h postload plasma glu-cose in Japanese subjects. Diabetes Care 2001;24:1156– 1160.
3 Catena C, Lapenna R, Favret G. Insulin sensitivity in patients with primary aldosteronism: a follow-up study. J Clin Endocrinol Metab 2006;91:3457–3463.
A, Sechi LA. Insulin resistance and hyperinsulinemia are related to plasma aldosterone levels in hypertensive patients. Diabetes Care 2007;30:2349–2354.
5 DECODE Study Group on behalf of the European Diabetes Epidemiology Group, The. Is the current definition for diabetes relevant to mortality risk from all causes and cardiovascular and noncardiovascular dis-eases? Diabetes Care 2003;26:688–696.
6 Examination Committee of Criteria for ‘Obesity Dis-ease’ in Japan; Japan Society for the Study of Obesity. New criteria for ‘obesity disease’ in Japan. Circ J 2002;66:987–992.
7 Expert Committee on the Diagnosis and Classification of Diabetes Mellitus, The. Report of the Expert Com-mittee on the Diagnosis and Classification of Diabetes Mellitus. Diabetes Care 1997;20:1183–1197.
8 Expert Committee on the Diagnosis and Classifica-tion of Diabetes Mellitus, The. Follow-up report on the diagnosis of diabetes mellitus. Diabetes Care 2003;26:3160–3167.
9 Fujishima M, Kiyohara Y, Kato I, Ohmura T, Iwamoto H, Nakayama K, et al. Diabetes and cardiovascular disease in a prospective population survey in Japan: the Hisayama Study. Diabetes 1996;45 Suppl 3:S14–16. 10 Folli F, Kahn CR, Hansen H, Bouchie JL, Feener
EP. Angiotensin II inhibits insulin signaling in aortic smooth muscle cells at multiple levels. A potential role for serine phosphorylation in insulin/angiotensin II crosstalk. J Clin Invest 1997;100:2158–2169.
11 Hayashi T, Tsumura K, Suematsu C, Endo G, Fujii S, Okada K. High normal blood pressure, hypertension, and the risk of type 2 diabetes in Japanese men. The Osaka Health Survey. Diabetes Care 1999;22:1683– 1687.
12 Hayashino Y, Fukuhara S, Ueshima H. Normal fasting plasma glucose levels and type 2 diabetes: the high-risk and population strategy for occupational health promo-tion (HIPOP-OHP) [corrected] study. Acta Diabetol 2007;44:164–166.
13 Ito C. Epidemiological study of diabetes mellitus in the Hiroshima area-prevalence of diabetes mellitus and follow-up studies using the glucose tolerance test 5-19 years after initial testing. Tohoku J Exp Med 1983;141 Suppl:115–118.
14 Ito C, Maeda R, Nakamura K, Sasaki H. Prediction of diabetes mellitus (NIDDM). Diabetes Res Clin Pract 1994;34:7–11.
15 Ito C, Maeda R, Ishida S, Sasaki H, Harada H. Correla-tion among fasting plasma glucose, two-hour plasma glucose levels in OGTT and HbA1c. Diabetes Res Clin Pract 2000;50:225–230.
16 Kadowaki T, Miyake Y, Kajinuma H. Risk factors for worsening to diabetes in subjects with impaired glucose tolerance. Diabetologia 1984;26:44–49.
17 Kadowaki T, Yoshinaga H. Risk factors for the develop-ment of non-insulin-dependent diabetes mellitus (NID-DM) in Japan. Diabetes Res Clin Pract 1994;24:123–
127.
18 Kametani T, Koshida H, Nagaoka T, Miyakoshi H. Hypertriglyceridemia is an independent risk factor for development of impaired fasting glucose and diabetes mellitus: a 9-year longitudinal study in Japanese. Intern Med 2002;41:516–521.
19 Ko GT, Chan JC, Li JK. Combined use of a fasting plasma glucose concentration and HbA1c or fruc-tosamine predicts the likelihood of having diabetes in high-risk subjects. Diabetes Care 1998;21:1221–1225. 20 Kuzuya T, Nakagawa S, Ito C. Committee of the Japan
Diabetes Society on the diagnostic criteria of diabetes mellitus: report of the Committee on the classification and diagnostic criteria of diabetes mellitus. Diabetes Res Clin Pract 2002;55:65–85.
21 Modan M, Harris MI, Halkin H. Evaluation of WHO and NDDG criteria for impaired glucose toler-ance. Results from two national samples. Diabetes 1989;38:1630–1635.
22 Nakagami T, Qiao Q, Tuomilehto J, Balkau B, Carstensen B, Tajima N, et al. and The DECODA Study Group (on behalf of the International Diabetes Epidemi-ology Group). The fasting plasma glucose cut-point pre-dicting a diabetic 2-h OGTT glucose level depends on the phenotype. Diabetes Res Clin Pract 2002;55:35–43. 23 Nakagami T, DECODA Study Group. Hyperglycaemia and mortality from all causes and from cardiovascular disease in five populations of Asian origin. Diabetolo-gia 2004;47:385–394.
24 Nelson KM, Boyko EJ. Third National Health and Nu-trition Examination Survey: predicting impaired glu-cose tolerance using common clinical information: data from the Third National Health and Nutrition Examina-tion Survey. Diabetes Care 2003;26:2058–2062. 25 Nishi N, Sugiyama H, Kasagi F, Kodama K, Hayakawa
T, Ueda K, et al. Urban-rural difference in stroke mortality from a 19-year cohort study of the Japanese general population: NIPPON DATA80. Soc Sci Med 2007;65:822–832.
26 Norris SL, Kansagara D, Bougatsos C, Fu R. Screening for type 2 diabetes mellitus in adults: U.S. Preventive Services Task Force Recommendation Statement. Ann Intern Med 2008;148:855–868.
27 Perkins NJ, Schisterman EF. The inconsistency of “op-timal” cutpoints obtained using two criteria based on the receiver operating characteristic curve. Am J Epide-miol 2006;163:670–675.
28 Qiao Q, Nakagami T, Tuomilehto J, Borch-Johnsen K, Balkau B, Iwamoto Y, et al. and The DECODA Study Group on behalf of the International Diabetes Epide-miology Group. Comparison of the fasting and the 2-h glucose criteria for diabetes in different Asian cohorts. Diabetologia 2000;43:1470–1475.
29 Sowers JR. Insulin resistance and hypertension. Am J Physiol Heart Circ Physiol 2004;286:1597–1602. 30 Svedberg J, Björntorp P, Lönnroth P, Smith U.
binding and action in isolated rat hepatocytes by eto-moxir. Diabetes 1991;40:783–786.
31 Takahashi M, Kaji K, Togashi A, Ogino Y, Shibosawa T, Kawazu S. Usefulness of paired estimation of fasting plasma glucose and HbA1c: a long-term follow-up study of screened nondiabetic subjects. J Japan Diab Soc 2001;44:745–750.
32 Takahashi Y, Noda M, Tsugane S, Kuzuya T, Ito C, Kadowaki T. Prevalence of diabetes estimated by plas-ma glucose criteria combined with standardized mea-surement of HbA1c among health checkup participants on Miyako Island, Japan. Diabetes Care 2000;23:1092– 1096.
33 Tominaga M, Eguchi H, Manaka H, Igarashi K, Kato T, Sekikawa A. Impaired glucose tolerance is a risk fac-tor for cardiovascular disease, but not impaired fasting glucose. The Funagata Diabetes Study. Diabetes Care 1999;22:920–924.
34 Wada K, Tamakoshi K, Yatsuya H, Otsuka R, Murata C, Zhang H, et al. Association between parental his-tories of hypertension, diabetes and dyslipidemia and the clustering of these disorders in offspring. Prev Med 2006;42:358–363.
35 Youden WJ. Index for rating diagnostic tests. Cancer 1950;3:32–35.
36 Zhou W, Li H, Gu Y, Yu L, Han J, Xu W, et al. The ROC analysis for different time points during oral glu-cose tolerance test. Diabetes Res Clin Pract 2006;72: 88–92.
37 Zhou W, Gu Y, Li H, Luo M. Assessing 1-h plasma glu-cose and shape of the gluglu-cose curve during oral gluglu-cose tolerance test. Eur J Endocrinol 2006;155:191–197.
Received June 22, 2009; accepted July 16, 2009 Corresponding author: Shin-ichi Taniguchi, MD, PhD