Psychological Factors and Mortality Risk in a Rural Area of Japan
Yasuko Tokushima,* Takenobu Hosoda,† Mikizo Okamoto† and Youichi Kurozawa†*Department of Nursing Care Environment and Mental Health, School of Health Science, Tottori University Faculty of Medicine, Yonago 683-8503, Japan and †Division of Health Administration and Promotion, Department of Social Medicine, School of Medicine, Tottori University Faculty of Medicine, Yonago 683-8503, Japan
ABSTRACT
Background
The purpose of this study is to assess the
association between psychological factors and mortality
risk from all causes.
Methods
We used follow-up data for 4,181 persons
from 40 to 79 years over a period of 17.6 years from one
part of the Japan Collaborative Cohort Study (JACC
Study). The status of the individuals comprising the data
of the study as of the end of December 2006 was
deter-mined from their registration cards and death records.
We calculated the proportions of selected variables
among 5 psychological factors by sex. Cox’s
proportion-al hazards model was used to evproportion-aluate the associations
between psychological factors and mortality risk from
all causes. Data were adjusted for age, medical history,
education, job status, marital status, drinking, smoking,
physical activity, sleeping duration, body mass index and
breakfast.
Results
During the follow-up period, a total of 791
deaths were recorded. Men who reported feelings of
be-ing trusted had a decreased risk for mortality risk from
all causes compared with the risk of those who reported
“maybe”, whereas those without feelings of being trusted
had increased risk for mortality risk from all causes.
ConclusionThis study suggests that the absence of
feelings of being trusted increases the risk of all causes
of mortality among middle-aged and elderly men in a
rural area. Our findings suggest that interpersonal
rela-tionships comprise an important factor in longevity.
Key wordsfeeling of being trusted; long-term cohort
study; mortality risk; psychological factor; survival
analysis
Some previous studies have suggested that positive
psy-chological factors, such as well-being, life satisfaction
and optimism, contribute to reduction of mortality risk
from all causes.
1–14In Japan, ikigai is a Japanese word
that is considered to express one’s personal well-being.
1Corresponding author: Yasuko Tokushima y-tokushima@med.tottori-u.ac.jp Received 2013 December 6 Accepted 2014 January 29
Abbreviations: BMI, body mass index; HR, hazard ratio; JACC Study, the Japan Collaborative Cohort Study
To our knowledge, there is no equivalent term in
Eng-lish. Ikigai is defined in Japanese dictionaries as
some-thing to live for, the joy and goal of living, a life worth
living, and the happiness and benefit of being alive. It is
also understood to be a comprehensive concept
includ-ing not only pleasure and happiness but also the
mean-ing of one’s life and self-realization.
2, 3In the present
study, we defined ikigai as “that which most makes one’s
life seem worth living” and defined persons with ikigai
as those with a positive sense of psychological
well-be-ing. Previous studies
1–9suggested that lack of ikigai was
associated with increased mortality risk from all causes.
Psychological stress is considered to be associated with
increase risks for disease, especially for cardiovascular
disease.
15–18Time urgency is also one of components of
the Type A behavior pattern, but there is little
informa-tion on the associainforma-tion of time urgency with mortality
risk.
19Information on the association time urgency with
mortality is also little.
1Only 2 investigations
1, 4have looked at the
relation-ship between the feeling of being trusted and mortality
risk. These studies suggested that in those who had no
feeling of being trusted, mortality risk of all causes
in-creased. However, the adjusted confounding factors were
less in both studies. Tanno and Sakata
1adjusted for age
and residence of confounding factors the subject. Sakata
et al.
4adjusted age, smoking status, drinking status and
past hypertension.
The purpose of the present study is to assess the
as-sociation between psychological factors and mortality
risk from all causes. This research attempted to clarify
the level of influence of various psychological factors
after multivariate adjustment on mortality risk from all
causes, on the basis of a long-term cohort study.
SUBJECTS AND METHODS
The present study began in 1989 in Nichinan Town, an
agricultural community located in the southwest area of
Tottori Prefecture. About 90% of the town is forest. The
birth rate is low while longevity progresses.
20The main
industries of the town are agriculture and construction
accounting for about 50% of the economy of the town,
the local labor force being mainly engaged in these
oc-cupations. At that time, the town had a total population
of 7,943, of whom 26.3% aged 65 years or older. By
2005, because of the steadily declining birth rate and
ag-ing, the town population had decreased to 44.9% of the
1989 level according to the national census.
21We used 17.6-year follow-up data (1,979 men and
2,430 women from 40 to 79 years) from one area of the
Japan Collaborative Cohort Study (JACC Study).
11, 12, 22, 23The status of the individuals comprising the data of
the study at the end of December 2006 was determined
from their registration cards and death records. To
con-serve personal information, the names of all individuals
were coded. Privacy concerns were noted and the study
was approved by the Ethics Committee of Tottori
Uni-versity (approval number, 1380).
Survey items and classifications
The baseline survey contents in 1989 were elicited by
self-administered questionnaire: medical history (stroke,
hypertension, myocardial infarction, kidney disease,
liver disease, cholecystitis or cholelithiasis, diabetes
mellitus, gastric ulcer or duodenal ulcer, tuberculosis or
pleurisy or cancer), eating habits, movement, rest, health
condition, psychological condition, drinking habit,
smoking habit, height, weight, marriage history, school
education and occupation. In the present study, we used
the following items out of the above; psychological
fac-tors, medical history, alcohol use status, smoking status,
physical activity, sleep duration, body mass index (BMI),
breakfast, education level, job status and marital status.
Psychological factors involved getting data on “ikigai,”
“psychological stress,” “sense of hurry,” “a feeling of
be-ing trusted” and “life satisfaction.” Ikigai was assessed
through the subject’s response to the question “Do you
have ikigai in your life?” We classified the items related
to ikigai into 2 categories by combining positive answers
such as “definitely yes” and “yes” into one category and
negative answers such as “maybe yes” and “unknown”
into the other because the answers are similar. The
nega-tive category formed the reference group for ikigai.
Psychological stress was assessed through the
sub-ject’s response to the question “Do you feel stress
dur-ing your daily life?” The sense of hurry was assessed
through the subject’s response to the question “Do you
hurry to complete your daily work?” The feeling of
be-ing trusted was assessed through the subject’s response
to the question “Do you feel you are trusted by
some-one?” Life satisfaction was assessed through the
sub-ject’s response to the question “Do you wish you could
live your life over again?” We classified answers to these
4 items into 3 categories by combining positive answers
such as “definitely yes” and “yes” into one category,
neg-ative answers such as “no” and “maybe yes” to another.
The group of “maybe yes” was defined as the reference
group.
The responses related to medical history (stroke,
hy-pertension, myocardial infarction, kidney disease, liver
disease, cholecystitis or cholelithiasis, diabetes mellitus,
gastric ulcer or duodenal ulcer, tuberculosis or pleurisy
or cancer) were classified into 2 categories: “yes” or “no.”
Alcohol use status was classified into 3 categories:
“cur-rent drinker,” “past drinker” or “non-drinker.”
Smok-ing status was also classified into 3 categories: “current
smoker,” “past smoker” or “non-smoker.” Physical
activ-ity was classified into 2 categories: “exercise ≥ 1 h/week”
or “exercise rarely.” Sleep duration was classified into 3
categories: “< 7 h,” “≥ 7 h and < 9 h,” “≥ 9 h.” BMI was
classified into 3 categories: “< 18.5,” “≥ 18.5 and < 25,”
“≥ 25.” Breakfast was classified into 2 categories: “I eat”
and “I rarely eat.”
About social factors, education was classified into 2
categories: “age at graduation of < 18 years” or “higher
age at final graduation”. Job was classified into 3
catego-ries: “unemployed” (including “housewife”), “employee”
(including “office worker” and “self-employed”) or
“farmer” (including “contracted worker”). Marital status
was classified into 2 categories: “living with a spouse” or
“other” (single, divorced or widowed).
Statistical analysis
We excluded 227 persons who died within 5 years after
the study began. As for persons transferring, the period
to transfer was analyzed as a pursuit period. We
calcu-lated the proportions of the selected variables for the
5 psychosocial factors by sex at baseline. The
above-mentioned categorical variables were compared using
a chi-squared test between each psychological factor by
sex. We calculated Spearman’s correlation coefficient
for each psychological factor at baseline. Cox’s
propor-tional hazards model was used to evaluate the
associa-tions between each psychological factor and mortality
risk from all causes. Data were adjusted for age, medical
history, education, job status, marital status, drinking
status, smoking status, physical activity, sleep duration,
BMI and breakfast by sex. We used IBM SPSS Statistics
Ver.19 (IBM, Chicago, IL) for analysis.
RESULTS
During the follow-up period (average 15.7 years; total
65,660.5 person years), a total of 791 deaths (482 men
and 309 women) were recorded. Tables 1 to 5 show
se-lected baseline characteristics of the subjects according
to the psychological factors by sex. Each psychological
factor was observed significant differences mutually.
The relations with items other than psychological factors
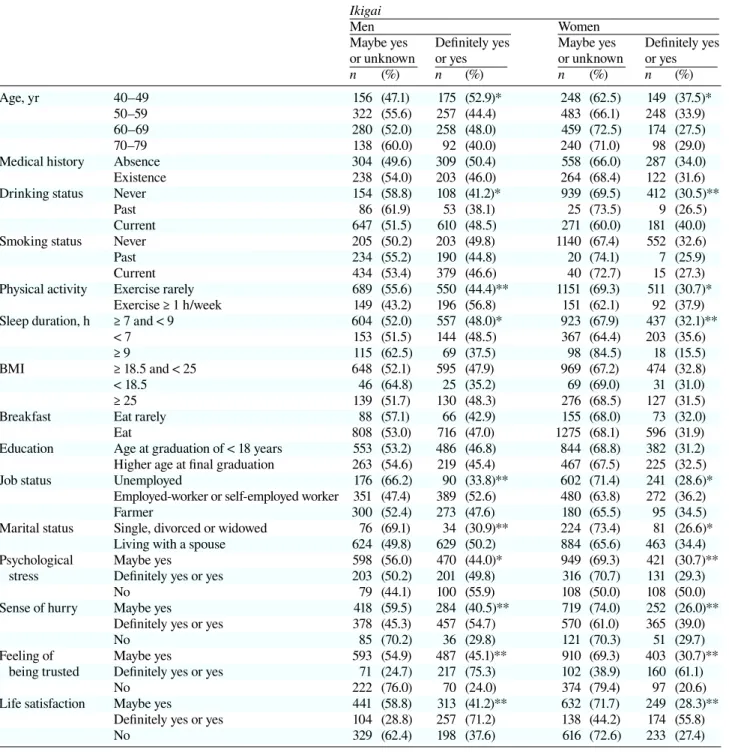
Table 1. Selected baseline characteristics of the subjects according to ikigai by sex
Ikigai
Men Women
Maybe yes Definitely yes Maybe yes Definitely yes or unknown or yes or unknown or yes
n (%) n (%) n (%) n (%)
Age, yr 40–49 156 (47.1) 175 (52.9)* 248 (62.5) 149 (37.5)*
50–59 322 (55.6) 257 (44.4) 483 (66.1) 248 (33.9)
60–69 280 (52.0) 258 (48.0) 459 (72.5) 174 (27.5)
70–79 138 (60.0) 92 (40.0) 240 (71.0) 98 (29.0)
Medical history Absence 304 (49.6) 309 (50.4) 558 (66.0) 287 (34.0)
Existence 238 (54.0) 203 (46.0) 264 (68.4) 122 (31.6)
Drinking status Never 154 (58.8) 108 (41.2)* 939 (69.5) 412 (30.5)**
Past 86 (61.9) 53 (38.1) 25 (73.5) 9 (26.5)
Current 647 (51.5) 610 (48.5) 271 (60.0) 181 (40.0)
Smoking status Never 205 (50.2) 203 (49.8) 1140 (67.4) 552 (32.6)
Past 234 (55.2) 190 (44.8) 20 (74.1) 7 (25.9)
Current 434 (53.4) 379 (46.6) 40 (72.7) 15 (27.3)
Physical activity Exercise rarely 689 (55.6) 550 (44.4)** 1151 (69.3) 511 (30.7)* Exercise ≥ 1 h/week 149 (43.2) 196 (56.8) 151 (62.1) 92 (37.9) Sleep duration, h ≥ 7 and < 9 604 (52.0) 557 (48.0)* 923 (67.9) 437 (32.1)**
< 7 153 (51.5) 144 (48.5) 367 (64.4) 203 (35.6)
≥ 9 115 (62.5) 69 (37.5) 98 (84.5) 18 (15.5)
BMI ≥ 18.5 and < 25 648 (52.1) 595 (47.9) 969 (67.2) 474 (32.8)
< 18.5 46 (64.8) 25 (35.2) 69 (69.0) 31 (31.0)
≥ 25 139 (51.7) 130 (48.3) 276 (68.5) 127 (31.5)
Breakfast Eat rarely 88 (57.1) 66 (42.9) 155 (68.0) 73 (32.0)
Eat 808 (53.0) 716 (47.0) 1275 (68.1) 596 (31.9)
Education Age at graduation of < 18 years 553 (53.2) 486 (46.8) 844 (68.8) 382 (31.2) Higher age at final graduation 263 (54.6) 219 (45.4) 467 (67.5) 225 (32.5)
Job status Unemployed 176 (66.2) 90 (33.8)** 602 (71.4) 241 (28.6)*
Employed-worker or self-employed worker 351 (47.4) 389 (52.6) 480 (63.8) 272 (36.2)
Farmer 300 (52.4) 273 (47.6) 180 (65.5) 95 (34.5)
Marital status Single, divorced or widowed 76 (69.1) 34 (30.9)** 224 (73.4) 81 (26.6)* Living with a spouse 624 (49.8) 629 (50.2) 884 (65.6) 463 (34.4) Psychological Maybe yes 598 (56.0) 470 (44.0)* 949 (69.3) 421 (30.7)** stress Definitely yes or yes 203 (50.2) 201 (49.8) 316 (70.7) 131 (29.3)
No 79 (44.1) 100 (55.9) 108 (50.0) 108 (50.0)
Sense of hurry Maybe yes 418 (59.5) 284 (40.5)** 719 (74.0) 252 (26.0)** Definitely yes or yes 378 (45.3) 457 (54.7) 570 (61.0) 365 (39.0)
No 85 (70.2) 36 (29.8) 121 (70.3) 51 (29.7)
Feeling of Maybe yes 593 (54.9) 487 (45.1)** 910 (69.3) 403 (30.7)** being trusted Definitely yes or yes 71 (24.7) 217 (75.3) 102 (38.9) 160 (61.1)
No 222 (76.0) 70 (24.0) 374 (79.4) 97 (20.6)
Life satisfaction Maybe yes 441 (58.8) 313 (41.2)** 632 (71.7) 249 (28.3)** Definitely yes or yes 104 (28.8) 257 (71.2) 138 (44.2) 174 (55.8)
No 329 (62.4) 198 (37.6) 616 (72.6) 233 (27.4)
BMI, body mass index. *P < 0.05.
**P < 0.001.
are shown below. As for ikigai, significant differences
were observed in the category of age, drinking status,
physical activity, sleep duration, job status and marital
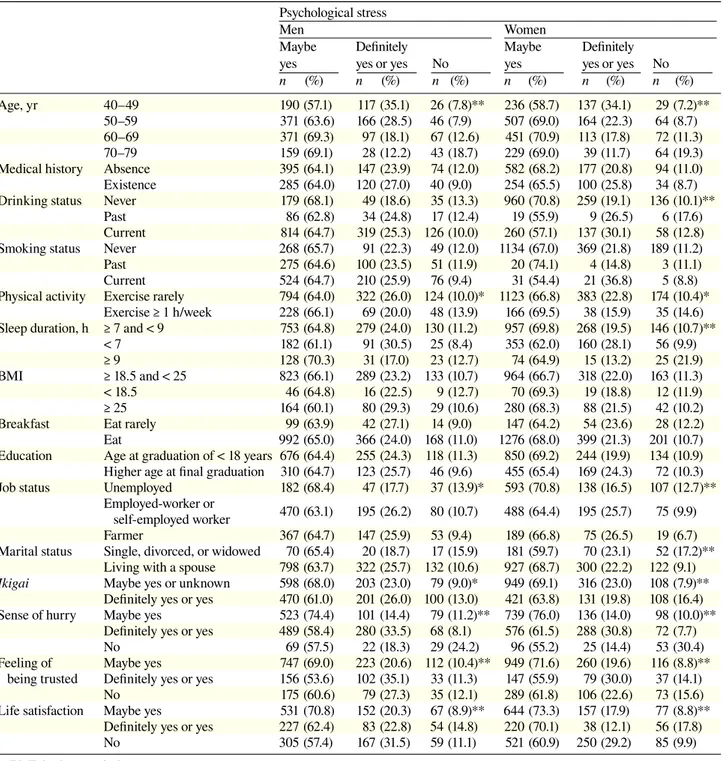
status among men and women (Table 1). As for
psycho-logical stress, the same results as ikigai among women
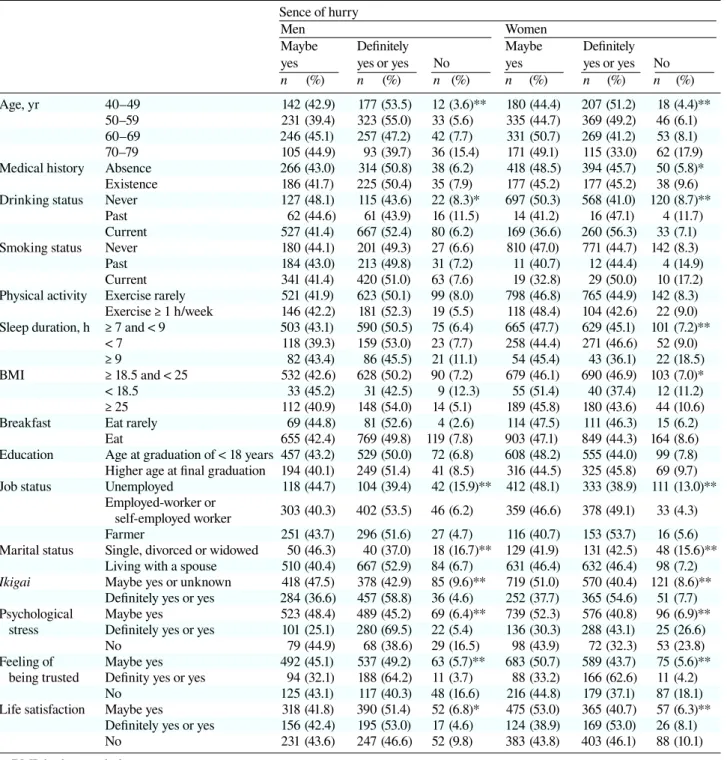
(Table 2). As for sense of hurry, significant differences
were observed in the category of age, drinking status,
job status and marital status among men and women
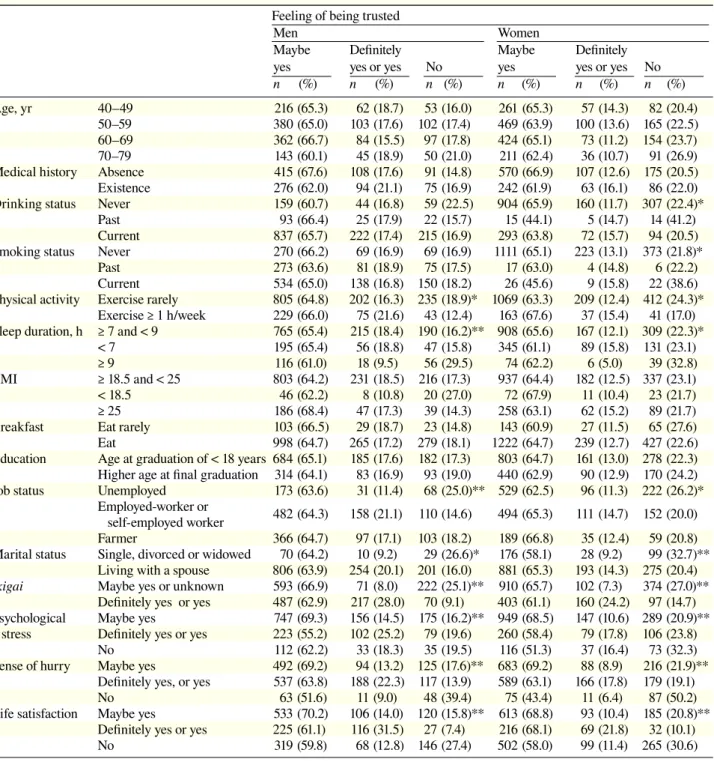
(Table 3). As for feeling of being trusted, there was no
significant difference in the category of age among both
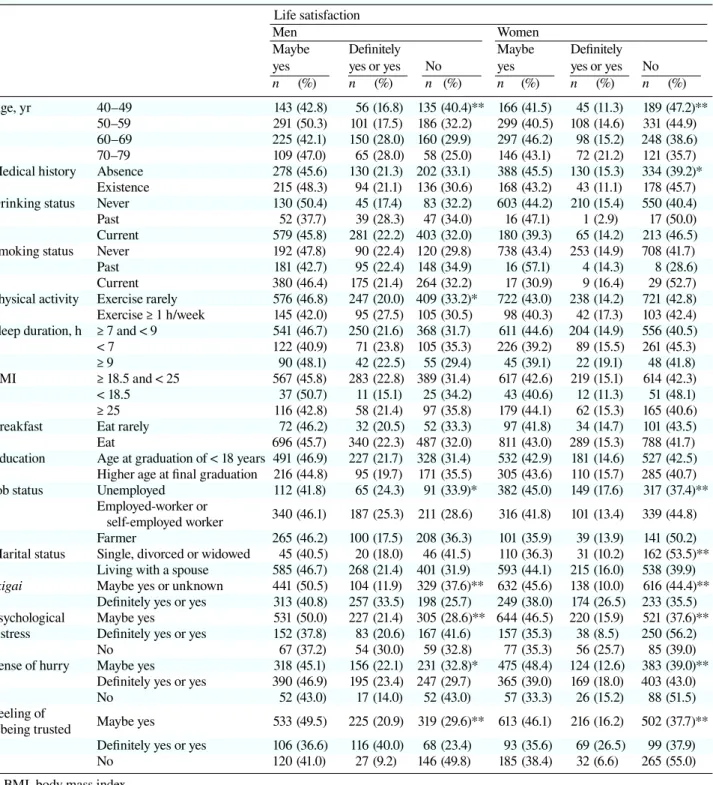
men and women (Table 4). As for life satisfaction,
sig-nificant differences were observed in the category of age
and job status among men and women (Table 5). There
were observed significant differences between 5
psycho-logical factors and job status among men and women.
Only among women, significant differences were
ob-served between 5 psychological factors and marital
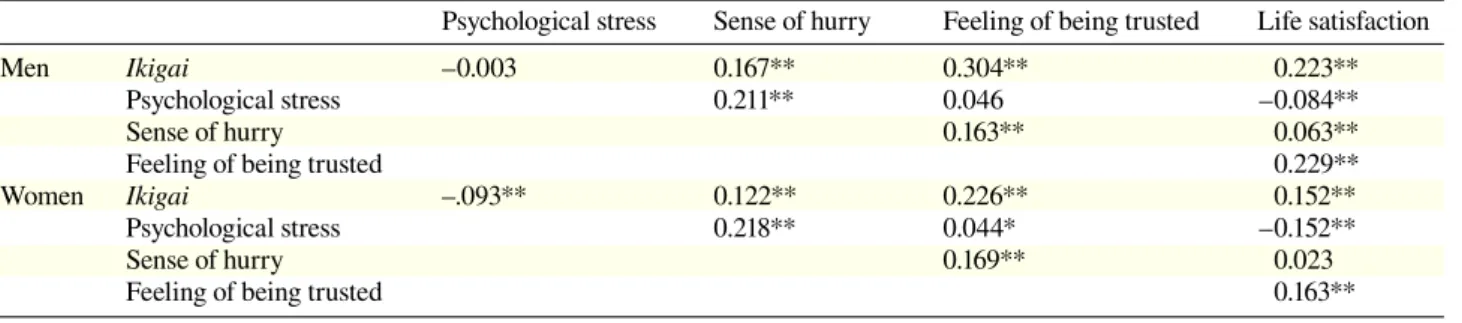
status. Table 6 shows correlation coefficients between
Table 2. Selected baseline characteristics of the subjects according to psychological stress by sex Psychological stress
Men Women
Maybe Definitely Maybe Definitely yes yes or yes No yes yes or yes No
n (%) n (%) n (%) n (%) n (%) n (%)
Age, yr 40–49 190 (57.1) 117 (35.1) 26 (7.8)** 236 (58.7) 137 (34.1) 29 (7.2)** 50–59 371 (63.6) 166 (28.5) 46 (7.9) 507 (69.0) 164 (22.3) 64 (8.7) 60–69 371 (69.3) 97 (18.1) 67 (12.6) 451 (70.9) 113 (17.8) 72 (11.3) 70–79 159 (69.1) 28 (12.2) 43 (18.7) 229 (69.0) 39 (11.7) 64 (19.3) Medical history Absence 395 (64.1) 147 (23.9) 74 (12.0) 582 (68.2) 177 (20.8) 94 (11.0) Existence 285 (64.0) 120 (27.0) 40 (9.0) 254 (65.5) 100 (25.8) 34 (8.7) Drinking status Never 179 (68.1) 49 (18.6) 35 (13.3) 960 (70.8) 259 (19.1) 136 (10.1)**
Past 86 (62.8) 34 (24.8) 17 (12.4) 19 (55.9) 9 (26.5) 6 (17.6) Current 814 (64.7) 319 (25.3) 126 (10.0) 260 (57.1) 137 (30.1) 58 (12.8) Smoking status Never 268 (65.7) 91 (22.3) 49 (12.0) 1134 (67.0) 369 (21.8) 189 (11.2) Past 275 (64.6) 100 (23.5) 51 (11.9) 20 (74.1) 4 (14.8) 3 (11.1) Current 524 (64.7) 210 (25.9) 76 (9.4) 31 (54.4) 21 (36.8) 5 (8.8) Physical activity Exercise rarely 794 (64.0) 322 (26.0) 124 (10.0)* 1123 (66.8) 383 (22.8) 174 (10.4)*
Exercise ≥ 1 h/week 228 (66.1) 69 (20.0) 48 (13.9) 166 (69.5) 38 (15.9) 35 (14.6) Sleep duration, h ≥ 7 and < 9 753 (64.8) 279 (24.0) 130 (11.2) 957 (69.8) 268 (19.5) 146 (10.7)**
< 7 182 (61.1) 91 (30.5) 25 (8.4) 353 (62.0) 160 (28.1) 56 (9.9) ≥ 9 128 (70.3) 31 (17.0) 23 (12.7) 74 (64.9) 15 (13.2) 25 (21.9) BMI ≥ 18.5 and < 25 823 (66.1) 289 (23.2) 133 (10.7) 964 (66.7) 318 (22.0) 163 (11.3) < 18.5 46 (64.8) 16 (22.5) 9 (12.7) 70 (69.3) 19 (18.8) 12 (11.9) ≥ 25 164 (60.1) 80 (29.3) 29 (10.6) 280 (68.3) 88 (21.5) 42 (10.2) Breakfast Eat rarely 99 (63.9) 42 (27.1) 14 (9.0) 147 (64.2) 54 (23.6) 28 (12.2) Eat 992 (65.0) 366 (24.0) 168 (11.0) 1276 (68.0) 399 (21.3) 201 (10.7) Education Age at graduation of < 18 years 676 (64.4) 255 (24.3) 118 (11.3) 850 (69.2) 244 (19.9) 134 (10.9) Higher age at final graduation 310 (64.7) 123 (25.7) 46 (9.6) 455 (65.4) 169 (24.3) 72 (10.3) Job status Unemployed 182 (68.4) 47 (17.7) 37 (13.9)* 593 (70.8) 138 (16.5) 107 (12.7)**
Employed-worker or
self-employed worker 470 (63.1) 195 (26.2) 80 (10.7) 488 (64.4) 195 (25.7) 75 (9.9) Farmer 367 (64.7) 147 (25.9) 53 (9.4) 189 (66.8) 75 (26.5) 19 (6.7) Marital status Single, divorced, or widowed 70 (65.4) 20 (18.7) 17 (15.9) 181 (59.7) 70 (23.1) 52 (17.2)**
Living with a spouse 798 (63.7) 322 (25.7) 132 (10.6) 927 (68.7) 300 (22.2) 122 (9.1) Ikigai Maybe yes or unknown 598 (68.0) 203 (23.0) 79 (9.0)* 949 (69.1) 316 (23.0) 108 (7.9)**
Definitely yes or yes 470 (61.0) 201 (26.0) 100 (13.0) 421 (63.8) 131 (19.8) 108 (16.4) Sense of hurry Maybe yes 523 (74.4) 101 (14.4) 79 (11.2)** 739 (76.0) 136 (14.0) 98 (10.0)**
Definitely yes or yes 489 (58.4) 280 (33.5) 68 (8.1) 576 (61.5) 288 (30.8) 72 (7.7) No 69 (57.5) 22 (18.3) 29 (24.2) 96 (55.2) 25 (14.4) 53 (30.4) Feeling of Maybe yes 747 (69.0) 223 (20.6) 112 (10.4)** 949 (71.6) 260 (19.6) 116 (8.8)** being trusted Definitely yes or yes 156 (53.6) 102 (35.1) 33 (11.3) 147 (55.9) 79 (30.0) 37 (14.1)
No 175 (60.6) 79 (27.3) 35 (12.1) 289 (61.8) 106 (22.6) 73 (15.6) Life satisfaction Maybe yes 531 (70.8) 152 (20.3) 67 (8.9)** 644 (73.3) 157 (17.9) 77 (8.8)**
Definitely yes or yes 227 (62.4) 83 (22.8) 54 (14.8) 220 (70.1) 38 (12.1) 56 (17.8) No 305 (57.4) 167 (31.5) 59 (11.1) 521 (60.9) 250 (29.2) 85 (9.9) BMI, body mass index.
*P < 0.05. **P < 0.001.
psychological factors by sex. Correlations were found
among each of the psychological factors, but the strength
of the association was weak.
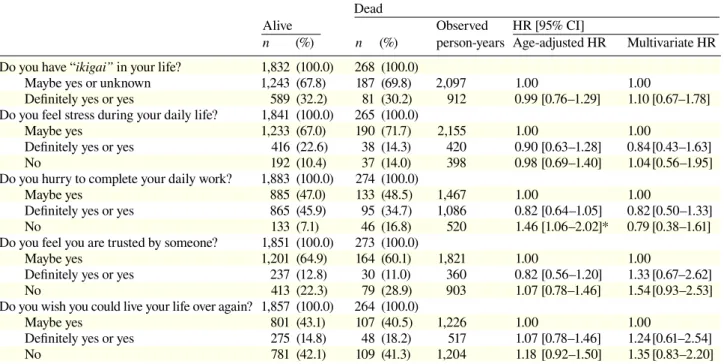
Table 7 shows the age-adjusted and
multivariate-ad-justed hazard ratios (HRs) and 95% confidence levels of
all causes mortality risk according to the 5 psychological
factors among men, and Table 8 shows among women,
in each follow-up period.
Ikigai
For men who reported “definitely yes” or “yes” in
re-sponse to the question of whether they had ikigai, their
risk for mortality from all causes after adjusting for age,
the multivariate statistic (age-adjusted HR = 0.64,
mul-tivariate HR = 0.76) decreased compared with that for
men who reported “maybe” or “no.” However, the
risk-adjusted multivariate HR was not significant (P > 0.05).
Table 3. Selected baseline characteristics of the subjects according to sense of hurry by sex Sence of hurry
Men Women
Maybe Definitely Maybe Definitely yes yes or yes No yes yes or yes No
n (%) n (%) n (%) n (%) n (%) n (%)
Age, yr 40–49 142 (42.9) 177 (53.5) 12 (3.6)** 180 (44.4) 207 (51.2) 18 (4.4)** 50–59 231 (39.4) 323 (55.0) 33 (5.6) 335 (44.7) 369 (49.2) 46 (6.1) 60–69 246 (45.1) 257 (47.2) 42 (7.7) 331 (50.7) 269 (41.2) 53 (8.1) 70–79 105 (44.9) 93 (39.7) 36 (15.4) 171 (49.1) 115 (33.0) 62 (17.9) Medical history Absence 266 (43.0) 314 (50.8) 38 (6.2) 418 (48.5) 394 (45.7) 50 (5.8)* Existence 186 (41.7) 225 (50.4) 35 (7.9) 177 (45.2) 177 (45.2) 38 (9.6) Drinking status Never 127 (48.1) 115 (43.6) 22 (8.3)* 697 (50.3) 568 (41.0) 120 (8.7)**
Past 62 (44.6) 61 (43.9) 16 (11.5) 14 (41.2) 16 (47.1) 4 (11.7) Current 527 (41.4) 667 (52.4) 80 (6.2) 169 (36.6) 260 (56.3) 33 (7.1) Smoking status Never 180 (44.1) 201 (49.3) 27 (6.6) 810 (47.0) 771 (44.7) 142 (8.3) Past 184 (43.0) 213 (49.8) 31 (7.2) 11 (40.7) 12 (44.4) 4 (14.9) Current 341 (41.4) 420 (51.0) 63 (7.6) 19 (32.8) 29 (50.0) 10 (17.2) Physical activity Exercise rarely 521 (41.9) 623 (50.1) 99 (8.0) 798 (46.8) 765 (44.9) 142 (8.3)
Exercise ≥ 1 h/week 146 (42.2) 181 (52.3) 19 (5.5) 118 (48.4) 104 (42.6) 22 (9.0) Sleep duration, h ≥ 7 and < 9 503 (43.1) 590 (50.5) 75 (6.4) 665 (47.7) 629 (45.1) 101 (7.2)**
< 7 118 (39.3) 159 (53.0) 23 (7.7) 258 (44.4) 271 (46.6) 52 (9.0) ≥ 9 82 (43.4) 86 (45.5) 21 (11.1) 54 (45.4) 43 (36.1) 22 (18.5) BMI ≥ 18.5 and < 25 532 (42.6) 628 (50.2) 90 (7.2) 679 (46.1) 690 (46.9) 103 (7.0)* < 18.5 33 (45.2) 31 (42.5) 9 (12.3) 55 (51.4) 40 (37.4) 12 (11.2) ≥ 25 112 (40.9) 148 (54.0) 14 (5.1) 189 (45.8) 180 (43.6) 44 (10.6) Breakfast Eat rarely 69 (44.8) 81 (52.6) 4 (2.6) 114 (47.5) 111 (46.3) 15 (6.2)
Eat 655 (42.4) 769 (49.8) 119 (7.8) 903 (47.1) 849 (44.3) 164 (8.6) Education Age at graduation of < 18 years 457 (43.2) 529 (50.0) 72 (6.8) 608 (48.2) 555 (44.0) 99 (7.8) Higher age at final graduation 194 (40.1) 249 (51.4) 41 (8.5) 316 (44.5) 325 (45.8) 69 (9.7) Job status Unemployed 118 (44.7) 104 (39.4) 42 (15.9)** 412 (48.1) 333 (38.9) 111 (13.0)**
Employed-worker or
self-employed worker 303 (40.3) 402 (53.5) 46 (6.2) 359 (46.6) 378 (49.1) 33 (4.3) Farmer 251 (43.7) 296 (51.6) 27 (4.7) 116 (40.7) 153 (53.7) 16 (5.6) Marital status Single, divorced or widowed 50 (46.3) 40 (37.0) 18 (16.7)** 129 (41.9) 131 (42.5) 48 (15.6)**
Living with a spouse 510 (40.4) 667 (52.9) 84 (6.7) 631 (46.4) 632 (46.4) 98 (7.2) Ikigai Maybe yes or unknown 418 (47.5) 378 (42.9) 85 (9.6)** 719 (51.0) 570 (40.4) 121 (8.6)**
Definitely yes or yes 284 (36.6) 457 (58.8) 36 (4.6) 252 (37.7) 365 (54.6) 51 (7.7) Psychological Maybe yes 523 (48.4) 489 (45.2) 69 (6.4)** 739 (52.3) 576 (40.8) 96 (6.9)** stress Definitely yes or yes 101 (25.1) 280 (69.5) 22 (5.4) 136 (30.3) 288 (43.1) 25 (26.6)
No 79 (44.9) 68 (38.6) 29 (16.5) 98 (43.9) 72 (32.3) 53 (23.8) Feeling of Maybe yes 492 (45.1) 537 (49.2) 63 (5.7)** 683 (50.7) 589 (43.7) 75 (5.6)** being trusted Definity yes or yes 94 (32.1) 188 (64.2) 11 (3.7) 88 (33.2) 166 (62.6) 11 (4.2)
No 125 (43.1) 117 (40.3) 48 (16.6) 216 (44.8) 179 (37.1) 87 (18.1) Life satisfaction Maybe yes 318 (41.8) 390 (51.4) 52 (6.8)* 475 (53.0) 365 (40.7) 57 (6.3)**
Definitely yes or yes 156 (42.4) 195 (53.0) 17 (4.6) 124 (38.9) 169 (53.0) 26 (8.1) No 231 (43.6) 247 (46.6) 52 (9.8) 383 (43.8) 403 (46.1) 88 (10.1) BMI, body mass index.
*P < 0.05. **P < 0.001.
Women respondents showed no significant results (P >
0.05) for any of the above adjustments.
Psychological stress
No significant association was found between
psycho-logical stress and mortality risk from all causes for both
sexes across all of the adjustments described above.
Sense of hurry
Respondents who reported that they had a sense of hurry
in completing their daily work had a reduced risk of
mor-tality from all causes after adjusting for age (HR = 0.78)
compared with those who reported “maybe.” However,
multivariate analyses were not significant (P > 0.05) in
men. In addition, there was no significant association (P >
0.05) between sense of hurry and mortality risk from all
causes among women.
Table 4. Selected baseline characteristics of the subjects according to feeling of being trusted by sex Feeling of being trusted
Men Women
Maybe Definitely Maybe Definitely yes yes or yes No yes yes or yes No
n (%) n (%) n (%) n (%) n (%) n (%)
Age, yr 40–49 216 (65.3) 62 (18.7) 53 (16.0) 261 (65.3) 57 (14.3) 82 (20.4) 50–59 380 (65.0) 103 (17.6) 102 (17.4) 469 (63.9) 100 (13.6) 165 (22.5) 60–69 362 (66.7) 84 (15.5) 97 (17.8) 424 (65.1) 73 (11.2) 154 (23.7) 70–79 143 (60.1) 45 (18.9) 50 (21.0) 211 (62.4) 36 (10.7) 91 (26.9) Medical history Absence 415 (67.6) 108 (17.6) 91 (14.8) 570 (66.9) 107 (12.6) 175 (20.5) Existence 276 (62.0) 94 (21.1) 75 (16.9) 242 (61.9) 63 (16.1) 86 (22.0) Drinking status Never 159 (60.7) 44 (16.8) 59 (22.5) 904 (65.9) 160 (11.7) 307 (22.4)*
Past 93 (66.4) 25 (17.9) 22 (15.7) 15 (44.1) 5 (14.7) 14 (41.2) Current 837 (65.7) 222 (17.4) 215 (16.9) 293 (63.8) 72 (15.7) 94 (20.5) Smoking status Never 270 (66.2) 69 (16.9) 69 (16.9) 1111 (65.1) 223 (13.1) 373 (21.8)*
Past 273 (63.6) 81 (18.9) 75 (17.5) 17 (63.0) 4 (14.8) 6 (22.2) Current 534 (65.0) 138 (16.8) 150 (18.2) 26 (45.6) 9 (15.8) 22 (38.6) Physical activity Exercise rarely 805 (64.8) 202 (16.3) 235 (18.9)* 1069 (63.3) 209 (12.4) 412 (24.3)*
Exercise ≥ 1 h/week 229 (66.0) 75 (21.6) 43 (12.4) 163 (67.6) 37 (15.4) 41 (17.0) Sleep duration, h ≥ 7 and < 9 765 (65.4) 215 (18.4) 190 (16.2)** 908 (65.6) 167 (12.1) 309 (22.3)*
< 7 195 (65.4) 56 (18.8) 47 (15.8) 345 (61.1) 89 (15.8) 131 (23.1) ≥ 9 116 (61.0) 18 (9.5) 56 (29.5) 74 (62.2) 6 (5.0) 39 (32.8) BMI ≥ 18.5 and < 25 803 (64.2) 231 (18.5) 216 (17.3) 937 (64.4) 182 (12.5) 337 (23.1) < 18.5 46 (62.2) 8 (10.8) 20 (27.0) 72 (67.9) 11 (10.4) 23 (21.7) ≥ 25 186 (68.4) 47 (17.3) 39 (14.3) 258 (63.1) 62 (15.2) 89 (21.7) Breakfast Eat rarely 103 (66.5) 29 (18.7) 23 (14.8) 143 (60.9) 27 (11.5) 65 (27.6) Eat 998 (64.7) 265 (17.2) 279 (18.1) 1222 (64.7) 239 (12.7) 427 (22.6) Education Age at graduation of < 18 years 684 (65.1) 185 (17.6) 182 (17.3) 803 (64.7) 161 (13.0) 278 (22.3) Higher age at final graduation 314 (64.1) 83 (16.9) 93 (19.0) 440 (62.9) 90 (12.9) 170 (24.2) Job status Unemployed 173 (63.6) 31 (11.4) 68 (25.0)** 529 (62.5) 96 (11.3) 222 (26.2)*
Employed-worker or
self-employed worker 482 (64.3) 158 (21.1) 110 (14.6) 494 (65.3) 111 (14.7) 152 (20.0) Farmer 366 (64.7) 97 (17.1) 103 (18.2) 189 (66.8) 35 (12.4) 59 (20.8) Marital status Single, divorced or widowed 70 (64.2) 10 (9.2) 29 (26.6)* 176 (58.1) 28 (9.2) 99 (32.7)**
Living with a spouse 806 (63.9) 254 (20.1) 201 (16.0) 881 (65.3) 193 (14.3) 275 (20.4) Ikigai Maybe yes or unknown 593 (66.9) 71 (8.0) 222 (25.1)** 910 (65.7) 102 (7.3) 374 (27.0)**
Definitely yes or yes 487 (62.9) 217 (28.0) 70 (9.1) 403 (61.1) 160 (24.2) 97 (14.7) Psychological Maybe yes 747 (69.3) 156 (14.5) 175 (16.2)** 949 (68.5) 147 (10.6) 289 (20.9)** stress Definitely yes or yes 223 (55.2) 102 (25.2) 79 (19.6) 260 (58.4) 79 (17.8) 106 (23.8)
No 112 (62.2) 33 (18.3) 35 (19.5) 116 (51.3) 37 (16.4) 73 (32.3) Sense of hurry Maybe yes 492 (69.2) 94 (13.2) 125 (17.6)** 683 (69.2) 88 (8.9) 216 (21.9)**
Definitely yes, or yes 537 (63.8) 188 (22.3) 117 (13.9) 589 (63.1) 166 (17.8) 179 (19.1) No 63 (51.6) 11 (9.0) 48 (39.4) 75 (43.4) 11 (6.4) 87 (50.2) Life satisfaction Maybe yes 533 (70.2) 106 (14.0) 120 (15.8)** 613 (68.8) 93 (10.4) 185 (20.8)**
Definitely yes or yes 225 (61.1) 116 (31.5) 27 (7.4) 216 (68.1) 69 (21.8) 32 (10.1) No 319 (59.8) 68 (12.8) 146 (27.4) 502 (58.0) 99 (11.4) 265 (30.6) BMI, body mass index.
*P < 0.05. **P < 0.001.
Feeling of being trusted
Men who had feeling of being trusted had a decreased
mortality risk from all causes compared with those who
reported “maybe,” whereas in those who lacked the feeling
of being trusted, mortality risk from all causes increased
(age-adjusted HR = 1.59, multivariate HR = 1.67).
How-ever, there was no significant difference among women.
Life satisfaction
There was no significant association between feeling of
life satisfaction and mortality risk from all causes for
both sexes across all adjustments as described above.
Table 5. Selected baseline characteristics of the subjects according to life satisfaction by sex Life satisfaction
Men Women
Maybe Definitely Maybe Definitely yes yes or yes No yes yes or yes No
n (%) n (%) n (%) n (%) n (%) n (%)
Age, yr 40–49 143 (42.8) 56 (16.8) 135 (40.4)** 166 (41.5) 45 (11.3) 189 (47.2)** 50–59 291 (50.3) 101 (17.5) 186 (32.2) 299 (40.5) 108 (14.6) 331 (44.9) 60–69 225 (42.1) 150 (28.0) 160 (29.9) 297 (46.2) 98 (15.2) 248 (38.6) 70–79 109 (47.0) 65 (28.0) 58 (25.0) 146 (43.1) 72 (21.2) 121 (35.7) Medical history Absence 278 (45.6) 130 (21.3) 202 (33.1) 388 (45.5) 130 (15.3) 334 (39.2)*
Existence 215 (48.3) 94 (21.1) 136 (30.6) 168 (43.2) 43 (11.1) 178 (45.7) Drinking status Never 130 (50.4) 45 (17.4) 83 (32.2) 603 (44.2) 210 (15.4) 550 (40.4)
Past 52 (37.7) 39 (28.3) 47 (34.0) 16 (47.1) 1 (2.9) 17 (50.0) Current 579 (45.8) 281 (22.2) 403 (32.0) 180 (39.3) 65 (14.2) 213 (46.5) Smoking status Never 192 (47.8) 90 (22.4) 120 (29.8) 738 (43.4) 253 (14.9) 708 (41.7)
Past 181 (42.7) 95 (22.4) 148 (34.9) 16 (57.1) 4 (14.3) 8 (28.6) Current 380 (46.4) 175 (21.4) 264 (32.2) 17 (30.9) 9 (16.4) 29 (52.7) Physical activity Exercise rarely 576 (46.8) 247 (20.0) 409 (33.2)* 722 (43.0) 238 (14.2) 721 (42.8) Exercise ≥ 1 h/week 145 (42.0) 95 (27.5) 105 (30.5) 98 (40.3) 42 (17.3) 103 (42.4) Sleep duration, h ≥ 7 and < 9 541 (46.7) 250 (21.6) 368 (31.7) 611 (44.6) 204 (14.9) 556 (40.5) < 7 122 (40.9) 71 (23.8) 105 (35.3) 226 (39.2) 89 (15.5) 261 (45.3) ≥ 9 90 (48.1) 42 (22.5) 55 (29.4) 45 (39.1) 22 (19.1) 48 (41.8) BMI ≥ 18.5 and < 25 567 (45.8) 283 (22.8) 389 (31.4) 617 (42.6) 219 (15.1) 614 (42.3)
< 18.5 37 (50.7) 11 (15.1) 25 (34.2) 43 (40.6) 12 (11.3) 51 (48.1) ≥ 25 116 (42.8) 58 (21.4) 97 (35.8) 179 (44.1) 62 (15.3) 165 (40.6) Breakfast Eat rarely 72 (46.2) 32 (20.5) 52 (33.3) 97 (41.8) 34 (14.7) 101 (43.5) Eat 696 (45.7) 340 (22.3) 487 (32.0) 811 (43.0) 289 (15.3) 788 (41.7) Education Age at graduation of < 18 years 491 (46.9) 227 (21.7) 328 (31.4) 532 (42.9) 181 (14.6) 527 (42.5) Higher age at final graduation 216 (44.8) 95 (19.7) 171 (35.5) 305 (43.6) 110 (15.7) 285 (40.7) Job status Unemployed 112 (41.8) 65 (24.3) 91 (33.9)* 382 (45.0) 149 (17.6) 317 (37.4)**
Employed-worker or
self-employed worker 340 (46.1) 187 (25.3) 211 (28.6) 316 (41.8) 101 (13.4) 339 (44.8) Farmer 265 (46.2) 100 (17.5) 208 (36.3) 101 (35.9) 39 (13.9) 141 (50.2) Marital status Single, divorced or widowed 45 (40.5) 20 (18.0) 46 (41.5) 110 (36.3) 31 (10.2) 162 (53.5)**
Living with a spouse 585 (46.7) 268 (21.4) 401 (31.9) 593 (44.1) 215 (16.0) 538 (39.9) Ikigai Maybe yes or unknown 441 (50.5) 104 (11.9) 329 (37.6)** 632 (45.6) 138 (10.0) 616 (44.4)**
Definitely yes or yes 313 (40.8) 257 (33.5) 198 (25.7) 249 (38.0) 174 (26.5) 233 (35.5) Psychological Maybe yes 531 (50.0) 227 (21.4) 305 (28.6)** 644 (46.5) 220 (15.9) 521 (37.6)** stress Definitely yes or yes 152 (37.8) 83 (20.6) 167 (41.6) 157 (35.3) 38 (8.5) 250 (56.2)
No 67 (37.2) 54 (30.0) 59 (32.8) 77 (35.3) 56 (25.7) 85 (39.0) Sense of hurry Maybe yes 318 (45.1) 156 (22.1) 231 (32.8)* 475 (48.4) 124 (12.6) 383 (39.0)**
Definitely yes or yes 390 (46.9) 195 (23.4) 247 (29.7) 365 (39.0) 169 (18.0) 403 (43.0) No 52 (43.0) 17 (14.0) 52 (43.0) 57 (33.3) 26 (15.2) 88 (51.5) Feeling of
being trusted Maybe yes 533 (49.5) 225 (20.9) 319 (29.6)** 613 (46.1) 216 (16.2) 502 (37.7)** Definitely yes or yes 106 (36.6) 116 (40.0) 68 (23.4) 93 (35.6) 69 (26.5) 99 (37.9) No 120 (41.0) 27 (9.2) 146 (49.8) 185 (38.4) 32 (6.6) 265 (55.0) BMI, body mass index.
*P < 0.05. **P < 0.001.
DISCUSSION
In this study of Japanese men and women from 40 to
79 years, those who denied a feeling of being trusted
showed an increased mortality risk from all causes.
However, among both men and women who reported
having ikigai, psychological stress, sense of hurry or life
satisfaction, the relationship to mortality risk from all
causes was not significant.
Previous studies
1–9reported that the presence of
ikigai
decreased mortality risk from all causes. But, the
present study did not support the results of these
stud-ies, presumably because the adjusted confounders in the
studies
1, 2, 4–9were less than in our study. Sone et al.
3Table 7. Age-adjusted and multivariate HRs and 95% CIs for death according to psychological factors among men
Dead
Alive Observed HR [95% CI]
n (%) n (%) person-years Age-adjusted HR Multivariate HR Do you have “ikigai” in your life? 1,239 (100.0) 439 (100.0)
Maybe yes or unknown 620 (50.0) 276 (62.9) 2,996 1.00 1.00
Definitely yes or yes 619 (50.0) 163 (37.1) 1,855 0.64 [0.53–0.78]** 0.76 [0.56–1.04] Do you feel stress during your daily life? 1,249 (100.0) 432 (100.0)
Maybe yes 794 (63.6) 297 (68.7) 3,321 1.00 1.00
Definitely yes or yes 327 (26.2) 81 (18.8) 895 0.97 [0.76–1.24] 0.85 [0.57–1.26]
No 128 (10.2) 54 (12.5) 559 1.01 [0.76–1.34] 0.95 [0.59–1.53]
Do you hurry to complete your daily work? 1,255 (100.0) 442 (100.0)
Maybe yes 515 (41.0) 209 (47.3) 2,297 1.00 1.00
Definitely yes or yes 660 (52.6) 190 (43.0) 2,154 0.78 [0.65–0.94]* 0.80 [0.58–1.09]
No 80 (6.4) 43 (9.7) 426 1.20 [0.87–1.65] 0.73 [0.40–1.33]
Do you feel you are trusted by someone? 1,249 (100.0) 448 (100.0)
Maybe yes 830 (66.5) 271 (60.5) 3,034 1.00 1.00
Definitely yes or yes 225 (18.0) 69 (15.4) 763 0.81 [0.63–1.05] 0.76 [0.50–1.16] No 194 (15.5) 108 (24.1) 1,133 1.59 [1.28–1.97]** 1.67 [1.13–2.45]* Do you wish you could live your life over again? 1,240 (100.0) 439 (100.0)
Maybe yes 574 (46.3) 194 (44.2) 2,154 1.00 1.00
Definitely yes or yes 255 (20.6) 117 (26.7) 1,320 1.10 [0.89–1.36] 1.10 [0.75–1.61] No 411 (33.1) 128 (29.1) 1,352 1.04 [0.84–1.28] 0.97 [0.67–1.39] BMI, body mass index; CI, confidence interval; HR, hazard ratio.
† Multivariate HR was adjusted for age, medical history‡ (yes or no), education (age at graduation of < 18 years or higher age at final graduation), job status (unemployed, employed or farmer), marital status (living with a spouse or other), drinking status (current drinker, past drinker or non-drinker), smoking status (current smoker, past smoker or non-smoker), physical activity (exercise ≥ 1 h/week or exercise rarely), sleep duration (< 7 h, ≥ 7 and < 9 h, ≥ 9 h), BMI (< 18.5, ≥ 18.5 and < 25, ≥ 25) and breakfast (eat or eat rarely).
‡ Medical history: stroke, hypertension, myocardial infarction, kidney disease, liver disease, cholecystitis or cholelithiasis, diabetes mellitus, gastric ulcer or duodenal ulcer, tuberculosis or pleurisy or cancer.
* P < 0.05. ** P < 0.001.
Table 6. Correlation coefficients between psychological factors by sex
Psychological stress Sense of hurry Feeling of being trusted Life satisfaction
Men Ikigai –0.003 0.167** 0.304** 0.223**
Psychological stress 0.211** 0.046 –0.084**
Sense of hurry 0.163** 0.063**
Feeling of being trusted 0.229**
Women Ikigai –.093** 0.122** 0.226** 0.152**
Psychological stress 0.218** 0.044* –0.152**
Sense of hurry 0.169** 0.023
Feeling of being trusted 0.163**
* P < 0.05. ** P < 0.001.
found that the mortality risk of all causes was
signifi-cantly higher among subjects who had no ikigai after
adjustment of age, sex, marital status, education, job,
self-rated health, perceived mental stress, physical
func-tion, BMI, smoking, alcohol consumpfunc-tion, time spent
walking, sleep duration and medical history. The study
had a larger number of subjects, a larger number of
de-cedents and more adjusted confounding factors than the
present study. The reason for the different results may be
explained by the difference in classification of levels of
psychological factors and the reference group.
As for psychological stress, sense of hurry and life
satisfaction, the classification of levels of psychological
factors in a prior study
1was the same as in the present
study. But our study did not support their results except
age-adjusted sense of hurry among men and women.
The cause may be the difference of number of adjusted
confounding factors in the analysis.
Table 8. Age-adjusted and multivariate HRs and 95% CIs for death according to psychological factors among women
Dead
Alive Observed HR [95% CI]
n (%) n (%) person-years Age-adjusted HR Multivariate HR Do you have “ikigai” in your life? 1,832 (100.0) 268 (100.0)
Maybe yes or unknown 1,243 (67.8) 187 (69.8) 2,097 1.00 1.00
Definitely yes or yes 589 (32.2) 81 (30.2) 912 0.99 [0.76–1.29] 1.10 [0.67–1.78] Do you feel stress during your daily life? 1,841 (100.0) 265 (100.0)
Maybe yes 1,233 (67.0) 190 (71.7) 2,155 1.00 1.00
Definitely yes or yes 416 (22.6) 38 (14.3) 420 0.90 [0.63–1.28] 0.84 [0.43–1.63]
No 192 (10.4) 37 (14.0) 398 0.98 [0.69–1.40] 1.04 [0.56–1.95]
Do you hurry to complete your daily work? 1,883 (100.0) 274 (100.0)
Maybe yes 885 (47.0) 133 (48.5) 1,467 1.00 1.00
Definitely yes or yes 865 (45.9) 95 (34.7) 1,086 0.82 [0.64–1.05] 0.82 [0.50–1.33]
No 133 (7.1) 46 (16.8) 520 1.46 [1.06–2.02]* 0.79 [0.38–1.61]
Do you feel you are trusted by someone? 1,851 (100.0) 273 (100.0)
Maybe yes 1,201 (64.9) 164 (60.1) 1,821 1.00 1.00
Definitely yes or yes 237 (12.8) 30 (11.0) 360 0.82 [0.56–1.20] 1.33 [0.67–2.62]
No 413 (22.3) 79 (28.9) 903 1.07 [0.78–1.46] 1.54 [0.93–2.53]
Do you wish you could live your life over again? 1,857 (100.0) 264 (100.0)
Maybe yes 801 (43.1) 107 (40.5) 1,226 1.00 1.00
Definitely yes or yes 275 (14.8) 48 (18.2) 517 1.07 [0.78–1.46] 1.24 [0.61–2.54] No 781 (42.1) 109 (41.3) 1,204 1.18 [0.92–1.50] 1.35 [0.83–2.20] BMI, body mass index; CI, confidence interval; HR, hazard ratio.
† Multivariate HR was adjusted for age, medical history‡ (yes or no), education (age at graduation of < 18 years or higher age at final graduation), job status (unemployed, employed or farmer), marital status (living with a spouse or other), drinking status (current drinker, past drinker or non-drinker), smoking status (current smoker, past smoker or non-smoker), physical activity (exercise ≥ 1 h/week or exercise rarely), sleep duration (< 7 h, ≥ 7 and < 9 h, ≥ 9 h), BMI (< 18.5, ≥ 18.5 and < 25, ≥ 25) and breakfast (eat or eat rarely).
‡ Medical history: stroke, hypertension, myocardial infarction, kidney disease, liver disease, cholecystitis or cholelithiasis, diabetes mellitus, gastric ulcer or duodenal ulcer, tuberculosis or pleurisy or cancer.
* P < 0.05.
We found associations between feeling of being
trusted and mortality risk from all causes only among
men. According to Tanno and Sakata,
1the mortality risk
from all causes for those who had no feeling of being
trusted increased 1.19 times for men and 1.17 times for
women compared with the risk for those who reported
“maybe” to the feeling of being trusted. Sakata et al.
4showed that only among women, the mortality risk from
all causes in those who had no feeling of being trusted
increased compared with in those who had. We included
some adjustment factors such as life style habits and
so-cial factors to our analysis, and found more meaningful
results relevant to feeling of being trusted and mortality
risk.
The mechanism which underlies the preventive
effects of feeling of being trusted on mortality risk
re-mains unclear. However, we have identified some
pos-sible explanations. There are domestic and international
reports on the effectiveness of talking and visiting with
friends and others through the participation in
neigh-borhood and other social activities on preventing the
aggravation of longevity prognoses.
24–28During the
6-year interval, having poor self-rated health and poor
social roles were identified as significant predictors for
total mortality among both men and women.
26In
addi-tion, an 8-year follow-up study that surveyed 519
home-bound elderly people aged 65 and over reported that
male elderly individuals who did not leave their home
for travel, picnics or brief outings had a higher mortality
risk compared with those who did go out regularly. As
for women, because they often assume the roles of both
housewife and mother, it is predicted that compared
with males, continued opportunities for interactions
with others are beneficial until the individual becomes
senile.
27The feeling of being trusted, along with having
opportunities for interpersonal relationships and certain
roles, is considered an important factor in enjoying and
sustaining a healthy end-of-life period. In addition, to
prevent isolation or loneliness of individuals who retired,
community’s support is considered necessary in
main-taining interpersonal relations and having certain roles,
especially among men.
There are several limitations to this study. First, the
feeling of being trusted was evaluated by a single
ques-tion. Thus, because of the lack of contextual information
available to the respondents, we feel that the question
could be interpreted in both positive and negative ways.
Therefore, the reliability and validity of the questions
used in the present study should be more carefully
eval-uated. Second, because we assessed only one point in
time, changes in psychological status were not evaluated.
A previous study on the association between changes in
ikigai
and mortality risk over a period of 6 years,
howev-er, showed that the loss of ikigai during the 6-year
inter-val resulted in an increased risk of mortality.
7Therefore,
such possible effects of changes in psychological status
over time need to be considered when evaluating our
present results. In addition, because psychological
fac-tors used in the present study were weak in correlation,
the factors should be further investigated with regard to
the effects of mortality risk, independently.
In conclusion, the present results suggest that the
ab-sence of feeling of being trusted increases the mortality
risk of all causes among middle-aged and elderly men
in rural areas. Our findings further suggest that
interper-sonal relationships comprise an important factor in
hav-ing a long life.
Acknowledgments: We are grateful to Professor Yoneatsu Osaki, Division of Environmental and Preventive Medicine, Department of Social Medicine, School of Medicine, Tottori University Facul-ty of Medicine, and Professor Shin-ichi Yoshioka, Department of Nursing Care Environment and Mental Health, School of Health Science, Tottori University Faculty of Medicine, for their helpful suggestions. We acknowledge the residents of Nichinan-town who cooperated with the investigation.
The investigation of the baseline is based on the JACC study supported by Grants-in-aid (11181101) for Scientific Research from the Ministry of Education, Culture, Sports, Science and Technol-ogy of Japan.
The authors declare no conflict of interest. REFERENCES
1 Tanno K, Sakata K. Psychological factors and mortality in the Japan Collaborative Cohort Study for Evaluation of Can-cer (JACC). Asian Pac J CanCan-cer Prev. 2007;8 Suppl:113-22. PMID: 18260710.
2 Tanno K, Sakata K, Ohsawa M, Onoda T, Itai K, Yaegashi Y, et al. Associations of ikigai as a positive psychological factor with all-cause mortality and cause-specific mortality among middle-aged and elderly Japanese people: findings from the Japan Collaborative Cohort Study. J Psychosom Res. 2009;67(Pt 1):67-75. PMID: 19539820.
3 Sone T, Nakaya N, Ohmori K, Shimazu T, Higashiguchi M, Kakizaki M, et al. Sense of life worth living (ikigai) and mor-tality in Japan: Ohsaki Study. Psychosom Med. 2008;70:709-15. PMID: 18596247.
4 Sakata K, Yoshimura N, Tamaki J, Hashimoto T. [Associations between ikigai, stress, and feeling of being trusted and
mortal-ity from cardiovascular disease and cancer]. Kosei No Shihyo. 2002;49:14-8. Japanese.
5 Seki N. Relationships between walking hours, sleeping hours, meaningfulness of life (ikigai) and mortality in the elderly: prospective cohort study. Nihon Eiseigaku Zasshi. 2001;56:535-40. Japanese with English abstract. PMID: 11519188
6 Nakanishi N, Nakura I, Nagano K, Yoneda H, Takatorige T, Shinsho F, et al. Mortality in relation to the type of household among elderly people living in a community. J Epidemiol. 1998;8:65-72. PMID: 9575698.
7 Nakanishi N, Fukuda H, Tatara K. Changes in psychosocial conditions and eventual mortality in community-residing el-derly people. J Epidemiol. 2003;13:72-9. PMID: 12675115. 8 Yoshioka T, Iwai N, Ohshiro H, Kurozawa Y, Morita S. A
cohort study of lifestyle in a rural area—Relationship between mortality and lifestyle—.Yonago Igaku Zasshi. 1997;48:164-70. Japanese with English abstract.
9 Tanigaki S, Hosoda T, Kurozawa Y. Factors related to suc-cessful aging in a community elderly population. Yonago Igaku Zasshi. 2005;56:177-87. Japanese with English abstract. 10 Blazer DG, Hybels CF. What symptoms of depression predict
mortality in community-dwelling elders? J Am Geriatr Soc. 2004;52:2052-6. PMID: 15571541.
11 Koivumaa-Honkanen H, Honkanen R, Viinamaki H, Heikkila K, Kaprio J, Koskenvuo M. Self-reported life satisfaction and 20-year mortality in healthy Finnish adults. Am J Epidemiol. 2000;152:983-91. PMID: 11092440.
12 Pitkala KH, Laakkonen ML, Strandberg TE, Tilvis RS. Posi-tive life orientation as a predictor of 10-year outcome in an aged population. J Clin Epidemiol. 2004;57:409-14. PMID: 15135844.
13 Ostir GV, Markides KS, Black SA, Goodwin JS. Emotional well-being predicts subsequent functional independence and survival. J Am Geriatr Soc. 2000;48:473-8. PMID: 10811538. 14 Giltay EJ, Geleijnse JM, Zitman FG, Hoekstra T, Schouten
EG. Dispositional optimism and all-cause and cardiovascu-lar mortality in a prospective cohort of elderly Dutch men and women. Arch Gen Psychiatry. 2004;61:1126-35. PMID: 15520360.
15 Greenwood DC, Muir KR, Packham CJ, Madeley RJ. Coro-nary heart disease: a review of the role of psychosocial stress and social support. J Public Health Med. 1996;18:221-31. PMID: 8816321.
16 Harmsen P, Lappas G, Rosengren A, Wilhelmsen L. Long-term risk factors for stroke: twenty-eight years of follow-up of 7457 middle-aged men in Goteborg, Sweden. Stroke. 2006;37:1663-7. PMID: 16728686.
17 Truelsen T, Nielsen N, Boysen G, Gronbaek M. Self-reported stress and risk of stroke: the Copenhagen City Heart Study. Stroke. 2003;34:856-62. PMID: 12637696.
18 Iso H, Date C, Yamamoto A, Toyoshima H, Tanabe N, Kikuchi S, et al. Perceived mental stress and mortality from cardiovascular disease among Japanese men and women: the Japan Collaborative Cohort Study for Evaluation of Cancer Risk Sponsored by Monbusho (JACC Study). Circulation. 2002;106:1229-36. PMID: 12208798.
19 Cole SR, Kawachi I, Liu S, Gaziano JM, Manson JE, Buring JE, et al. Time urgency and risk of non-fatal myocardial in-farction. Int J Epidemiol. 2001;30:363-9. PMID: 11369743. 20 National census: Time series data (Tottori Prefecture )
[In-ternet]. Japan: Tottori Prefecture Web Site; [cited 2014 Jan 8]. Available from: http://www.pref.tottori.lg.jp/174413.htm.
21 Nichinan Town Official Web Site [internet]. Japan: Statisti-cal materials about Nichinan Town. Available from: http:// www.town.nichinan.tottori.jp/system/site/upload/live/318/ atc_1267204728.pdf.
22 Tamakoshi A, Yoshimura T, Inaba Y, Ito Y, Watanabe Y, Fukuda K, et al. Profile of the JACC Study. J Epidemiol. 2005;15 Suppl 1:S4-8. PMID: 15881191.
23 Ohno Y, Tamakoshi A; JACC Study Group. Japan collab-orative cohort study for evaluation of cancer risk sponsored by Monbusho (JACC Study). J Epidemiol. 2001;11:144-50. PMID: 11512570.
24 Okado J, Hoshi T. [Influence of the life prognosis on the el-derly people by social network]. Kosei No Shihyo. 2002;49:19-23. Japanese.
25 Hoshi T, Kurimori S, Ino Y, Takahashi T, Hasegawa T, Tomoyama G, et al. [Relation of the pleasure relevant to
plants, the actual condition of ikigai (definite aim in life) and subjective health among a urban area-residing elderly people]. Kosei No Shihyo. 2002; 56(Pt 4):16-21. Japanese.
26 Ishizaki T, Kai I, Imanaka Y. Self-rated health and social roles as predictor for 6-year total mortality among a non-disabled older Japanese population. Arch Gerontol Geriatr. 2006;42:91-9. PMID: 16046010.
27 Tomoyama G, Hoshi T, Saito M. Relation between personal interactions and life expectancy for the aged residing in moun-tainous areas. Gunma Kenritsu Tankidaigaku Kiyo. 2010;5:1-9. Japanese with English abstract.
28 Bleslow L, Berkman L. Health and ways of living—The Alameda County Study—. New York: Oxford University Press; 1983. Morimoto K, translator. Tokyo: HBJ; 1989. 207 p. Japanese.