Basic Characteristics of Small Island
Economies in the South Pacific : A Case Study
of Fiji
著者
IWAKIRI Shigero, RAM Vina
journal or
publication title
鹿児島大学水産学部紀要=Memoirs of Faculty of
Fisheries Kagoshima University
volume
38
number
1
page range
1-31
別言語のタイトル
南太平洋小島嶼国経済の基本的性格
Mem. Fac. Fish. Kagoshima Univ., Vol. 38, No. 1, pp. 1-31 (1989)
Basic Characteristics of Small Island
Economies in the South Pacific
—A Case Study of Fiji—
Shigero Iwakiri*1 and Vina Ram*2
Keywards : Subsistence, sugar, monoculture, colonialism, industrialization
Abstract
The small island economies of the South Pacific share several basic problems due to their size and isolation. Many of these problems are multiplied because of the small land masses, lack of basic mineral and industrial raw materials, distances from major metropolitan markets, small domestic markets, diseconomies of scale in production and so on.
Taking into account the basic characteristics of the small isolated island economies of the South Pacific such as maintaining traditional communal structures and a subsistence lifestyle together with varying degrees of industrial progress, the present study therefore does not rely solely on modern economics as methodology for analysis of the structure of island economies, but adopts a wider perspective using the classical tools and principles of economic and social progress.
In this study, the general economics of the island societies have been analysed from the industrial
development point of view, concentrating not only in areas of capitalistic and entrepreneual development but also pointing out the presence ofopposite relations of the backward characteristics
with are existing alongside with this modernised economic system.
1. General Economic Characteristics (1) Fiji Islands - General
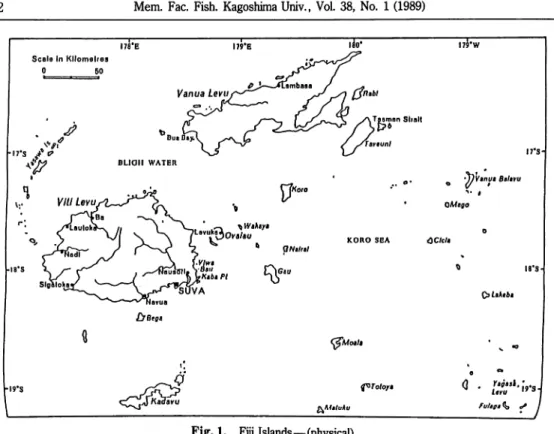
Fiji is a maritime archipelagic country located between 10° and 25° south latitude, and between
176° east and 178° west longitude.
It consists of about 320 islands which make up a land area of
18,272 km2.
Fig. 1 give the geographical location of the islands.
The larger islands are mainly
of volcanic origin whereas the smaller islands are coral formations and have very little productive
soil.Nearly all the islands in the group are surrounded either by fringing or barrier reefs which form
natural breakwaters from the ocean. With the declaration of the 200 mile Exclusive Economic
Zone, Fiji's estimated sea are is about 1,134,700 km2, with territorial water of about 110,355 km2.
Fiji was ceded to Great Britain in 1874 and had British Colonial Government for 96 years.
Many of the present socio-economic structures reflect this colonial influence, such as the political
*l Department of Marine Science, Faculty of Fisheries, Kagoshima University, 50-20 Shimoarata 4, Kagoshima 890, Japan.
Scale In Kilometres
0 SO
I9"S
ylVanva Balavu
OMago
KORO SOA CClcU
I8'S
&Laktba £7 Bega
(^Moala
Q
<^jiwavo
^Maluku f^Totoya Fulaga % «/»Fig. 1. Fiji Islands—(physical).
and constitutional systems, monocultural agriculture of sugar and coconuts, the multi-racial nature of the islands by introduction of migrant labour from India and other Pacific islands, and subordination to former colonial powers, i.e. Australia and New Zealand.
In 1983, the population was 677,481; 32% lived in urban areas of which 20% lived in Suva. During the same year, 60% of the total polulation fell in the economically active age group (15-64) of which 20% were employed under wages and salaries (Bureau of Statistics, 1985: p. 5-76)
Sugar production remains the backbone of the country. Tourism and associated construction and private services have grown considerably in the last decade and this has accelerated the
economic growth after independence.
The manufacturing sector has developed substantially in
an attempt to reduce economic dependency on imports. Fiji's manufacturing sector now appears to be relatively more developed than other South Pacific islands.
On the other hand, Fiji has very limited exploitable quantities of resources for productive
industrial development. Gold is being mined by an Australian based company which exports raw
gold to Australia.
Copper deposits cannot be economically mined underthe present world copper
prices. Insignificant quantities of other minerals such as manganese and bauxite exist which are also uneconomical for industrial exploitation. Major economic resources are agricultural primary commodities such as sugar cane, coconuts, lumber, ginger, cocoa, and coffee.
Fiji has already felt several economic crisis in relation to its exports of sugar and copra with
fluctuations in world prices of the commodities. Besides the lack of basic resources for industrial development, there is a lack of adequate domestic entrepreneurship and capital. This is reflected
Iwakiri and Ram i Small Island Economies
by the dominance of a household economy where there is little incentive towards planned savings.
(2) Economic Structure
a. Gross Domestic Product (GDP) and Industrial Structure
The economic productivity in terms of GDP is given in Table 1 at current prices from 1950 to 1984, which also indicates the annual growth rate and per capita GDP. The per capita GDP doubled within 5 years of independence and had increased steadily during the 1970s, the grew at a
slower rate in the early 1980s. The high growth rate in the 1970s was the result of a change in
Table 1. Gross domestic product (GDP) of Fiji Current prices Year Gross Domestic Product at Current Factor Cost ($ Million) Annual Growth Rate of GDP (%) Estimated Mid-Year Population (000) Per-Capita GDP ($) Annual Growth Rate of GDP Per-Capita (%) 1950 36.0 — 288 125 — 1953 50.8 12.2 318 160 8.6 1957 61.1 4.7 354 173 2.0 1962 90.2 8.1 421 214 4.3 1963 93.9 4.1 435 216 0.1 1964 99.6 6.1 449 222 2.8 1965 104.7 5.1 462 227 2.3 1966 108.8 3.9 474 230 1.3 1967 117.3 7.8 485 242 5.2 1968 129.6 10.5 495 262 8.3 1969 140.5 8.4 506 282 7.6 1970 168.9 20.2 521 324 14.9 1971 184.7 9.3 533 347 7.1 1972 230.5 24.8 544 424 22.2 1973 300.6 30.4 556 541 27.6 1974 410.5 36.6 565 727 34.3 1975 515.4 25.5 576 895 23.1 1976 570.6 10.7 585 975 8.9 1977 605.6 n.a 596 1,016 n.a 1978 642.9 6.1 607 1,059 4.2 1979 779.4 21.2 621 1.255 18.5 1980 901.0 15.6 634 1,421 13.2 1981 953.6 5.8 646 1,476 3.5 1982(r) 1,020.5 7.0 658 1,551 6.6 1983(p) 1,069.5 4.8 672 1,592 1.2 1984(p) 1,230.9 15.1 686 1,794 12.7
Note: (n.a) Not available due to statistical change in base in 1977.
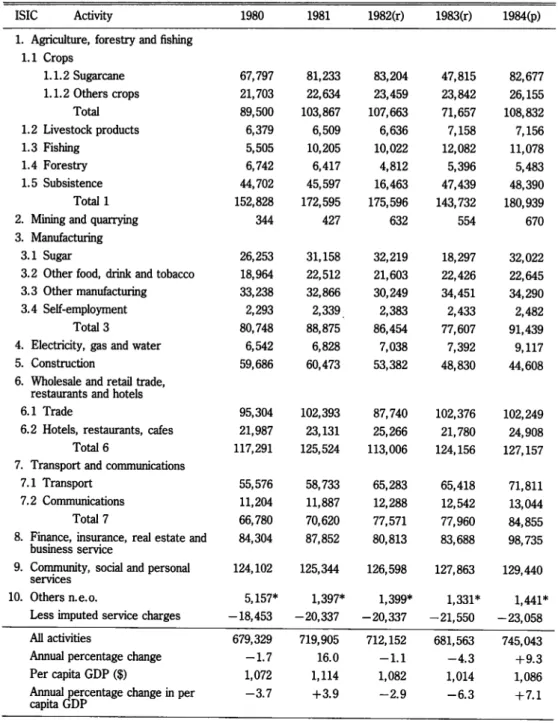
Table 2. Gross domestic product by activity at constant 1977 price at factor cost ($ooo)
ISIC Activity 1980 1981 1982(r) 1983(r) 1984(p)
1. Agriculture, forestry and fishing 1.1 Crops 1.1.2 Sugarcane 67,797 81,233 83,204 47,815 82,677 1.1.2 Others crops 21,703 22,634 23,459 23,842 26,155 Total 89,500 103,867 107,663 71,657 108,832 1.2 Livestock products 6,379 6,509 6,636 7,158 7,156 1.3 Fishing 5,505 10,205 10,022 12,082 11,078 1.4 Forestry 6,742 6,417 4,812 5,396 5,483 1.5 Subsistence 44,702 45,597 16,463 47,439 48,390 Total 1 152,828 172,595 175,596 143,732 180,939
2. Mining and quarrying 344 427 632 554 670
3. Manufacturing
3.1 Sugar 26,253 31,158 32,219 18,297 32,022
3.2 Other food, drink and tobacco 18,964 22,512 21,603 22,426 22,645
3.3 Other manufacturing 33,238 32,866 30,249 34,451 34,290
3.4 Self-employment 2,293 2,339 2,383 2,433 2,482
Total 3 80,748 88,875 86,454 77,607 91,439
4. Electricity, gas and water 6,542 6,828 7,038 7,392 9,117
5. Construction 59,686 60,473 53,382 48,830 44,608
6. Wholesale and retail trade, restaurants and hotels
6.1 Trade 95,304 102,393 87,740 102,376 102,249
6.2 Hotels, restaurants, cafes 21,987 23,131 25,266 21,780 24,908
Total 6 117,291 125,524 113,006 124,156 127,157
7. Transport and communications
7.1 Transport 55,576 58,733 65,283 65,418 71,811
7.2 Communications 11,204 11,887 12,288 12,542 13,044
Total 7 66,780 70,620 77,571 77,960 84,855
8. Finance, insurance, real estate and
business service
84,304 87,852 80,813 83,688 98,735
9. Community, social and personal services
124,102 125,344 126,598 127,863 129,440
10. Others n.e.o. 5,157* 1,397* 1,399* 1,331* 1,441*
Less imputed service charges -18,453 -20,337 -20,337 -21,550 -23,058
All activities 679,329 719,905 712,152 681,563 745,043
Annual percentage change -1.7 16.0 -1.1 -4.3 +9.3
Per capita GDP ($) 1,072 1,114 1,082 1,014 1,086
Annual percentage change in per
capita GDP
-3.7 +3.9 -2.9 -6.3 + 7.1
* Residual
Iwakiri and Ram '• Small Island Economies
goverment policy to promote manufacturing, processing, tourism, and their related construction and service industries. The consequent slower groth was due to its limitation for expansion. Table 2 displays economic activities by sectors. Agriculture, forest and fisheries is an important sector of the GDP. In 1984 it accounted for 24% of the GDP. Like other South Pacific island economies, the subsistence sector is an important component of the GDP. In the same year, 27% of the agricultural sector was estimated to be subsistence which accounted for 6% of the GDP. The high contribution of sugar cane and sugar processing over the indicates the continues reliance on monocultural agriculture. In using GDP estimates as economic indicators for measur ing the standard of living in Fiji, care must be taken of the wide income disparities between the
rural and urban sectors.
Current development policies place emphasis on primary production and processing of agricultu
ral commodities as a result of urban drift from urban based industrial development and the
consequent high income disparities. Sugar production and processing therefore remain the basic factor towards economic growth with tourism and manufacturing as supplementary sectors. Table 3 shows industrial performance in the overall economy in terms of its contribution to the GDP and employment from 1972-1979. In 1979, industries accounted for 17.8% of total
employment,
b. Government Finance and Foreign Exchange
The government's ability to provide basic services and development depends on funds which can be mobilised by taxation, local and overseas borrowing, and foreign aid. Main sources of government revenue have been through income tax, estate and gift duties, and customs duties. In 1984, 45% of the government revenue was been through income tax and 33% from customs
duties.
Table 3. Contribution of the industrial sector to the economy
(1972-1979) 1972 1975 1976 1977 1978 1979 Value added(1) ($M) Gross domestic product (GDP) 214.2 233.9 242.8 262.1 274.8 296.3 Total value added by sector 28.1 31.2 33.6 38.0 39.1 45.4 Value added as % of GDP 13.-11 13.34 13.84 14.50 14.23 15.32 Average annual growth in value added
— 3.4 7.7 13.1 2.9 16.1
Employment
Total employment (TE) 58,399 72,769 72,607 72,666 72,232 79,865
Employment in sector 9,828 12,155 11,043 13,384 13,156 14,236
Sector employment as
% of TE
16.8 16.7 15.7 18.4 17.0 17.8
Notes: (1) In 1972 constant prices.
The dependence of government revenue on income tax indicates the small earnings of the industrial and corporate sector. This is commonly the case in developing economies which lack the generation of revenue from other sources of government capital investment.
Government speding patterns are generally comprised of salaries, wages, and operational costs.
However, with the drive towards achieving higher economic growth through emphasis on
secondary and tertiary industries, the government's capital expenditure has caused high deficit
over the years and has increased the government's foreign and domestic borrowing.
Govern
ment policyto stimulate investment in manufacturing, construction and related industries includes
tax holidays, for companies, import duty concessions and so on. Thus, this policy also means
that the government has forego certain amount of revenue inthe hope for long term development
benefits.
Table 4 gives an indication of the increase in foreign loans for public investment.
Soft loans
have been declining relative to foreign commercial loans on which theinterest rates are higher and
therefore costly in terms of debt serving in the future.
The government outstanding debt
(external) in 1984 was $166.8 million consisting of multilateral, bilateral and commercial loans,
accounting for 38% of overall external debt (Reserve Bank of Fiji, 1984. p. 43 and 99.).
The
Eighth Development Plan projection estimated that by 1985, the foreign private capital borrowing
would be reduced to 20% compared to the Seventh Development Plan projection of 50% and that
government borrowing would increase.
Appendix table 1 presents the government's local and
foreign borrowing.
Table 4. Foreign revenues for public investment, 1971-1989 ($ million)
Source
1971 (%) 1976 (%) 1977 (%) 1978 (%) 1979 (%) 1980 (%)
Soft loans
World Bank loans
11.8 (33.9) 3.8 (30.0) 4.4 (18.8) 2.5 (23.8) 1.4
(4.4) 1.6
(6.0)
I.M.F. loans 2.5 (7.2)
E.E.C. loans
0.6
(4.7) 1.6
(4.8) —
(0) 2.0
(6.2) 2.9 (10.9)
Bilateral loans
6.6 (19.0) 6.9 (54.3) 5.8 (24.8) 3.8 (36.2) 0.2
(0.6) 0.1
(0.4)
Subtotal
20.9 (60.1)11.3 (89.0)11.8 (50.4) 6.3 (60.0° 3.6 (11.2) 4.6 (17.3)
Overseas commercial
1.7
(4.8) —
(0) 9.1 (38.9) —
(0)23.0 (71.7)17.6 (65.8)
loansGrants
12.2 (35.1) 1.4 (11.) 2.5 (10.7) 4.2 (40.0) 5.5 (17.1) 4.5 (16.9)
Total public Investment 34.8 (100.0) 12.7 (100.0) 23.4 (100.0) 10.5 (100.0) 21.1 (100.0) 26.7 (100 0)
Resources
Source: Central Planning Office. Fiji's Eighth Development Plan (1981-1985), (Vol. 1) p. 61.
Foreign aid including soft-loans, capital or project grants, budgetary aid and technical aid are
important source of not only government financing but also in the public and private sectors.
Appendix table 2 gives an indication of aid flows for 1982.
Iwakiri and Ram '. Small Island Economies
amount of export commodities on the international markets, which does not allow the currency to enter in free market competition unlike other foreign currencies such as the United States dollar, Japanese yen, New Zealand and Australian dollar,
c. Foreign Trade
Fiji's direction of trade is influenced mainly by the import of mineral fuels and the export of sugar. Table 5(a) and (b) give the imports and exports by major partner countries. More than 50% of Fiji's imports are from her neighbours mainly Australia and New Zealand, however not much is exported to them. The main destinations for domestic exports are the United Kingdom, United States, New Zealand and Malaysia. The main exports to Australia are raw and unrefined gold.
Sugar receipts accunted for 55.7% of domestic exports in 1984 compared to 62.9% in 1983 and 69.0% in 1982 (Reserve Bank of Fiji, 1984. p. 85).
The main export items are mainly raw material, i.e. sugar, coconut oil, gold and molasses.
Appendbc table 3 gives the composition of domestic exports. Fiji's imports stand to be higher than exports. Imports consist of various food items, capital goods and machinery, automobiles,
and mineral fuels. Total imports in 1984 amounted to $487.1 million whereas the exports was $197.4 million and the retained imports was $371.1 million. (Reserve Bank of Fiji, 1984. p.
85-92).
Table 5(a).. Direction of trade:total exports (percentage) Year Total exports FOB (F$000)
Australia Canada Japan New Zealand United Kingdom United States of America Tonga/ Western Samoa Others 1968 49,118 11.1 6.3 4.1 5.2 37.8 13.6 3.7 18.2 1969 53,227 10.3 9.3 3.6 5.5 34.6 15.7 3.8 17.2 1970 62,307 8.8 11.6 4.2 7.1 31.4 15.7 3.8 17.4 1971 61,769 7.7 10.1 3.4 6.0 28.9 17.9 4.0 22.0 1972 65,582 10.1 6.7 3.7 7.5 29.8 21.4 4.1 16.7 1973 74,426 12.2 8.0 3.4 5.8 29.2 17.3 5.1 19.0 1974 123,740 9.9 2.4 0.4 6.6 30.0 25.9 5.9 18.9 1975 142,293 9.2 0.4 0.3 8.3 55.9 1.9 5.0 19.0 1976 122,523 10.3 0.4 0.3 10.5 41.3 3.9 6.1 27.2 1977 164,316 7.4 1.4 1.0 9.4 41.5 5.6 6.6 27.1 1978 166,493 7.2 3.2 0.9 9.1 38.8 10.0 6.6 24.1 1979 215,044 8.1 3.3 1.3 9.6 37.1 15.1 5.2 20.3 1980 305,559 6.8 6.8 10.3 10.2 20.2 10.1 4.5 31.1 1981 268,968 7.3 4.0 7.2 8.1 25.1 10.3 6.5 31.5 1982 267,557 10.9 2.4 1.9 9.6 22.4 9.9 6.3 36.6 1983 245,014 11.5 2.4 2.4 5.0 24.8 8.5 7.7 37.7
Table 5(b).. Direction of trade: total imports (percentage) Year Total exports CIF (F$000)
Australia Japan Malaysia and Singapore New Zealand United Kingdom United States of America Others 1968 68,402 26.2 12.8 3.2 9.4 21.3 5.1 22.0 1969 77,888 25.2 14.2 3.7 9.3 19.8 4.7 23.1 1970 90,502 23.7 15.1 4.1 12.0 17.3 4.4 23.4 1971 111,550 26.2 17.0 4.3 10.7 17.9 4.0 19.9 1972 131,549 24.6 15.9 4.6 12.2 18.5 3.0 21.2 1973 174,645 30.9 16.1 4.3 12.5 14.5 4.5 17.2 1974 219,331 30.3 17.9 8.7 11.2 9.9 4.3 17.7 1975 220,967 28.9 15.7 8.6 12.1 13.4 4.0 17.3 1976 238.040 28.6 18.0 9.3 13.7 10.8 4.3 15.3 1977 281,014 27.7 16.2 11.8* 13.9 9.8 4.2 16.4 1978 229,097 29.9 15.9 6.7 15.5 9.3 4.6 18.1 1979 392,863 35.3 14.3 4.9 15.0 8.9 5.7 15.9 1980 458,754 30.6 14.2 11.0 14.7 7.3 6.5 15.7 1981 539,907 36.0 16.0 7.0 13.9 5.5 7.2 14.4 1982 475.591 38.8 14.2 9.2 15.7 4.2 3.7 14.2 1983 493.185 38.2 16.8 4.2 16.4 5.0 3.9 15.5
* As from 1977 Malaysia is includedunder others.
Source: Bureau of Statistics, Overseas Trade Report, 1983.
Much of the trade commodities are facilitated through various trade arrangements such as the
ACP-EEC under the Lome Convention II and the South Pacific Regional Trade and Economic
Cooperation Agreement (SPARTECA).
d. Air Cargo and Sea Communication System—
Eight foreign airlines and a regional airline, Air Pacific, operate through the Nadi International
Airport. A domestic airline operates between the outer island routes with other private and
chartered operations.
International air freight discharged and loaded at the Fiji airport has fluctuated substantially.
Table 6 shows the amount of cargo handled from 1979 to 1983.
Table 6. Cargo handling at the Fiji airport
Year Thousands of kg. % change from previous year
1979 8,337 2.3
1980 7,967 -4.4
1981 7,742 -2.8
1982 8,766 13.2
1983 7,846 -10.5
Iwakiri and Ram '. Small Island Economies
The decline in air cargo and passenger movements relates to the high transportation cost with the rise in fuel prices. However, the Fiji's international airport is an important stopover on the major trans-Pacific air routes as well as being the focus of a number of regional services.
The sea communication system operates through four major ports, Levuka for handling fish,
Malau and Lautoka for loading sugar and molasses and Suva for all other goods.
Appendbc tables
4 (a and b) give an indication of the tonnage and type of cargo landed and shipped.About 60% of the total international ships which called at Fiji ports in 1981 and 1982 were dry cargo carriers including roll-on/roll-off ships, container carriers, dry bulk carriers and other dry
cargo vessels. Cargo landed is largely comprised of imported food, other raw materials and petroleum products.
Domestic and regional shippingservices also operate between internal outer islands and regional
island states. In 1982, of the 228 vessels registered at the Marine Board, 25 were over 150 tonnes and 76 vessels between 2-10 tonnes forming the most frequently used category of vessel size.
Fiji plays an important role in the Pacific as a major stopover for flights between America and Australia, and as an entrepot port in the intra-regional trade between the Pacific islands.
Much of the intra-regional trade, including trade between New Zealand and Australia, depend on the efficiency of operations of the regional shipping of Pacific Forum Line and the Nauru Shipping Line. The low value of exports and high value of imports has caused a trade imbalance between New Zealand and Australia and the islands of the Pacific including Fiji, but the regional shipping has so far relied on the support of New Zealand and Australia for financing its operations.
It is seen that the basic transportation infrastructure in terms of air and sea has been relatively developed, but the problem is still the low value of export commodities and fluctuations in the supply of exports, which create high transportation costs and unreliability.
2. Economic Relations with Australia and New Zealand
Besides such factors which hinder development, as size, limited resources, low productive capacity, and isolation; the subordinate position which Fiji occupies in her trading relationship with Australia and New Zealand could well be construed as another major obstacle.
The present economic structure is a direct result of Fiji's colonial experience and its associated foreign investment. For example, the establishment of Colonial Sugar Refinery (CSR) under Australian capital has shaped Fiji's economic system where the sugar industry constitutes the major source of foreign exchange right up to the present. At the time of independence, four large Australian Companies, CSR, W.R. Carpenter, Burns Phillip, and Emperor Mines were operating as the major economic force with other smaller trading companies.
The declaration of independence, which gave the islands of the Pacific the flexibility to make their own decisions, caused the Pacific rim countries with established interest in the area such as the USA, France, Australia and New Zealand to devise policies to maintain their predominant influence. Australia and New Zealand, in particular, have become more heavily involved in the form of economic and diplomatic initiatives, despite having withdrawn from their colonies.
Table 7. Sources of foreign investment in Fiji asof December 1979
Country of Origin 1 2 3 total proportion %
Australia 247 10 2 259 32.2
New Zealand 136 18 8 162 22.0
USA 61 — — 61 8.3
United Kingdom 48 2 2 52 7.1
Japan 10 1 1 12 1.6
Joint Foreign Participation 48a 8b 3c 59 8.0
Other countries 98 6 15 119 16.2
Not Detailed 12 — — 12 1.6
Total 12 45 31 736 100.0*
* error due to rounding
a Australia participated in 28, NZ 18 b Australia participated in 5, NZ 5 c Australia participated in 3, NZ 1
Note: Category (l)-greater tan 50% foreign equity Category (2)-between 20% and 50% foreign equity Category (3)-less than 20% foreign equity. Source: Carstairs. R.T. and R. D. Prasad 1981. p. 11.
estimated that foreign firms account for 75-80% of corporate turnover in Fiji and that Australian firms account for 60% of that" (Carstairs, 1981 p. 11)
Table 7 shows the sources of foreign investment in Fiji as of December 1979. It also illustrates the numerical strength of Australia as a source of capital. 35.2% of the companies had some Australian participation, New Zealand was seen to be significant in categories 2 and 3
companies.
"The two largest Australian foreign enterprises operating in Fiji are the W. R. Carpenter and Burns Philip; together have near control over many industries and exert influence in almost all economic sectors particularly manufacturing, international trade, retail trade, transport, tourism, and sections of agriculture (Utchert, 1984. p. 257).
Burns Phillip (South Seas) has expanded from plantations to merchandising, transportation, wholesaling, and retailing imported products and manufacturing within the Pacific islands. The Carpenter Group is the sole dealer of caterpiller and earth moving equipment in Fiji and has franchises over imported automobiles and other machinery from the USA, Japan, and the United Kingdom. It is the biggest shipbuilder in Fiji and controls more than 50% of the industry and has moved into agriculture. Fiji Gas Co. Ltd., a subsidiary of an Australian-British-NZ owned company, plays an important role in the petro-chemical sector.
In 1979, as indicated in Table 7, 660 foreign investments existed in Fiji, of which 247 were from Australia, 136 from New Zealand, and 5 were a joint venture between Australia and New Zealand, which altogether accounted for 65.2% of the total foreign investment in Fiji.
Besides dominating the foreign investment sector in Fiji, Australia and New Zealand also play a significant role in the commodity trade market. In 1983, Australia accounted for 38% and New
Iwakiri and Ram '. Small Island Economies 11
Zealand for 16% of Fiji's imports, whereas the exports to Australia were 11% and to New Zealand were 5% of Fiji's total. Table 8 illustrates the balance of trade between Fiji and Australia and
New Zealand.
Major commodities imported from Australia include food, petroleum products, manufactured goods, chemical and machinery, and from New Zealand mainly food and manufactured goods.
Major exports to Australia is unrefined gold mined by an Australian company and exports to New
Zealand are mainly food.
Australia and New Zealand have also been significant aid donors to the South Pacific regional
institutions and organisations. Besides multilateral aid for budget financing of SPEC, SPC, SPF, andUSP; Australia and New Zealand also contribute to special projects being undertaken by these
organisations such as the Pacific Forum Line (PFL) and the South Pacific Forum Fisheries Agency
(FFA).
Thus Fiji, being one of the members of the regional organizations, is being affected by
the decisions of this multi-aid assistance.
Bilateral aid to Fiji from Australia and New Zealand has also been significant as indicated in
Table 9 for the year 1982. Aid from Australia accounted for 52% and New Zealand 10% of the
total aid.
Table 8. Balance of trade with Australia and New Zealand
($ million)
Australia New Zealand Total Trade Year Exports Import Exports Imports Exports Imports
1982 29.090 184.657 25.712 74.540 267.557 475.591 1983 28.105 188.564 12.184 80.756 245.014 493.185 1984 38.152 168.415 10.961 78.477 279.418 487.105
1984 figures are provisional
Source: Reserve Bank of Fiji, Financial Statement, 1984. p. 94
Table 9. Official development assistence (ODA) from Australia and
New Zealand in 1982 ($ million)
Australia New Zealand Total bilateral 15.9 3.1 30.6
Source: Fairbain Te'o LI, 1985. p. 420
G.R.Fry makes the following comment of dependence on aid:
"Attempts to establish substantial regional ventures to displace metropolitan involvement have inevitably led to even greater involvement in the form of financial assistance. The necessary capital to support large regional venture is just not available in the island region. In the case of regional shipping line, for example its continued operation is dependent on the injections of Australia and New Zealand capital, and yet paradoxically the lines was established partly to reduce dependence on metropolitan line". (G. R. Fry, 1981. p. 27).
The South Pacific Forum has established a preferential trade agreement between the South Pacific Island and New Zealand and Australia called SPARTECA. Fiji being a member of the South Pacific Forum and having close trading ties with Australia and New Zealand also has the
opportunity to benefit from the offer of duty-free and unrestricted access or concessional access
for other specified products originating from the developing island member countries of the Forum
in order to accelerate the development of member countries and to promote economic coopera
tion.
However, the Forum island countries have been facing various problems with regard to
SPARTECA operation. Fiji's Prime Minister Ratu Sir Kamisese Mara in addressing the recent Commonwealth Heads of Government Meeting in Suva expressed the following concern:
"..inspite of ostensibly generous trade agreements, in practice our exports into those markets are frustrated by bureaucratic devices such as quotas licenses, and other non-tariff barriers...
Its often difficult to reconcile such protectionist practices with the political goodwill that occupies such as agreements" (South Pacific Island Business News, Nov. 1981. p. 17).
"It has therefore aroused concern that SPARTECA might turn out to be another kind of
neocolonialism...just another devise which, good intention not withstanding, continues to tie the islands of the region in a subordinate way to their metropolitan neighbours" (Sutherland, W. M.,
1982. p. 2).
Analysis of the SPARTECA Agreement shows various loopholes which are beyond the scope of this study. Also the list of items which qualify for access to Australian markets are items which the island economies are incapable of producing competitively such as cider, porcelain, chinaware
and plastic garments.
Fiji, being an island country, faces various shipping problems. Most important being the high cost of relatively valuable imports carried in cargo liner from Australia and New Zealand; and only a limited return cargo to these markets, comprising mainly primary products of relatively low value, with the bulk of exports going to Europe by chartered tramp vessels. The great fragmentation of the islands with small population and markets also creates expensive transporta
tion.
These problems are not unique in Fiji, but also apply to other South Pacific island countries.
To overcome this problem, the South Pacific Forum set up the South Pacific Forum Line to
facilitate the trade between the islands of the region and New Zealand and Australia. With
imbalances in trade, the South Pacific Forum Line faces several operational difficulties, however, New Zealand and Australia have kept it going by financing over two-thirds of its budget. The operations on the other hand have eased the importation of raw materials, manufactured, and
processed foods into the island states; and the exportation of the products of Australian and New Zealand companies located in the islands.
With regard to fisheries, Fiji's subordinate relationship with Australia and New Zealand has had
two major ramifications. Firstly, from the time of colonial rule both countries have been interested in commercial agriculture under the plantation system, and later on processing of these
agricultural products and other manufacturing industries rather than fisheries except for the financial assistance for the operation of the recently established FFA. Much of the operation of
Iwakiri and Ram '. Small Island Economies 13
food is also seen not to be of equal importance as red meat in these countries.
Secondly, with the concentration of economic interests on commercial agriculture and manufac
turing such as sugar which forms the base of economic activity, it could be said that resources
have been further directed away from fisheries and as a result, fisheries is still dominated by the
subsistence production.
3. Structural Stagnation Under a Monocultural Economy (1) Sugar Cane
Sugar cane farming started in Fiji in the early 1860s by the colonial settlers in various parts of
Fiji. Almost 34 mills operated at one point or another since 1862, of which 4 still remain and form the base for the sugar industry. Sugar became Fiji's principalexport in 1883 and still remains the backbone of Fiji's economy.
The Colonial Sugar Refinary Company (CSR), a well established Australian company started
operations in Fiji in 1880. In 1961, the CSR set up the subsidiary South Pacific Sugar Mills (SPSM) to operate the Fiji mills. Following an unacceptable arbitration award by Lord Denning on the sharing of proceeds with growers, CSR withdrew from Fiji in 1973. As a result, the government bought all CSR shares in SPSM Ltd. and consequently operates the present Fiji Sugar Corporation (FSC) as a public company.
Sugar not only dominates the agriculture sector of the economy and accounts for the highest commodity crop, but it also places as the largest in the food manufacturing sector. In 1984 sugar cane accounted for 76% of the agriculture, forest and fisheries sector and sugar manufacturing accounted for 35% of the manufacturing sector. In the total it accounted for 15.4% of the GDP. Table 10 (a & b) gives the details on the position of the sugar industry in the economy.
Sugar cane is the major crop of the two larger islands. Farms are operated under a small-holder system where the average farm holding is about 4.2 hac. About 20,000 indepen dent farmers sell cane to the mill in their respective areas. The farmers are comprised of 75% Indian and 25% Fijian.
During harvest time, 19,000 people cut cane on an average day. Three thousand and five hundred people are directly employed in the FSC Mill operations. In the overall economy the sugar industry employs nearly one quarter of Fiji's economically active people. Appendbc table 5
Table 10(a). Position of sugar industry in the economy
Sugar/agri. % Sugar/manuf. % Sugar/GDP % Sugar/domestic % exports 1980 75.8 33 13.8 80.0 1981 78.2 35 15.6 72.9 1982 77.3 37 16.2 71.8 1983 66.7 24 9.7 64.7 1984 76.0 35 15.4 59.1
Table 10(b). Economic performance of the sugar industry (1980-1985) 1980 1981 1982 1983 1984 1985" 1. Exports: a) Sugar (tonnes) 441,000 408,000 411,000 343,000 379,513 434,000 b) Molasses (tonnes) 161,000 141,000 157,000 93,000 150,153 151,000 2. Export Value: a) Sugar ($m) 154.55 134.99 147.09 89.83 110.16 111.00 b) Molasses ($m) 11.98 9.62 5.08 3.17 6.46 7.50 c) Total ($m) 166.53 144.61 152.17 93.00 116.62 118.50 3. Employment: a) Farmers 19,567 21,015 22,091 20,500 21,796 22,146 b) Cane cutters 19,300 19,411 19,911 11,295 16,244 16,244 c) FSC Employment 3,951 4,000 3,708 3,521 3,871 3,887 Total 42,818 44,426 45,710 35,316 41,911 42,277
4. Cane Price: $/tonne 35.19 26.24 28.60 29.00 22.37 22.43
5. Income: growers $m 117.80 103.26 111.4 65.10 97.59 82.54
FSC$m 48.73 41.35 40.77 27.90 38.93 33.59
Note: e=estimate
Source: Bureau of Statistics, Central Planning Office Fiji Sugar Corporation Annual Reports
gives the sugar industry production and prices. It also indicates the fluctuations not only in crop production but also the market prices for sugar.
Fiji differs from other sugar producing countries because of its almost complete dependence on small farmers and its centralised milling system. Each farmer operates under a contract with the miller who specifies the quota of cane from his farm and also regulates the relationship between
sale and purchase of cane.
Several problems exist at the famers' level. Firstly, it must be pointed out that in light of the general principle of agricultural progress, sugar production and earnings per unit from small scale farms of 0.10-0.12 hac. falls short of the level of developed agricultural countries.
Major problems for farmers which directly affect production relates to insecurity of land and tenure. This insecurity of lease has further led to poor and management.
Other major problems in sugar cane productionhave been adverse weather conditions, cyclones and flood. Sugar diseases have also severely affected crop yield in some areas.
With technological advances, several kinds of artificial sweetners and beet sugar which represent close substitutes and have become higher preference commondities than traditional cane sugar have hit the world sugar market. This has forced the world sugar prices towards a downward tread. The fluctuations and decline in prices have affected Fiji's earning and hence the
whole economy.
Fiji's major reliance for market are under special agreement with the European Community. In
Iwakiri and Ram '. Small Island Economies 15
Agreement.
Fiji also has long term arrangements with Malaysia, New Zealand, China and
Singapore.
The remainder sugar is sold on the open market.
The decline in the world market
prices since 1980 has continued.
The Director's report for the Sugar Industry for 1983-1984
season states that: "The prolonged slump in the sugar market prices with no encouraging signs of
any significant change is threatening the viability ofthe sugar industries throughout the developing
world, and Fiji is no exception".
(FSC Annual Report, 1983-1984, p. 4).
The capacity to expand lies in fulfilling and securing the ACP-EEC quota agreement as well as
tranding in the open market.
The latter, where the major economic capacity to expand lies, is
very dependent on the openmarket prices.
However huge imbalances between consumption and
production have led to steady accumulation in world sugar stocks, thus causing the world sugar
prices to fall.It is also worth pointing out that since the world market offers cheap sugar, it would not be
surprising that the present contracted countries would later buy in the open market, thus
weakening hope of expanding special agreement and contracts.
Fiji's vulnerability to fluctuations in external demand conditions for sugar has aroused great
concern. The decline in sugar prices has not only affected the industry, but the farmers who directly depend on sugar production and the economy as a whole. This monocultural dependenceis proving to be a great risk to the economy. (2) Copra Industry
Copra is another monocultural crop which is a major source of income and employment on the outer islands and Eastern and Southern Vanua Levu. It is the second agricultural crop in terms of earning foreign exchange. It also came under commercial productionduring the colonial period
in a similar manner as the sugar industry and still plays an important socio-economic role in the economy.
There are two major types of production system, the large estate plantation and the village production by small scale farmers. The larger estate plantations over 900 hac, are mostly operated by companies or individual owners on freehold land bought before cession and worked by hired labourers. The small holdings of the industry are generally less than 4 hac. and worked by
family or cooperative groups. Foreign ownership of the sector is considerable both in terms of the traditional involvement of W. R. Carpenter Ltd. and the Burns Phillip (SS) Ltd. and newly
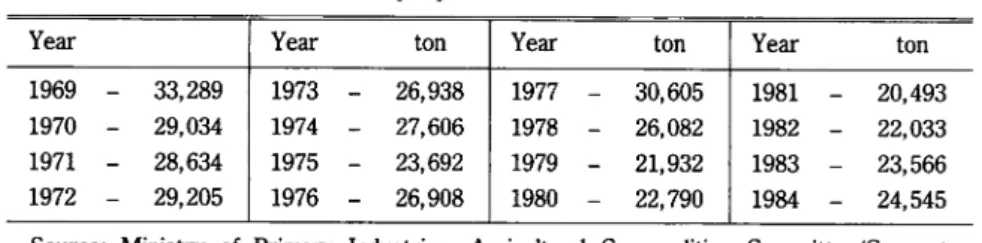
Table 11. Copra production from 1969 to 1984
Year Year ton Year ton Year ton
1969 -• 33,289 1973 -- 26,938 1977 -- 30,605 1981 - 20,493 1970 -• 29,034 1974 -- 27,606 1978 - 26,082 1982 - 22,033 1971 -- 28,634 1975 -- 23,692 1979 - 21,932 1983 - 23,566 1972 - 29,205 1976 -• 26,908 1980 -- 22,790 1984 - 24,545 Source: Ministry of Primary Industries, Agricultural Commodities Committee/Coconut Advisory Council, Coconut Profile: A Programme for Future Development of
established USA and Singapore based involvement. Island Industries Ltd., a subsidiary of
Carpenters, operated the first mill which is so far the largest of the current operating mills.
The
Burns Phillip operates CASP Ltd. and own considerable copra estate. Copra production has declined considerably in the early 1980s. Table 11 displays the copra production from 1969 to
1984.
Frequent hurricanes have decreased production severely, coconut pests and diseases have also increased and affected the quality of coconut production, lack of rehabilitation and replanting of older trees, most of which were plantedin the colonial period have decreased production because of old age. Other problems relating to production include land tenure and insecurity of lease which has also created disincentive for land and crop improvement.
The technology and production techniques employed are of low-efficiency particularly for copra drying. Output of copra per hectare under coconut trees is generally low. Harvesting is not regular, nuts are collected from the ground after natural fall and mostly picked up when cash is
required.
Shipping problems are also enormous with the fragmentation and distances between the islands and as a matter of the fact production quantities are small. The high fuel prices during the 1970s caused high freight cost for shipping which eliminated all profit.
Table 12. Exports of coconut oil
Year Quantity (t) Value (FOB) ($000) 1969 17,411 n.a 1970 19,011 n.a 1971 16,866 n.a 1972 15,905 n.a 1973 18,247 n.a 1974 14,306 n.a 1975 16,060 n.a 1976 14,433 n.a 1977 17,551 n.a 1978 17,645 n.a 1979 14,228 n.a 1980 12,720 6,528 1981 13,582 6,355 1982 15,607 6,165 1983 13,941 10,579 1984 15,034 18,467 n.a-not available
Source: Ministry of Primary Industries, Agricultural Com-modities-Committe/ Coconut Advisory Council, Coconut Profile: A programme for Future De velopment of Coconut Areas, 1985. p. 23., and Current Economic Statistics, April 1985. p. 59.
Iwakiri and Ram '. Small Island Economies 17
The trading patterns in coconut oil indicate that in 1984 it accounted for 9.4% of total domestic exports, whereas in the 1960s and 1970s it accounted for almost 25%. Table 12 presents the exports of coconut oil from 1969 to 1984.
Local copra prices are related to world market conditions for oil Coconut oil has lost some of its share in the oil market compared to animal fats, palm oil and other edible oil such as palm kernel oil and soy bean oil which provide cheaper substitutes. The palm kernal oil being the closest substitute for coconut oil provides the greatest competition.
"Competition with palm kernal oil will not only be in price terms, but will also depend on market access, reliability of supply etc". (W. D. Scott and Co.Pty. Ltd. p. 10).
World prices of coconut oil are also greatly affected by soy bean oil which dominates the edible oil industry. Also coconut oil prices are quick and sensitive to shift in supply from the largest coconut oil producer, Philippines, which account for almost 80% of the world trade in coconut oil; as a result, the vulnerability in Philippines production has also been one of the contributing factors in the extreme instability in the coconut oil prices.
Fiji's copra previously benefited from EEC-STABEX, an export earning stabilisation scheme introduced as part under the Lome Convention. Under Lome I, Fiji could obtain loans for coconut oil deficits regardless of the market in which the copra was sold. However, under Lome II, as a result of more stringent application of STABEX Articles, Fiji does not have similar
opportunities from STABEX Funds because no oil has been going to the EEC Market. This has
greatly affected the future of the copra industry.
The W. D. Scott & Co. Pty. Ltd. Report on Copra and Coconut Oil Markets forecasts the coconut oil demand as follows: "End use demand for these oils in traditional markets however is
not likely to grow as far as their supply. Even allowing aggresive selling in the traditional
markets which is the likely priority suppliers response, the demand volumes still do not appear to be large enough to absorb the available oil" (p. 6).
With over supply and declining preference for coconut oil in the oil market, the future of the
copra industry does not look very positive in terms of maintaining market share and expansion.
Variable prices have also affected production and management since copra isa long term extensive
agricultural crop.
Sugar and copra being monocultural crops and tranditional colonial commodities, present several problems for the long term continuity. Both industries are faced with declining prices as a result of higher production relative to consumption which has produced surplus supply on the world market, much consumption being affected by increasing substitute commodities.
The fixed quotas under the long term contracts do not accommodate for expansionbut do rather for continuous efforts to renew these agreements as the world market prices decline. On the other hand, the world prices do not show any promising change in the immediate future. Almost
47% of the total sugar exports has to be sold in the world free market.
While the return per hectare is declining with reduced sugar price, the production costs are increasing due to the rise in fuel price and high prices of both fertilizer and farm machinery, which are all imported materials; leading the whole industry, including the farmer, into a depressed
state.
been implemented to some extent. However, the opportunities and potential for further diversification and expansion lie in the ability to seek export markets for its products as the domestic market is too small.
The copra industry is also faced with a similar problem, but to a greater extent being a long term crop. With the continuous decline in production and reduced coconut oil prices, not only have the copra processing industries been affected but also the farmers have experienced periods of no profit.
The excessive processing capacity and declining copra production have caused much concern to the government. As a result, the Eighth Development Plan objective for the copra industry emphasized increasing coconut production in order to keep the processing industries in the
operation by supplying free planting materials.
Present development programmes also empha
size intercropping, use of coconut fibres as means towards diversification of the industry, but the
success still lies on the availability of markets for these small quantities of production from theouter islands.
The stagnation of both industries clearly indicates the risk involved in the continued reliance and investment. It is also worth stating that the potential for diversificationin both industries needs a
more careful research and evaluation before any major implementation.
4. Indefinite Class Differentiation Inside Rural Communities (1) Progress of Land Ownership
Throughout history, land ownership patterns have determined the various economic and social systems right up to the present.
Land ownership patterns have been categorised by three stages in its theory of development.
The first is characterized by primitive communism where ownership developed as a common
property or a clan based system.
The socio-economic forces and contradictions within the society ledto the emergence ofa large
scale feudal landlord andthe tenant, called the feudalists tenantsystem as the second stage in the
development process. Although the clan system remained during the feudalists period, it was in
fact not so in reality, only the outer framework within which a new type of society developed.
The new society was characterized by a hierarchical socio-economic structure with the tenant as
peasants at the bottom and feudal landlords in possession of large areas of agricultural land. The
destruction of the peasant from the land led to the third stage in the progress of land ownership
called the enterprise or capitalistic ownership system. It is seen that the economic structure of the capitalist grows out of the economic structure of the feudal society. The dissolution of the latter in fact sets free the elements of the former to freely take place.
The large agricultural lands of the landlords thus turn into the farming enterprises and the
feudalists rent modified into the modern rent system.
The tenants consisting of the masses
become landless and provide their labour for the capitalistic enterprises characterized by large
scale plantations.
In the history of the development of capitalistic countries such as the USA and European
countries, this transformation of the feudalists landlord systemintomodernized ownership system
Iwakiri and Ram '. Small Island Economies 19
can be seen, as well as the emergence of farming enterprises and wage labour as a process of capitalistic agriculture.
In the context of land ownership in Fiji, actual land ownership and allocation of land patterns took effect only after European contact with the coming of planters and settlers. These planters and settlers wanted land and labour for their plantations and a settled government which would give them a firm title to their land besides protection. When a European bought land he considered that the land became his. The Fijian, however, often sold what he believed to be only the use of land, therefore resulting in great conflicts and warfare. The concept of land ownership meant only the use of land surrounding the village or the tribal settlement. Land was a common property with traditional clan ownership.
The Deed of Cession in 1874 made first provisions to identify the state of ownership of the land, Clause 4 of the Deed of Cession stated the following with regard to land:
"That the absolute proprietorship of all lands not shown to be now alienated so as to have become the bona fide property of Europeans or other foreigners or not now in the actual use or occupation of some chief or tribe or not actually required for the probable future support and maintenance of some chief or tribe shall be and is hereby declared to be vested in her said Majesty her heirs and successors". (Lloyd, D.T., 1962. P. 8).
This clause gave three types of land system which still prevail and form the base of the present land ownership system. Firstly, the land which was at the time of Cession proved to be under
European and other foreigners occupation became the freehold land. Secondly, lands which were
in actual use or occupation of some chiefs or tribe and lands required for the probable future
support and maintenance was regarded as the Native Land. The third type of land was all land not falling under the above two categories, which belonged to the Crown or the Government.
Hence it became the Crown Land. Table 13 gives the percentages of each type of land ownership in Fiji.
The law requires the Native Lands to be held according to the Native Custom. The Fijian land is therefore registered under the traditional 'mataqali' (clan) system of a patrilineal linkage, and land is inalienable except to the Crown. The head of the 'mataqali' is in charge of the land belonging to his clan. So long as a man performs his portion of the work, he cannot be pushed out even if he only holds a collateral interest in the land of the 'mataqali'. This principle of ownership based on traditional custom has been adopted by the colonial administration and has so
far remained unchanged.
With various socio-economic pressures such as population change, land varies widely now from
Table 13. Fiji land ownership statistics (1977)
Type of land % of Total area
Native land including Rotuman land Crown land Freehold land 83.30 8.55 8.15 Total 100.00 Source: Prasad, P. 1983, p. 103.
one unit to another and even within the same village, but there is no mechanism for redistribution of land. The only land which could be speculated towards individual proprietorship is the freehold land which comprises only 8.15% of the total land area. Since this is the only freely transferable land, it has a market value quite unrelated to its productive value for agriculture.
The third category comprising of Crown land is used by government for mostly public amenities
and services. Thus the only lands available for agriculture are the native lands and only a small
portion of Crown and freehold land.
Commercial agriculture in Fiji developed initially under the plantation system by the colonial settlers with the help of indentured labourers. These plantations, mainly of cotton and later copra and sugar cane, occupied most of the freehold land operating simply as extensions of the capitalistic industry of the metropoh'tan empire to supply raw materials. With the lack of labour the sugar industry shifted on to small holder tenant system on the freehold land of the Company and on the native lands under lease from the 'mataqali' land owners.
Thus the non-Fijian farmers, most of whom are of Indian background and who settled after the indenture period, have become the independent small holder tenant on the Native land. It is therefore seen that land ownership patterns in Fiji exhibit a unique character in that the tenant system of small independent farmers is integrated into the traditional clan system. The state of land ownership or the stagnation of ownership is reflected by socio-political control which originated under the colonial administration system. Throughout the history of British Colonial ism, it is generally seen that the British Administrators avoided conflict with the native customary systems in order to peacefully achieve their own ends, thus codifying the system as it existed at the time of cession and keeping away with any further legalities which was not in their interest and not their purpose. Thus much of the rural stagnation is a result of this colonial manipulation.
The land ownership pattern from the past to the present does not indicate economic forces for disintegration, a necessary process for progressive agricultural development.
The purpose in the above arguments has been merely to try to illustrate the stagnation of land ownership rather than for any judgement on the desired mode of land system. The rural community and the mode of farming is also reflected by this stagnation in the land ownership system.
The pattern of land ownership is analysed in the later part of the study in relation to ownership of the sea which according to the traditional custom, was a simple extension of the land boundary. (2) Differentiation of Peasantry.
According to the historical process, at any point in time, the socio-economic relations are a combination of remains of the past dominanttype relations that are on the verge of disaggregation, the present conditions of the society, and the new relations that are beginning to develop and
express in contradictory manner.
The sum-total of all these economic contradictions among the peasantry constitutes what we call the differentiation of the peasantry. The peasants themselves very aptly and strikingly characte rize this process with the term depeasantising. This process signifies the utter dissolution of the old, patriarchal peasantry and the creation of new types of rural inhabitants (Lenin, 1964 p. 176.). These rural inhabitants consist of two extreme types of groups, the first is peasant bourgeoisie,
Iwakiri and Ram * Small Island Economies 21
a minority group of individual independent farmers who purchase and/or rent large area of land,
use improved farming techniques, hire farm labour, and further in the process try to combine
agriculture withindustrial enterprises.
The other group is the rural proletariat, consisting of the
majority of the people who have to abandon their land and sell their labour power to the first
group.
The overall process involved represents the breakdown of feudal and clan property and
its transformation into modern private property which is characterized by large plantation systems
with improved techniques and use of labour.
It represents the natural course of capitalistic
agricultural production.
Thus the process of differentiation may be looked at in terms of size of
farms and groups, and class of farmers through time in order to see the process or degree of
Table 14. Size of farms in 1944 Number of Hectares Tenants Contractors Up to 0.019 nil 141 0.02 to 0.039 22 640 0.04 to 0.059 105 711 0.06 to 0.079 114 440 0.08 to 0.099 595 373 0.10 to 0.119 1,502 378 0.12 to 0.139 960 238 0.14 to 0.159 440 214 0.16 to 0.179 189 132 0.18 to 0.199 41 82 0.20 to 0.219 24 101 0.22 to 0.239 6 67 0.24 to 0.259 2 70 0.26 to 0.279 2 51 0.28 to 0.299 1 39 0.30 to 0.399 3 99 0.40 to 0.499 4 48 0.50 to 0.599 2 19 0.60 to 0.699 nil 11 0.70 to 0.799 nil 6 0.80 to 0.899 nil 3 0.90 or over nil 4
Note * Tenants—in the above case tenant are farmers who lease land from the
company.
* Contractors—several different forms of leases: some contractors own
land, others leases from private individuals, but most of
them hold leases from native owners.
** The tables used for the above analysis are a poor representation of
statistical proof, but unfortunately data on farm sizes and the number of
farmers over the years is not available. Source: Sherpard, C. Y., 1945. p. 39.
progress, if any.
Differentiation of peasantryin Fiji is directly reflected by the pattern of land ownership system. The majority of the agricultural land is under communal ownership, where the use of land is determined by the traditional means. The institutional factors mainly socio-political, which determined administration of land, restrict individual ownership or free trade in land (with exception of freehold land), therefore restrict the development of capitalistic forces of production.
According to the analysis on sugar farming, the dominant agricutural crop shows that fanning on
the small-holder system has continued since as early as the 1930s. Lack of labour to maintain the
plantation system created a sub-division of states into a small-holder system wich proved
successful where the Indian farmer could manage a farm using family labour. Small farmers not only increased on the company's land, but also on leased 'mataqali' land. Table 14 shows that the
average size of farms in 1944 was about 0.1 hectares.
Table 15 indicates the breakdown of the plantation system and development of the small holder
system. The trend of the small holder system has been continuing as indicated by more recent
figures on farm size as can be seen in table 16.
Table 15. Development of sugar cane farming areas cultivated 1925-1944
Year Total area under culti vation
Cultivated by
Company European Indian and Indian and
Planters Fijian tenants Fijian contractors
acres % of area acres % of area acres % of area acres % of area
1925 64,963 33,679 52 4,446 7 6,905 10 19,933 31 1926 67,494 30,350 45 4,040 6 9,080 13 24,024 36 1927 70,526 28,828 41 3,677 5 11,448 16 26,573 38 1928 75,007 23,700 32 2,342 3 20,710 28 28,255 37 1929 77,645 20,025 26 2,004 3 25,559 33 30,057 38 1930 78,250 17,641 22 1,611 2 27,896 36 31,102 40 1931 78,373 12,610 16 1,133 34,300 44 30,330 39 1932 80,939 9,160 11 744 39,412 49 31,623 39 1933 83,692 7,450 9 645 43,077 51 32,520 39 1934 84,497 5,335 6 658 44,898 53 33,515 40 1935 87,738 4,874 5 661 45,690 52 36,513 42 1936 89,924 4,532 5 653 46,031 51 38,708 43 1937 91,197 4,500 5 717 46,139 50 39,841 44 1938 91,475 3,219 4 369 — 47,405 52 40,482 44 1939 91,812 3,126 3 240 — 47,421 52 41,025 45 1940 91,624 3,111 3 206 — 47,268 52 41,039 45 1941 92,628 3,153 3 161 — 46,521 50 42,793 47 1942 94,046 3,119 3 221 — 46,439 50 44,267 47 1943 90,913 2,728 3 197 — 45,383 50 42,605 47 1944 89,059 2,424 3 197 — 45,332 51 41,105 46
Iwakiri and Ram '. Small Island Economies 23
Table 16. Number of farmers, size of farms and production
Total production (OOOt) Production size (t) Size of farms (acres) Number of farmers
Year Lautoka Rarawai Labasa Penang
1982 4,075 1-50 0-5 1,884 759 845 1,289 51-500 5-10 6,652 4,910 3,699 1,720 500-over -10 217 131 388 22 8,753 5,800 4,932 3,031 1983 2,202 1-50 0-5 4,284 2,078 1,109 1,022 51-500 5-10 4,506 3,770 3,702 1,569 500-over -10 12 19 91 10 8,802 5,867 4,902 2,604 1984 4,290 1-50 0-5 1,682 956 811 711 51-500 5-10 6,819 4,763 3,799 1,866 500-over -10 347 202 351 42 8,848 5,921 4,961 2,619
Source: Fiji Sugar Corporation Information Office, Suva. (IDL) Information Officer.
It can be seen in table 16 that most farmers come from farms ranging in size from 0.05-0.10
hac. rather than larger farms of over 0.10 hac. thus indicating that the dominant farms are still the
small holder system.
In his study on the size of farms, Sharma also mentioned dominance of the small holder system
and its implications on the importance of family management labour.
"In 1980, there were some,
1900 sugarcane farms of which about 44% were in the 2-4 hectare (5-10 acres) group, while only
about 9% were in the greater than 6 hectare (15 acres) category.
The small holder system of
farming is further reflected by the fact that on an average only 0.4% of the sugar cane farmers
employed 2 temporary non-family labour...Cropping patterns in the western side of Viti Levu and
Nothern Vanua Levu (where most of Fiji's sugar is grown) has changed only marginally in the last70 years despite the possibility of growing relatively more high value products" (Sharma, 1985. p.
35).The process of differentiation in the above agricultural system does not exhibit any distinct
development forces towards capitalistic production.
The socio-political forces of land ownership
restrict the disaggregation of the small holder system.
Moreover, the rural community does not
distinguish between large farmers who control the production and industry, and a class of poor and
landless turning to agricultural labour for the large farmers.
A farmer's status is highly dependent on the nature of his land tenure and his social relations within the community he interacts either for extension of lease or for other sources of income and assistance. The agricultural peasantry does not exhibit of the definite process of differentiation
as historically expected, because the production sector is based on small-holder household
production while the industry is based on the capitalistic mode.
The limitation on development of
capitalistic production of sugar cane is in part, caused by the greater outside institutional forces.
5.
Backward Composition of Industrial and Employment Structure
(1) Presence of Light Industries.
Fiji's industrial production structure is classified in three categories: manufaturing, mining, and gas & water. Table 17 below shows the industrial production contribution to the GDP.
Table 17. Industrial production contribution to GDP (1976-1980)
1976 1977 1978 1979 1980*
CDP at current factor cast ($m)
570.6 605.8 642.9 779.4 917.0 Industrial sector:
-mining and quarrying -manufacturing
electricity, gas and water
Value added ($m) 76.3 78.5 76.7 106.3 116.8
Percent of contribution (%) 13.4 13.0 11.9 13.6 12.7
* expected.
Source: Bureau of Statistics, Census of Industrial Production 1980. p. 8. Table 18. Contribution ofthe sugar industry inthe total manufacturing
Industry Value added ($000) including sugar industry Value added ($000) excluding sugar industry 1978 1979 1980 1978 1979 1980 1. Food manu facturing 41,052 60,314 65,701 18,701 22,095 21,535 2. Clothing and footwear 1,645 2,192 1,860 1,645 2,192 1,860 3. Wood products 6,873 7,809 10,147 6,873 7,809 10,147 4. Paper and printing 3,989 5,551 6,597 3,989 5,551 6,597 5. Chemical products 3,842 5,042 5,514 3,842 5,042 5,514 6. Non-metallic product 3,279 3,852 5,030 3,279 3,852 5,030 7. Machinery and equipment 7,196 10,061 9,416 7,196 10,061 9,416 8. Miscellaneous products 586 322 379 586 322 379 Total manu facturing 68,462 95,143 104,644 46,111 56,924 60,478