ASEAN-KOREA
FREE TRADE
AREA
Towards
Economic
Integrationin East Asia
RUJHAN
MUSTAFA
KIM WON
IK
39
Abstract
Association of Southeast Asian Nations (ASEAN)andRepublic of Korea (Korea) has
been mutually important economic partners over several decades. The impact of regionalism
in East Asia brought two parties to realize the need to develop and enhance their economic
integration. Therefore, Korea had proposed comprehensive and closer economic relations with
ASEAN and as a result, ASEAN-Korea Free Trade Agreement (AKFTA)was agreed and
signed. This paper examines the current bilateral trade patterns and FDI flows between
ASEAN and Korea, examines the effects of AKFTA, deterrnines the FTA’spotential benefits
of AKFTA, and to suggest possible strategies to be initiated by AKFTA. It also focuses on
the direction in which an AKFTA is expected to move and accelerate towards. The results
suggest that the potential benefits will be huge in terms of bilateral trade and FDI between
ASEAN and Korea. In order to achieve successful implementation of AKFTA, Korea needs
to pursue globaland strategic trade policies and maintain the market opening levels at those
of China and Japan or other competitors. Overall, the economic relationship between ASEAN
and Korea will be developed by further deepening economic integration and cooperation.
1
Introduction
Regional trading agreements (RTA) became a worldwide phenomenon in the 1990s
along-side globalization, and it continues to prosper in the first decade of the 2Lt century. As the
European Union (EU)andNorth American Free Trade Area (NAFTA)continues towiden
and deepen its regional economic integration (currently with 27 member's countries), and the
Americas have been attempting to form the Free Trade Area of the Americas (FTAA),the
Association for Southeast Asian Nations (ASEAN), formed a newly emerging market of
Ruihan Mustafa is a Professor at the Faculty of Economics and Business, UniversitiMalaysia Sarawak (UNIMAS), currently onsecondment to Ministry of Higher Education Malaysia.
Kim is a PhD candidate at Universiti Putra Malaysia.
40 TheRitsumeikan Economic Review (Vol.58, No. 5・6)
great potential with over 583 million people (2008).
ASEAN is the fifth largest export market for Republic of Korea (Korea). As ASEAN
member countries continue to enjoy the privileges provided under the ASEAN Free Trade
Area(AFTA),ASEANhave maintained high tariffs with non-members. Both ASEAN and
Korea are facing many common challenges in the post-crisis period, such as growing
competi-tion from China for manufactured export, foreign direct investment, and awareness of
re-gionalism in East Asia. A11 these challenges strengthen the need for economic integration
between ASEAN and Korea.
ASEAN has pursued intensified economic integration, in order to establish a single market
and a regional production network since 1990s. AFTA was established in 1992 to eliminate
trade barriers among the member economies of ASEAN. It has also expanded its membership
to Cambodia, Laos, Vietnam and Myanmar (CLMV). The leaders of ASEAN signed an
agreement that faced an elimination of all import duties by 2010 for the six original members,
and by 2015 for the CLMV countries.
Recently, ASEAN has been making efforts to further strengthen programs of its own
economic integration while at the same time trying to expand and deepen economic ties with
other countries in East Asia. The establishment of an “ASEAN十Three(APT)”framework
together with three Northeast Asian countries-China, Japan and Korea, is a noteworthy new
development in this direction. The momenturn of regional economic integration has been
substantially improved through the intensified bilateral FTA networks in East Asia. In
addi-tion, a number of consultations and feasibility studies, as well as even more serious
negotia-tions were carried out between individual ASEAN member countries and three Northeast
Asian countries. These individual countries' own regionalism attempts notwithstanding,
ASEAN itself hopes to consolidate its position as an“FTA hub country” in the East Asian
region. Considering these trends of ASEAN on the one hand, and individual ASEAN
mem-bers on the other, especially, the country is advised to strike a certain degree of balance
between regional economic integration and global trade liberalization, when pursuing its
ex- ● ● ● ternal economic policies.
While economic integration refers to the removal of barriers to the cross-border flow of
goods, services, capital and labor, economic integration between ASEAN and Korea means
more trade between the two sides before they can contemplate moving toward deeper levels
of integration. AKFTA was signed on 13 December 2005 0n the Trade in Goods, which
stipulated agreements on tariff concessions and rules of origin, and services. It went into
effect on 1 June 2007, together with the Framework Agreement and the Dispute Resolution
Mechanism, following approval of ratification in the Korean National Assembly on 2 April
2007.
Hence, AKFTA needs to be developed as one successful FTA, which both parties can
benefit and make a role of cornerstone as prime mover toward East Asian FTA in the future.
Korea has emphasized the importance of AKFTA over several years as the fifth largest
exporters. ASEAN and Korea needs to be aware of mapping out the practical strategy on a
realistic basis in order to increase mid to longterm trade and service, and FDI between both
ASEAN-KOREA
FREE
TRADE
AREA (RUJHAN・KIM) 41
parties,and develop FTA
which can maximize benefits by the effect of FTA,
such trade
creation,reduction of tariffand not-tariffbarrier and rules of origin.
2 . Dynamic
effects of Regional
Trade
Agreements
Since 1990, global trade liberalization has moved to the wayside, as regional trade
agree-rnents have become the preferred choice in East Asia. East Asian countries began to actively
participate in joining or creating regional trade agreements (Leeand Shin, 2006).0ne might
expect that the liberalization effect of these arrangements to be even smaller than for the
multilateral tariffreductions as regional trade arrangements only lower trade barriers among
member countries(volker,2005).
Currently, over 100 RTAs or FTAs in the world are in different stages of negotiations and
over 200 RTAs agreements have been in effect since 1940s. An overwhelming proportion of
world trade is conducted based on preferential basis within the FTAs and not on MFN basis
any more. FTAs became more common in East Asia after formation of bilateral free trade
areas such as a Singapore-Korea FTA, Japan-Malaysia FTA, and other multilateral FT As
such as an ASEAN-China FTA and ASEAN-Korea FTA.
According to Choi and Jeffrey (2004),econornicbenefits of RTA include the expansion of
trade and associated welfare gains, more secure access to other markets, and other long-run
dynamic effects stemming from increased investments and incentives to implement additional
economic reforms.
The dynamic effects of regional trade agreements are the most significant factors in that
they may lead to increases in the economic growth and real income of member countries
relative to the case under protectionism. The benefits associated with a customs union's
dynamic gains may, more then, offset any unfavorable statice伍?cts.Therefore, dynamic gains
include greater competition and hence will lead to an improvement in efficiency, gains from
greater specialization, economies of scale and learning-by-doing, reduction of intra-regional
transaction costs, some protection from adverse developments in the world markets, and
bargaining power vis一八-visindustrialized countries (Kim,2008).
There are tendencies that an increase in market size as a result of trading agreement will
create more competition between producers in the same industry, and this will then lead to
improvements in production efficiency within member countries. Moreover, the larger market
will create economies of bigger scale in production. From this point of view, it will make the
individual countries become more attractive for multinational enterprises to invest in
produc-ing goods as a response to the needs of the combined larger number of consumers within
member countries.
42 The Ritsumeikan Economic Review (Vol.58, No. 5・6)
3 . Free Trade Agreementin East Asia
Since the financial crisis 1997-98 1n East Asia, a new wave of regionalism has been
preva-lent in featuring the external economic and trade policy of the countries in the region. The
number of FTA initiativesinvolving East Asian countries-in the stage of discussion,
feasibil-ity studies, and officialnegotiation, as well as implemented after successful negotiations-has
been soaring over the last few years. East Asian countries have been alerted to the
ever-increasing regionalist tendency in the world economy and have come to a better
understand-ing of the importance of regional cooperation and integration as a means to avoid
vulnerabili-ties in their financial markets. They also were cautious about the prospective success (or
failure) and outcome of the on-going multilateral trade negotiations under the title of Doha
Development Agenda (DDA),andthus would have wanted to reap the benefits of
liberaliza-tion first at the regional level before the multilateral deal was concluded.
As East Asian countries began to seriously recognize the need for regionalism, FTAs have
become a major issue at the center of their external economic policies. ASEAN transformed
into a unique regional entity alongside the worldwide regionalist, and especially with the
increasing regionalism East Asia. ASEAN currently has been pursuing FTAs with countries
outside the region, such as Australia, India and the United States, leading to increased
com-plexity of management of the FTA networks in the region (Kim,2008).
It is quite interesting to observe that despite ASEAN endeavors to make the entire
South-east Asia region more integrated through its diverse cooperation programs ; its individual
member countries have also been pursuing their own cooperation and integration program
with other countries. In particular, Singapore released a new national development strategy in
February 2003, which would enhance its profile as a leading global city. Singapore has
already signed similar bilateral FT As with New Zealand, Japan, European FT A, Australia,
the Republic of Korea and the United States. Singapore is also in negotiations to form
several more FTAs with Mexico, Canada and India. Thailand has also promoted FTAs with
large economies such as the United States. Thailand recently has signed a bilateral FTA
agreement with Japan, and is considering FTAs with Australia, the United States and India.
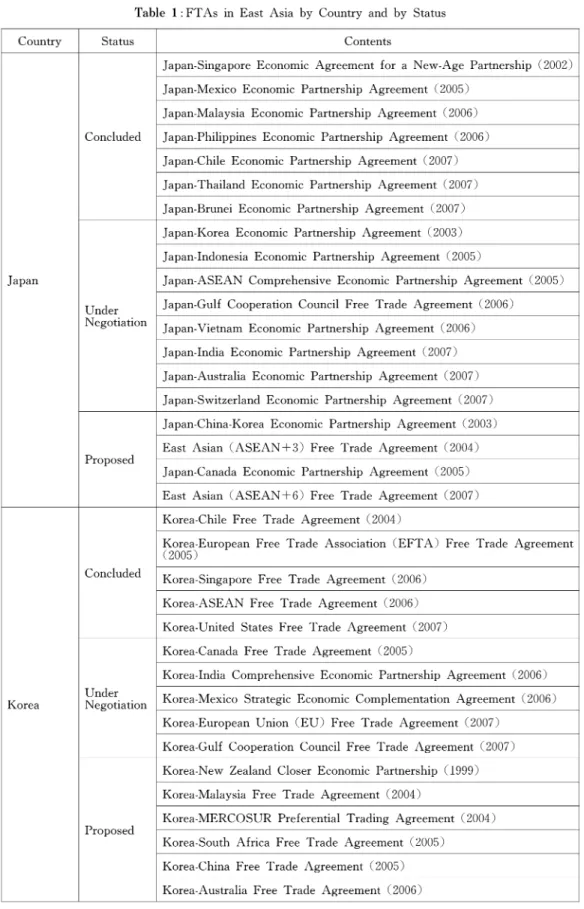
Philippines also has been considering FTAs with the United States, and have been
negotiat-ing an FTA agreement with Japan (Table 1).
These independent FTA approaches of selected ASEAN member countries have led to
conflicts of interests among ASEAN members. ASEAN is naturally concerned about the
potentially negative impacts of this move onto ASEAN's own integration programs, and have
somewhat become skeptical about the possibility ofencouraging further liberalization within
the region. For example, Malaysia and several other Southeast Asian countries have openly
criticized ASEAN members that have formed bilateral FTAs with countries outside the
region, charging that they have the potential to weaken regional cooperation agreements such
as AFTA and would allow economies outside the region to enter the regional market (Table 2).
ASEAN-KOREA FREE TRADE AREA (RUJHAN・KIM)
Table 1 : FTAs in East Asia by Country and by Status
43
Country Status Contents
Japan-Singapore Economic Agreement for a New-Age Partnership (2002) Japan-Mexico Economic Partnership Agreement (2005)
Japan-Malaysia Economic Partnership Agreement (2006) Concluded Japan-Philippines Economic Partnership Agreement (2006) Japan-Chile Economic Partnership Agreement (2007) Japan-Thailand Economic Partnership Agreement (2007) Japan-Brunei Economic Partnership Agreement (2007) Japan-Korea Economic Partnership Agreement (2003) Japan-Indonesia Economic Partnership Agreement (2005)
Japan Japan-ASEAN Comprehensive Economic Partnership Agreement (2005) Under Japan-Gulf Cooperation Council Free Trade Agreement(2006) ● ●
Negotiation Japan-Vietnam Economic Partnership Agreement (2006)
Japan-India Economic Partnership Agreement (2007) Japan-Australia Economic Partnership Agreement (2007) Japan-Switzerland Economic Partnership Agreement (2007) Japan-China-Korea Economic Partnership Agreement (2003) East Asian (ASEAN+3)FreeTrade Agreement (2004) Proposed
Japan-Canada Economic Partnership Agreement (2005) East Asian (ASEAN+6)FreeTrade Agreement (2007) Korea-Chile Free Trade Agreement (2004)
Korea-European Free Trade Association (EFTA)FreeTrade Agreement (2005)
Concluded Korea-Singapore Free Trade Agreement (2006) Korea-ASEAN Free Trade Agreement (2006) Korea-United States Free Trade Agreement (2007) Korea-Canada Free Trade Agreement (2005)
Korea-India Comprehensive Economic Partnership Agreement (2006)
Korea
笥禁乱、ti。エ、Korea-Mexico
Strategic Economic Complementation Agreement (2006) Korea-European Union (EU) Free Trade Agreement (2007)
Korea-Gulf Cooperation Council Free Trade Agreement (2007) Korea-New Zealand Closer Economic Partnership (1999) Korea-M:alaysiaFree Trade Agreement (2004)
Korea-MERCOSUR Preferential Trading Agreement (2004) Proposed
Korea-South Africa Free Trade Agreement (2005) Korea-China Free Trade Agreement (2005) Korea-Australia Free Trade Agreement (2006)
44 The Ritsumeikan Economic Review (Vol.58, No. 5・6) China-Thailand Free Trade Agreement (2003)
China-Hong Kong Closer Economic Partnership Arrangement (2004) China-Macao Closer Economic Partnership Arrangement (2004) Concluded
China-ASEAN Free Trade Agreement (2005) China-Chile Free Trade Agreement (2006) China-Pakistan Free Trade Agreement (2006) China-New Zealand Free Trade Agreement (2004)
China
China-Gulf Cooperation Council Free Trade Agreement (2005) k才jj、
ti。、、China-Australia Free Trade Agreement(2005) China-Singapore Free Trade Agreement (2006) China-Iceland Free Trade Agreement (2006) China-India Regional Trading Arrangement (2003)
Proposed China-South African Customs Union Free Trade Agreement (2004) China-Peru Free Trade Agreement (2006)
Taiwan-Panama Free Trade Agreement (2004) Taiwan-Guatemala Free Trade Agreement (2006) Concluded
Taiwan-Nicaragua Free Trade Agreement (2006) Taiwan
Taiwan-El Salvador-Honduras Free Trade Agreement (2007) Under Taiwan-Paraguay Free Trade Agreement (2004)
● ●
Negotiation Taiwan-Dominican Republic Free Trade Agreement (2006)
Hong Kong yyまでliationHong Kong-New Zealand Closer Economic Partnership Agreement (2001) ASEAN Free Trade Agreement (1993)
Singapore-European Free Trade Association (EFTA)FreeTrade Agree- ment(2001)
Singapore-New Zealand Closer Economic Partnership Agreement (2001) Singapore-Australia Free Trade Agreement (2003)
Concluded Singapore-United States Free Trade Agreement (2004)
Singapore-India Comprehensive Economic Cooperation Agreement (2005) Singapore-Jordan Free Trade Agreement (2005)
Singapore-Panama Free Trade Agreement (2006)
Trans-Pacific Strategic Economic Partnership Agreement (2006) Singapore-M:exico Free Trade Agreement (2000)
Singapore Singapore-Canada
Free Trade Agreement (2002)
ASEAN-India Regional Trade and Investment Agreement (2004) Under Singapore-Pakistan Free Trade Agreement(2005)
● ●
Negotiation ASEAN-Australia and New Zealand Free Trade Agreement(2005)
Singapore-Peru Free Trade Agreement (2006)
Singapore-Gulf Cooperation Council (GCC)FreeTrade Agreement (2006)
ASEAN-KOREA FREE TRADE AREA (RUJHAN・KIM) 45
Singapore-Ukraine Free Trade Agreement (2007)
Singa ore-Sri Lanka Comprehensive Economic Partnership Agreement (2003
y)
Proposed ASEAN-EU Free Trade Agreement (2007)
Singapore-Egypt Free Trade Agreement (2004)口戒e戒 to 1\legotiate signed in 1\Toでember2006]
Thailand-Laos Preferential Trading Arrangement (1991) Concluded Thailand-Australia Free Trade Agreement (2005)
Thailand-New Zealand Closer Economic Partnership Agreement (2005) Thailand-Bahrain Free Trade Agreement (2002)
Thailand-United States Free Trade Agreement (2004) Thailand-India Free Trade Agreement (2004)
Thailand 笥禁乱、ti。エ、Thailand-Peru Free Trade Agreement (2004)
Bay of Bengal Initiative for Multi-Sectoral Technical and Economic Coop- eration (BIMSTEC) Free Trade Area (2004)
Thailand-European Free Trade Association (EFTA)FreeTrade Agree- ment(2005)
Thailand-Pakistan Free Trade Agreement (2004) Proposed Thailand-Chile Free Trade Agreement (2006) Thailand-MERCOSUR Free Trade Agreement (2006)
Concluded 跡詰ntia1 Tariff Arrangement-Group of Eight Developing Countries
Trade Preferential System of the Organization of the Islamic Conference (2004)
M:alaysia-Australia Free Trade Agreement (2005) M:alaysia Under・ . M:alaysia-New Zealand Free Trade Agreement (2005) Negotiation
Malaysia-Pakistan Free Trade Agreement (2005) Malaysia-United States Free Trade Agreement (2006) Malaysia-Chile Free Trade Agreement (2007)
Proposed Malaysia-India Comprehensive Economic Cooperation Agreement (2005) 賢才乱
tioIndonesia-Pakistan Free Trade Agreement(2005) Indonesia-United States Free Trade Agreement (1997)
Indonesia Indonesia-India Comprehensive Economic Cooperation Arrangement Proposed (2004)
Indonesia-European Free Trade Association (EFTA)FreeTrade Agree- ment(2005)
Philippines Proposed Philippines-United States Free Trade Agreement (1989) Brunei Proposed Brunei-United States Free Trade Agreement (2002)
Source :Masahiro, 2007
46 The Ritsumeikan Economic Review (Vol.58, No. 5・6)
Table 2 : ASEAN's Free Trade Agreement
ASEAN WTO/APEC FTA/RTA Concluded FTA/RTA Under Negotiation Country Member
ASEAN-China FTA (Goods and ASEAN-China FTA (Investment) Services) ASEAN-Korea FTA (lnvestment)
ASEAN ASEAN-Korea FTA(Goods and ASEAN-India FTA
Services) ASEAN-Australia & New Zealand FTA ASEAN-Japan (Comprehensive ASEAN-EU
Economic Partnership) ASEAN-US TIFA ASEAN Free Trade Agreement Trade and Investment Framework Brunei Yes/Yes (AFTA) Agreement (TIFA)with the United Darussalam States (2002) ASEAN Free Trade AgreementCambodia Yes/No(AFTA) ASEAN Free Trade Agreement Trade and Investment Framework
Indonesia Yes/Yes (AFTA) Agreement (TIFA) with the United Japan States
Lao PDR No/No でjyty4?ズJ)Free Trade Agreement ASEAN Free Trade Agreement Australia (AFTA) Pakistan Japan india-Comprehensi-v・e Economic Cooperation Agreement(CECA) Malaysia Yes/Yes Korea New Zealand United States EU Chile ASEAN Free Trade AgreementMyanmar Yes/No (AFTA) ASEAN Free Trade Agreement Trade and Investment Framework
Philippines Yes/Yes (AFTA) Agreement (TIFA) with the United Japan States
ASEAN Free Trade Agreement Canada (AFTA) China
Australia The Gulf Cooperation Council Japan Mexico
Switzerland, Iceland, Liechtenstein Peru and Norway Pakistan NewSingapore Yes/Yes Zealand Ukraine Panama
USA Jordan India
Trans-Pa ・ic SEP (Brunei, New Zealand, Chile, Singapore) Korea
ASEAN Free Trade Agreement USA
(AFTA) Chile
Australia Papua New Guinea New Zealand Peru
Thailand Yes/Yes Bahrain Korea China (Preferential Trade Agree- ment on Agriculture, 0ct-03) India
Japan (Closer Economic Partnership)
ASEAN Free Trade Agreement Sri Lanka Vietnam No/Yes(AFTA) 胎゜(P
artnership and Cooperation Agreement)
Last updated on Apr11 2008
ASEAN-KOREA FREE TRADE AREA (RUJHAN・KIM) 47
The recent FTA discussions involving India, Thailand and Singapore and the FTA
initia-tive between India and ASEAN are adding some degree of complexity to this trend as well.
ぺAwhilethese initiatives have contributed to the advancement of East Asian regionalism, the
cooperation and integration projects within ASEAN have suffered problems arising from the
so-called interest and energy distraction(Kim,2008).
3.1 ASEAN economic integration
The growing support for regionalization in East Asia has roots in economic globalization
and the desire of East Asians to follow in the footsteps of NAFTA and the EU, as well as a
growing competition between China and Japan for regional leadership. Both forces tend to
put ASEAN geographically as well as politically at the center of important developments。
The aims and purpose of ASEAN are mainly to accelerate economic growth, social
prog-ress and cultural development in the region and to further promote regional peace and
stability through abiding respect for justice and the rule of law in the relationship among
countries in the region as well as adherence to the principles of the United Nations Charter.
In the recent past, ASEAN economic integration has been driven by the process itself
where-by ASEAN has progressively advanced the completion date of AFTA and moved to a zero
tariff end goal (Hadi,2005)。
ASEAN has come a long way since its beginnings but both the group and the world have
undergone dramatic changes over this period-changes that have presented new challenges and
demands. Based on performance shown, closer and deeper integration of the ten ASEAN
economies will play a critical role in rebuilding the group's competitiveness and paving the
way for higher rates of growth and wealth creation。
Today, ASEAN is seen to have achieved considerably high economic growth and stability
as well as registering a significant drop in poverty, in addition to enjoying a substantially
high level of investment and trade liberalization. Member countries have pursued economic
integration as stated in ASEAN 2020 and have tried to promote and realize the activation of
human resources, services, non-tariffs and the ASEAN single market. Moreover, this enhances
ASEAN economic cooperation through economic development strategies, which, in turn, will
focus on sustainable and equitable growth。
In fact, ASEAN plays a leading role as the hub of wider East Asian economic and
political integration by offering an established market for regional trade, and an important
platform for regional political concerns and economic dialogue via the East Asia Summit
(EAS),ASEAN Regional Forum (ARF), and APT formula.
3.2 ASEAN Free Trade Area (AFTA)
AFTA was established in January 1992 at the fourth ASEAN Summit in Singapore. The
ultimate objectives of AFTA are to increase ASEAN's competitive advantage as a production
base in the world market through the elimination of intra-tariffsand non-tariff barriers, and to
attract more foreign direct investment (FDI)toASEAN.
The primary mechanism for achieving the goals given above is the Common Effective
48 TheRitsumeikan Economic Review (Vol.58, No. 5・6)
Preferential Tariff(CEPT)scheme.TheCEPT scheme is a cooperative arrangement among
ASEAN member countries that would reduce intra-regional tariffs and remove non-tariff
barriers over a 10-year period commencing 1 January 1993. Under the CEPT scheme,
Malaysia, Philippines, Thailand, Indonesia, Brunei and Singapore (Asean 6) have agreed to
reduce tariffs on all manufactured goods to O−5%,which is targeted by the year 2002. Newer
members of ASEAN, namely CLMV have been given a 10-year grace period in order to
reduce tariffs from the time of their membership of ASEAN. In the case of Vietnam, it was
targeted to reduce tariffs to O−5%by 2006, Laos and Myanmar (2008)and Cambodia (2010).
Based on the CEPT scheme, ASEAN member countries also have the option of excluding
products from the CEPT in three cases :Temporary Exclusion List, Sensitive List and
Gener-a1Exception List。
Temporary exclusions refer to products for which tariffs will be lowered to O−5 %, but
which are still being protected temporarily by the postponement in tariff reductions. The
Sensitive List, mainly consisting of agriculture-based products such as rice are given a period
of time to reduce the tariff levels to O −5 % unt11 2010. General Exception List refers to
products of which an ASEAN member deems necessary for the protection of national
secur-ity, the protection of public morals, the protection of human, animal or plant life and health,
and the protection of articles of artistic historic value. ASEAN member countries have signed
to execute a 0% tariffrates on all imports by 2010 for the origina1 6 member countries, and
by 2015 for the CLMV。
The pace of removing and reducing tariff barriers can also be accelerated and the range of
tariffreduction could be extended if countries undertake the efforts to expand the coverage of
products(Kim,2008).Eventhough each government reduces its tariff,another barrier-in the
form of non-tariff barriers-poses problems for the growth of trade and in boosting integration
in ASEAN because non-tariff barriers can be used as tools of protecting its domestic product
and industry・
3 。3 AFTA-Plus Program
ASEAN-10 was created by expanding the membership to CLMV countries, which resulted
in a single market and integrated production network of 583 million people (2008).The
aggregate Gross Domestic Product (GDP)ofASEAN amounts to us 届86 billion. ASEAN
is characterized by high degree of diversity in terms of area, population and economic size
measured by the GDP volume, as well as the level of economic development. The degree of
openness in ASEAN is also widespread. The core elements of ASEAN's
economic integra-tion are as follows : first,the CEPT scheme requires that tariffrates levied on a wide range
of products traded within the region be reduced to no higher than five percent ; second, the
ASEAN Industrial Cooperation (AICO)programhas been introduced as an initiative to
applylow tariffs on a limited number of products desig皿ted for industrial cooperation ; and
third, the ASEAN Investment Area (AIA)is in the stage of introduction as a measure to
● ● ●
ensure free intra-regional investment.
ASEAN member countries agreed to speed up the establishment of AFTA. AFTA is not
ASEAN-KOREA FREE TRADE AREA (RUJHAN・KIM)
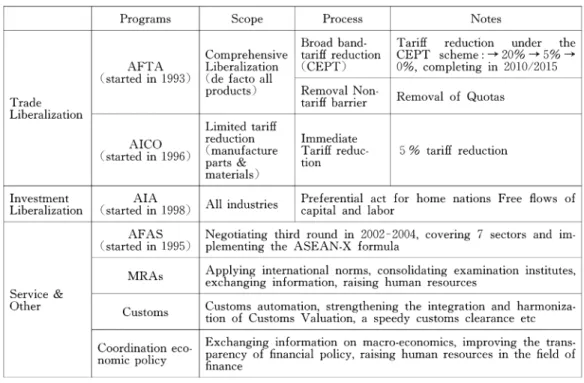
Table 3 : AFTA-Plus Programs for ASEAN Economic Integration
49
Programs Scope Process Notes Broad band- Tariff reduction under the Comprehensive tariff reduction CEPT scheme : →20%→5%→ AFTA Liberalization (CEPT) 0%, completing in 2010/2015 (started in ↓993) (de facto a11
products) Removal
Non- RemovalTrade tariffbarrier of Quotas Liberalization
Limited tariff reduction Immediate
(started in 1996) (manufacture T出征reduc- 5 % tariff reduction parts & tion
materials)
Investment AIA Preferential act for home nations Free flows of Liberalization ( started in 1998) All industries capital and labor
AFAS Negotiating third round in 2002 −2004, covering 7 sectors and im- ( started in 1995) plementing the ASEAN-X formula
RA Applying international norms, consolidating examination institutes, M s ● ● ● ● ●
exchanging information, raising human resources Service &
Other C Customs automation, strengthening the integration and harmoniza- ustoms tion of Customs Valuation, a speedy customs clearance etc
Exchanging information on macro-economics improving the trans- Coordination eco- ・ ・ ・. ゛ ・ parency of financial policy raising human resources m the field of nomic policy ゛
finance
Source : K'won (2004)
just about reducing intra-ASEAN tariff on traded goods and service. AFTA also has a
program to deepen regional integration by extending the agenda beyond the liberalization of
barriers to trade in goods and service and has been trying to accelerate the process of
Southeast Asian market integration through its so-called AFTA-Plus program, which includes
the ASEAN Framework Agreement on Services (AFAS),theAIA and the harmonization of
standards, reciprocal recognition of tests and certification of products, harmonization of
cus-torns procedures, removal of barriers to foreign investment (as part of the proposal for
ASEAN Investment Area) as well as macroeconomic consultation of venture capital. Jayant
(2007), identified that the AFTA-Plus Program pursues to deal with issues such as
trade-related investment measures (TRIMs)and trade-related intellectual property provisions
(TRIPs),aswell as the protection of copyrights, patents, and trademarks (Table 3).
4. Korea-ASEAN Economic Relations
4. 1 Korea-ASEAN Bilateral Trade
Economic relations between ASEAN and Korea have expanded significantly over several
decades. ASEAN became one of the largest potential emerging markets to attract Korean
companies and others. In 2007, ASEAN became Korea's fifth largest trade partner after
China, the U. S・,Japan and the European. Korea is also the 3rd largest economy in Asia, and
50 TheRitsumeikan Economic Review (Vol.58, No. 5・6)
the 12th largest in the world, based on its GDP growth as of 2007.
Although bilateral trade and investment between ASEAN and Korea decreased sharply
due to the East Asian financial crisis,economic relations between the two sides have rapidly
recovered. In particular, bilateral trade rebounded to US$26.3 billion at the end of 1999 and
expanded to us $72 .8 billion in 2007, higher than the pre-crisis level. Data from Korea
International Trade Association (2007)shows that Korean exports to ASEAN increased 38
percent to reach US$38.7 billion in 2007 while imports from ASEAN have also been on the
rise. Korea has recorded a consistent trade surplus with a peak surplus of US$5.4 billion in
1999 (Kim, 2008). However, since the financial crisis, ASEAN's deficit has been decreasing,
and the balance of trade between the two economies is moving toward equilibrium (Kwon,
2004).
4 .2Korea-ASEAN
Free
Trade Agreement
The
former Korean President (Roh, Moo
Hyun)proposed
that ASEAN
and Korea should
deepen and broaden relationsby strengthening a comprehensive economic
partnership,includ-ing the ASEAN-Korea Free
Trade Agreement,
during the ASEAN-Korea Summit
held in
Bali (Indonesia) in October 2003. The
proposal was, in part, a directionto accelerate the
pace of the ASEAN
Free Trade Agreement
that was conducted with China and Japan.
The
negotiation for an AKFTA
was launched in early 2005. 1nDecember
2005,at the
ASEAN-Korea Summit
held in Malaysia, the Framework
Agreement
on Comprehensive
Economic
Co-operation between
ASEAN
and Korea was signed. This Framework
Agreement
called for the conclusion of key agreements, such as the agreement on Trade in Goods
and
Services,Investment Agreement
and Agreement
on Dispute Settlement Mechanism
(Table 4).
Table 4 :Measures for Comprehensive Economic Partnership
The Parties shall establish, consistent with Article XXIV of GATT 1994 and Article v of GATS, a AKFTA and strengthen and enhance economic cooperation through the following :
(8)progressiveelimination of tariffs and non-tariff barriers in substantially all trade in goods ; ㈲ progressive liberalization of trade in services with substantial sectorial coverage;
(c) establishment of an open and competitive investment regime that facilitates and promotes in- vestment among the Parties ;
尚provision of special and differential treatment to the ASEAN Member Countries and additional flexibility to the new ASEAN Member Countries as agreed in the Joint Declaration on Compre- hensive Cooperation Partnership between Korea and ASEAN and the core elements attached thereto ;
㈱provision of flexibility to the Parties in the Korea-ASEAN FTA negotiations to address their sensitive areas in the goods, services and investment sectors with such flexibility to be negotiated and mutually agreed based on the principle of reciprocity and mutual benefits ;
(f) establishment of effective trade and investment facilitation measures ;
(g) exploration of the ways and means to expand their economic partnership into new areas and expansion of economic cooperation in areas as may be agreed among the Parties that will comple- ment the deepening of trade and investment link among the Parties ; and
㈲ Establishment of appropriate procedures and mechanisms for the purposes of effective imple- mentation of this Framework Agreement.
Source:FRAMEべA^ORKAGREEMENT ON COMPREHENSIVE ECONOMIC COOPERATION AMONG THE GOVERN MENTS OF THE REPUBLIC OF KOREA AND ASEAN
ASEAN-KOREA FREE TRADE AREA (RUJHAN・KIM) 51
The AKFTA on the Trade in Goods went into effect on June 1,2007, together alongwith
the Framework Agreement and the Dispute Resolution Mechanism, following approval of
ratification in the Korean National Assembly on Apr11 2,2007. As a result, 63% of the total
imported goods from ASEAN is now duty-free, while 45% of commodity exports to ASEAN
enjoy low-tariff benefits within the 0-5% range.
The establishment of AKFTA is seen as a natural extension of the existing relations as
well as astepping-stone to elevate the ASEAN and Korea relationship to higher and more
comprehensive level. AKFTA is similar to other ASEAN FTAs in terms of its
comprehen-sive scope and provision for flexibilityto deal with the CLMV countries (Hadi, 2005).
4.3 AKFTA and Trade in Goods
Since the signing of AKFTA for trade in goods, ASEAN and Korea have tried to
acceler-ate the maximization of their profits from free trade in goods through the elimination of tariff
and non-tariff barriers by 2010. Exceptionally, the CLMV countries were allowed a grace
period to eliminate their tariff;2016 for Vietnam and 2018 for Cambodia, Laos and]Myanmar.
In AKFTA, products traded between two areas are divided into two different tracks; normal
track, sensitive track and highly sensitive track (Park, 2006).
According to the tariffconcession of AKFTA-Trade in Goods Agreement, the tarifflines in
the Normal Track are seen to have their Most Favored Nations (MFN) tariffrates gradually
reduced and eliminated as following schedule in Table 5 :
Table 5 : Tariff reduction timeline for products under the Normal Track for ASEAN 6十Korea
AKFTA Preferential Tariff Rate (Not later than 1 January) X二Applied MFN Tariff Rate
2007* 2008 2009 2010** X迦20% 13 10 50 0 15%弓X<20% 10 8 5 0 10%ぷX<10% 8 5 3 0 5%£X<10% 5 3 0 0 X<5% Standsti11 0 0
* The first date of implementation was ]尹June 2007
** Flexibility to delay tariff elimination to ]尹January 2012 for a maximum of 5% of a11Normal Track lines for ASEAN 6 0nly
Source :Trade Intelligence Asia Pacific
Korea needs to reduce its tariffs for at least 70 percent of the tarifflines placed in the
Normal Track upon entry into force of the Trade in Goods Agreement. It was required to
eliminate its tariffs for at least 95 percent of the tarifflines in the Normal Track not later
than January 1,2008 and eliminate all tariffs placed in the Normal Track by no later than
January 1, 2010.
For ASEAN-6, each party is to reduce its tariff rates for at least 50 percent of the tariff
lines in the Normal Track to O−5 percent not later than January 1,2007. Each party is to
eliminate its tari鉛白[or at least 90 percent of the tarifflines no later than January 1,2009 and
52 TheRitsumeikan Economic Review (Vol.58, No. 5・6)
to further eliminate its tariffsにforall tarifflines no more later than January 1,2010, with the
flexibilityto have tarifflines not exceeding 5 percent of all the tarifflines, or as listed in an
agreed schedule eliminated no later than January 2012 (Lee,2006).vietnamis given an
additiona1 6 years while Cambodia, Laos and Myanmar were also given an additiona1 8 years.
According to the Sensitive Track, the schedules to reduce and eliminate tariffrates of the
tarifflines were placed in the Sensitive List For instance, Korea and ASEAN-6 are to reduce
tariff rates to 20 percent no later than January L 2012 and these tariff rates are to be
subsequently reduced to O−5percent no later than January 2016. For Vietnam, tariffrates are
to be reduced to 20 percent no later than January L 2017 and subsequently reduced to O−5
percent no later than January 1, 2021. For Cambodia, Laos, and Myanmar, they are to be
reduced to 20 percent no later than January 1,2020 and subsequently reduced to O−5percent
no later than January 2024 (Table 6)。
Table 6 : Tariff rate for the Normal Track and Sensitive Track for ASEAN 6十Korea
FTA Elements Commitments Normal Track ASEAN 6
― Thresholds − 50% of tarifflines in the NT at O-5%by 2007 −90%of tarifflines in the NT at O%by 2009
−A11 tariffs in the NT at O%by 2010, with flexibility to have tariff lines not exceeding 5% of all tariff lines or as listed in an agreed schedule, by 2012 −A11 tariffs in the NT eliminated by 2012
Korea :
−70%of tarifflines in the NT at O%upon entry into force of the Agreement −95%of tarifflines in the NT at O%by 2008
−A11 tariffs in the NT eliminated by 2010
Sensitive Track 10%of all tarifflines and 10%of total import value based on 2004 ● ●― Cap statistics
― Category Sensitive and Highly Sensitive List
― SL/HSL Ratio SL : 7% of all tarifflines and 7% of total import value
― Thresholds HSL : 200 tarifflines or 3%of all tarifflines and 3% of total import value SL:ASEAN 6 and Korea
― Reduction to 20%by 2012 ― Reduction to O-5%by 20↓6 HSL:ASEAN 6 and Korea
Group A : Reduction to not more than 50%by 2016 Group B : Reduction by not less than 20%by 2016 Group C : Reduction by not less than 50%by 2016 Group D : Tariff lines subject to TRQs
Group E : Tariff lines exempted from concessions(maximumof 40 tariff lines)
Source :Trade Intelligence Asia Pa ・ic
The tarifflines placed in a party's Highly Sensitive List are categorized into five groups.
For Group A,tarifflines are subject to a 50percent tariffrate cap ; for Group B, tarifflines
are subject to tariff reduction by 20 percent ; for Group C, tarifflines are subject to tariff
reduction by 50 percent ; for Group D, tarifflines are subject to tariff rate quotas ; whereas
for Group E,tarifflines are exempted from tariffconcession. For each group, the parties are
ASEAN-KOREA FREE TRADE AREA (RUJHAN・KIM) 53
to undertake defined coramitments. For instance, Korea and ASEAN-6 are to reduce the
tariffs rates of tarifflines placed in Group A by not more than 50 percent and no later than
January 1,2016, and the number of tarifflines, which each party can place in Group E,is
subject to a maximum ceiling of 40 tarifflines at the HS 6-digit level (Lee,2006).
4 。4 Rules of Orig-in
In the AKFTA, one of the main components is the rules of origin(ROO).Theserules are
fundamental to the functioning of a free trade area as they indicate whatever or not a given
produce can be traded under the AKFTA. One of the main functions of the RoO is to
determine to what extent a domestic product may contain imported materials from another
country outside the free trade area concerned without losingtheir preferential status under
the AKFTA. The determination of the country of origin is, in general, divided into two
categories :(i)goodswholly obtained and produced in one country and (ii)goods whose
production involves more than one country。
4 。4 。1 Wholly Obtained or Produced Goods
For goods wholly produced or obtained in one country, it is obvious that the country of
production is the originating country. According to Annex Ill of the KAFTA, wholly
obtained products are defined as shown in Table 7.
Table 7 :Wholly obtained or Produced Goods
Rule 3 : Wholly Obtained or Produced Goods
Within the meaning of paragraph 1 (a) of Rule 2,the following shall be considered to be wholly obtained or produced in the territory of a Party :
(a) plants and plant products harvested, picked or gathered after being grown there ; ㈲ live animals born and raised there ;
(c)goods obtained from live animals referred to in sub-paragraph (b);
(d)goods obtained from hunting, trapping, fishiner, aquaculture, gathering or capturing conducted there;
㈱ minerals and other naturally occurring substances, not included in sub-paragraphs (3)through(d), extracted or taken from its soil, waters, seabed or beneath its seabed ;
巾 products of sea一弘hingtaken by vessels registered with the Party and entitled to fly its flag, and other products taken by the Party or a person of that Party, from the waters, seabed or beneath the seabed outside the territorial waters of the Party, provided that the Party has the rights to exploitl) the natural resources of such waters, seabed and beneath the seabed under international law ; ㈲ ㈲ j 一 I ぐ う ● J ぐ ( k ) ①
products of sea一弘hing and other marine products taken from the high seas by vessels reg-istered with the Party and entitled to fly its flag;
goods produced and/or made on board factory ships registered with a Party and entitled to fly its flag, exclusively from products referred to in sub-paragraph ㈲;
goods taken from outer space provided that they are obtained by the Party or a person of that Party;
articles collected from there which can no longer perform their original purpose nor are capable of being restored or repaired and are fit only for the disposal or recovery of parts of raw materials, or for recycling purposes ; law such as the United Nations Convention on the Law of the Sea.
waste and scrap derived from :(i) production there ; or (ii) used goods collected there, provided that such goods are 伍 only for the recovery of raw materials ; and
goods obtained or produced in the territory of the Party solely from goods referred to in sub-paragraphs (a) throuerh (k).
Source :AKFTA Annex III, Rule 3,obtained from AKFTA document signed at ASEAN-Europe Meeting-Republic of Korea (AEM-ROK)inKuala Lumpur, Malaysia on 24 August 2006, available at ASEAN Secretariat(http://www.v.aseansec. . org).
54 TheRitsumeikan Economic Review (Vol.58, No. 5・6)
4.4 .2 Not Wholly Obtained or Produced Goods
For goods that involve more than one country of production, importing countries have to
set clear, spe ・ic and transparent rules to determine their origination so that exporters can
recognize the rules and follow them accordingly. The percentage criteria,or the value added
criteria,are also widely used in FTAs. However, rather than being used independently, they
are usually adopted in combination with the change in tariffclassification method or used as
an optional test The basis on which the percentage of origination/non-originating materials is
to be calculated is an important element (Lee,2006).
4 . 5 Korea FTA policy
Over 50 years, Korea government has pursued an export-oriented economy with
compre-hensive steps to expedite trade with trade partners. However, trade and investment have
recently seen to be concentrating on a regional context. To meet the market expectation,
Korea has diversified its trading and investment partners by stressing on the global
commun-ity as its main partner for economic cooperation to stabilizing effect on the Korea economy。
Korea government also has plans to pursue FT As with its major trading partners in order
to achieve the maximization of its nation's profit and also to avoid isolation from the
worl-dwide trend of regionalism. Moreover, Korea aims to pursue high-levels of FTAs in terms of
degree of liberalization and these FTAs will be comprehensive in terms of its coverage and
scope purposes. A multi-track approach will be used when negotiating FTAs, meaning that
the negotiations can be carried out simultaneously with more than one country when and if
necessary。
According to Korean Institute for International Economic Planning (KIEP),in selecting
and carrying forward the AKFTA, Korea has taken into account all key factors which will
cover all considerations such as economic benefits, political and diplomatic considerations,
domestic constraints, and the industrial effect such as the vulnerability of the agriculture and
the effect to infant industries, and investment relations. However, given the diversity of
ASEAN countries, in terms of stage of economic development (the difference of economic
structure and policy), different political systems, and variety of sensitive sectors (agriculture,
auto mobile and others), it has taken a great deal of time and effort to establish FTAs
between ASEAN and Korea.
5 . Foreign Direct Investment
5.1 Recent FDT trend
As one of the world's fastest growing economy bloc, ASEAN has attracted a larger
amount of FDI over the last several decades and has been one of the largest FDI recipients
amongst the developing area. China and India are beginning to challenge the dominance of
the Asian newly industrializing economies-Hong Kong, Korea, Singapore and Taiwan-as the
main sources of FDI in developing Asia (UNCTAD,2007).Generally,FDlto ASEAN has
ASEAN-KOREA FREE TRADE AREA (RUJHAN・KIM) 55
been strong over the past few years in terras of flows and rate of growth after a period of
slow growth associated with Asian crisis in 1997.
5.2 FDI inflows in ASEAN
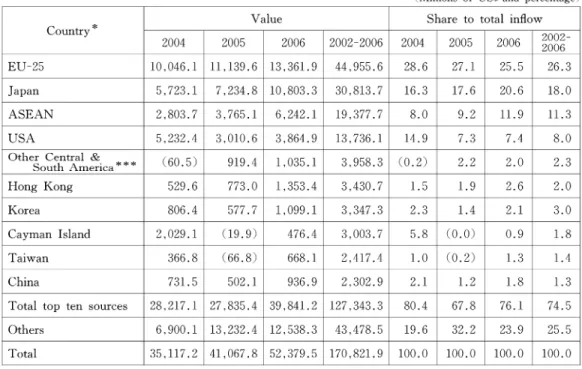
Table 8 shows the sources of FDI inflows to ASEAN in a global context over the 2004−
2006 periods. FDI inflows to ASEAN have more almost tripled since 2002 to US$52.4 billion
in 2006. These flows have been concentrated in the developed countries ; the United States
and the EU member-states alone have consistently accounted for more than half of FDI
inflow to ASEAN.
Table 8 : Ten sources of ASEAN FDI inflow
(Millions ofUS$ and percentage)
Value Share to total inflow Country* 2002- 2004 2005 2006 2002-2006 2004 2005 2006 2006 EU-25 10,046.1 11,139.6 13,361.9 44,955.6 28.6 27.1 25.5 26.3 Japan 5,723.1 7,234.8 10,803.3 30,813.7 16.3 17.6 20.6 18.0 ASEAN 2,803.7 3,765.1 6,242.1 19 , 377.7 8.0 9.2 11.9 11.3 USA 5,232.4 3,010.6 3,864.9 13,736.1 14.9 7.3 7.4 8.0 0th7 0 ?茫tJぐこ恋 ca*** (60.5) 919.4 1,035.1 3,958.3 (0.2) 2.2 2.0 2.3 Hong Kong 529.6 773.0 1,353.4 3,430.7 1.5 1.9 2.6 2.0 Korea 806.4 577.7 1,099.1 3,347.3 2.3 1.4 2.1 3.0 Cayman Island 2,029.1 (19.9) 476.4 3,003.7 5.8 (0.㈲ 0.9 1.8 Taiwan 366.8 (66.8) 668.1 2,417.4 1.0 (0.2) 1.3 1.4 China 73↓.5 502.1 936.9 2,302.9 2.1 ↓.2 1.8 1.3 Total top ten sources 28,217.1 27,835.4 39,841.2 127,343.3 80.4 67.8 76.1 74.5 0thers 6,900.1 13,232.4 12,538.3 43,478.5 19.6 32.2 23.9 25.5 Tota1 35,117.2 41,067.8 52,379.5 170,821.9 100.0 100.0 100.0 100.0
Source : ASEAN Trade Database
* Identified based on cumulative FDI inflow from 2001 −2005
**lncludes Austria, Belgium, Cyprus, Czech Republic, Denmark, Estonia, Finland, France, Germany, Greece, Hungary, Ireland, Italy, Latvia, Lithuania, Luxembourg, Malta, the Netherlands, Poland, Portugal, Slovakia, Slovenia, Spain, Sweden, and United Kingdom
***lncludes countries in Central and South America, other than Argentina, Brazil, Mexico and Panama
Inflows from Japan and South Korea have actually been insignificant. FDI inflows into
ASEAN as a percentage of total world inflows have dropped from their highs of the
mid-1990s when ASEAN countries accounted for about 8 percent of world inflows to the current
percentage of about 11 。3 percent in 2006. Clearly,the cause for this downward trend was
related to the Asian Crisis, which not only affected ASEAN countries but also other East
Asian countries like China, though the Chinese share picked up relatively rapidly after the
Crisis. Inward FDIs from China has been on the rise in percentage terms.
Table g shows FDI inflows into ASEAN registered a 20.9% increase in 2006 to reach their
second highest ever level of US$69 billion.In particular, FDI flows to Singapore rose by 79.5
56 The Ritsumeikan Economic Review (Vol.58, No. 5・6) Table 9 : FDI Inflows to ASEAN, selected years
(Millions ofus$ and percentage)
1990ぷ。 2004 2005 2006 Countries FDI Flows 1990ぷ 2003 2004 2005 20062000
2000 As percentage of gross fixed capital formation Inward 349 3 , 375 334 289 434 80.4 64.1 48.8 69.5 Brunei Outward 45 76 4 35 38 10.4 0.8 5.8 6.1 1nward 3,198 5,235 5,862 8,957 9,751 9.4 14.0 17.5 16.5 Thailand Outward 370 621 76 552 790 0.7 0.2 1.1 1.3 1nward 4,722 2,473 4,624 3,965 6,060 18.3 ↓9.1 15.2 20.↓ Malaysia Outward 1,550 1,369 2,061 2,972 6,041 5.2 8.5 11.4 20.1 1nward 1,289 491 688 1 , 854 2,345 8.8 4.9 12.6 14.1 Philippines Outward 151 303 579 189 103 1.0 4.1 1.3 0.6 1nward 1,547 597 1,896 8,337 5,556 1.9 3.4 12.3 6.4 1ndonesia Outward 622 213 3,408 3,065 3,4↓8 1.4 6.2 4.5 3.9 1nward 9,204 11,664 19,828 15,004 24,207 36.2 77.5 57.6 79.5 Singapore Outward 4,757 2,695 8,074 5,034 8,626 17.4 31.5 19.3 28.3 1nward 155 84 131 381 483 36.0 11.4 32.3 38.9 Cambodia Outward 12 10 10 6 8 2.6 0.9 0.5 0.7 1nward 50 19 17 28 ↓87 27.6 3.9 5.8 37.↓ Laos Outward 3 − − − − 1.2 − − − Inward 346 291 251 236 143 37.4 22.3 18.8 10.8 Myanmar Outward − − − − − − − − − Inward 1,322 1,450 1,610 2,021 2,315 29.4 10.6 11.5 12.5 Vietnam Outward − − − 65 70 − − 0.4 0.4 1nward 30,104 53,505 60,630 72,406 69,468 13.7 ↓9.6 19.8 20.9 ASEAN Outward 2,195 2,855 5,498 12,261 16,130 4.5 8.7 5.8 7.8
Source :World Investment Report 2007,UNCTAD *:Annual Average
**:Annual Average
%, representing a new high of us $24 billion(Kim,2008).As a distribution hub and
financial centre in the sub-region, the country accounts for almost half of total inflows to
ASEAN and continues to receive most of its FDI in services (mainly trade and finance). FDI
inflows to Thailand continued to rise by 16.5% in 2006, reaching a record US$9.7 billion and
consolidating the country's position as the second largest FDI recipient in ASEAN. Inflows to
Malaysia and the Philippines have also rised substantially : by 20.1 %in the former, to its
highest level since the Asian financial crisis(US$6 billion), and by 14.1% in the latter to its
highest level ever (US$2.3 billion). Indonesia saw a substantial decline (33%) in FDI
in-flows, thus breaking the positive trend from 2005.
The performance of other ASEAN member countries in attracting FDI in 2006 was
ASEAN-KOREA FREE TRADE AREA (RUJHAN・KIM) 57
ally significant. Laos witnessed a six-fold growth, the highest among countries in the
sub-region, while inflows to Cambodia also rose. In Vietnam, FDI rose by 12.5% to reach us
$2 。3 billion,and the country is increasingly considered an attractive location for
efficiency-seeking FDIs and some view it as an attractive alternative.
5.3 ASEAN-Korea FDI
The firstKorean outflows direct investment to Southeast Asia was established as a purpose
of developing forests in Indonesia in 1960. Korean FDI reached full scale in the 1980s, and
since the mid-1980s, Korean companies have looked to ASEAN countries as a source of
inexpensive labor as well as abundant natural resources. In particular, Korean companies also
exported manufactured goods produced in ASEAN to developed countries. Such a strategy
allowed these firms to bypass the trade barriers to Korean products in third country markets.
As a result, Korean investment to ASEAN began to become concentrated in labor-intensive
industries such as footwear, textiles and electronics. Even though Korea's investment in
ASEAN declined in 1993 and 1994-mainly because many Korean companies were investing
heavily in China-it increased again when large Korean conglomerates began directing their
investments towards ASEAN countries including Indonesia and Vietnam. As the purchasing
power of ASEAN member countries became diversified, Korean firms also began to shift
their investment patterns to market-oriented investments after the mid-1990s. However,
Ko-rean investments toward ASEAN has greatly declined due to the financial crisis and it
remains below the level of 1997. The emergence of China has been another reason for the
relative decline of Korean investments。
From the aspect of investment scales, investment to ASEAN had continuously increased
from the micl-1980s. The total amount of investment to ASEAN reached 30 percent in 1991,
but due to investments in China after the normalization of diplomatic relations between
Korea and China, FDIs towards the ASEAN region decreased until the mid-1990s. In the late
1990s, it regained its upward trend. However, ASEAN's share in Korea's total Investments
decreased due to stagnation of the ASEAN economy and the rapid increase of investment in
China. Nevertheless, investment in Southeast Asia has climbed upwards again with the recent
recovery of the ASEAN economy. In 2007, Korea's total investment to ASEAN reached us
$3,043 million (Table 10)。
Kim (2008) identified Vietnam as the most significant FDI destination for Korea among
ASEAN nations composing 29.6 percent of the remaining investment amount. Although
Korea has only been investing in Vietnam since 1992, the country has emerged as the most
popular destination among ASEAN leading members, namely Thailand, Malaysia, Singapore
and the Philippines。
Indonesia is an attractive destination for investment with 23.2 percent. Among the ASEAN
10 members, 92 percent of total investments are concentrated in the ASEAN 6,which
in-eludes Indonesia, Vietnam, Thailand, Philippines, and Singapore, while only 8 percent are
focused on Myanmar, Cambodia, Laos, and Brunei。
Kim (2008) explains in Table 11 the current trend and the cumulative state of Korean
58 The Ritsumeikan Economic Review (Vol.58, No. 5・6)
Table 10 : FDI by Year &Country(TotaIAcceptance & Investment as for a period of each year) (Unit:US$1,000) 2003 2004 2005 2006 2007 Tota1 1968-2007 Brune1 0 0 0 92 0 2,014 Thailand 31 , 770 46,065 51,597 72,363 140,317 966,423 Malaysia ↓3,068 38,368 22,696 58,752 125,927 705,048 Philippines 16,942 19,165 40,628 60,868 105,279 927,262 1ndonesia 82 , 357 56,380 93,667 138,081 244,820 2,729,338 Singapore 234,563 168,978 126,016 303,849 506,553 1,990,096 Cambodia 9,669 13,529 31,745 125,438 624,494 840,806 Laos 746 2,090 0 207 11,490 67,↓72 Myanmar 891 0 969 465 1,068 58,430 Vietnam 156 , 402 178,170 309,612 588,407 1,269,883 3,490,671 Tota1 546,083 522,745 676,928 1,351,130 3,042,888 11,777,260
Source:The Export-Import Bank of Korea
investment towards ASEAN by industry, the manufacturing sector encompasses nearly a11
1ndustries, comprising 52.2 percent of the total investment. Based on the total investment,
whole and retail sales, mining & quarrying, real estate and services, construction industries
and telecommunications follow the manufacturing industry. It also shows that the investment
towards ASEAN in the telecommunication sector is on an upward trend.
Korean firms began to invest further into ASEAN especially Vietnam, Indonesia, Singapore
and Cambodia, after AKFTA between the two countries came into effect on ]尹June 2007.
Korea firms were expected to invest primarily in infrastructure construction, manufacturing
and real estate. In 2007, Korea was ranked first among countries and territories investing
Vietnam with US$1 ,270 million and Cambodia with US$624 million. Currently, ASEAN has
increasingly become an attractive business destination for Korean firms, as multinational
companies such as Samsung (Electronics, Construction, Heavy Industry etc), LG
(Electronics), POSCO (Steel), and Hyundai & KIA (Car manufacturing) have kicked o任
new investments or have expanded their business in ASEAN.
y[ostKorean firms have formed production networks and supplychains throughout
South-east Asia. They have divided their production processes into multiple sub-process and located
these sub-process in different countries based on the comparative advantage i.e・,relative
factor proportions and technological capabilities. This tendency has helped promote the
dyna-mic evolution of intra-regional division of labor and has led to the rise of vertical
intra-industry trade in parts, components, and semi-finished and finished manufactured products.
Even small-and medium-sized firms are expected to increase their investments into the market
or shift their regional representative or manufacturing fa ・itiesfrom China to Southeast Asia
in order to diversify and expand their business.
This FTA in services will definitely help both the parties to capitalize on the economic