カナダ・ブリティッシュ・コロンビア州・バンクーバの霧についての気候学的研究
21
0
0
全文
(2) Journal of Hokkaido University of Education (Section H B) Vol. 30, No. 1 September, 1979. C^it^H:^-!Ne® (^ 2 g|SB ) US 30 ^ ^ 1 ^- HgW 54 ^ 9 ^. A Climatological Analysis of the Fog at Vancouver, B. C. Canada. Kazuo FUKAISHI Laboratory of Geography, Kushiro College, Hokkaido University of Education, Kushiro 085. '^W—^ : t!^-y ' 7"IJT^ 'y>^ • ^^y\irw • ^^^-^^-y). H^-^-Cc7)jn.^?%. ww^±^mwmw^ Abstract Secular changes in annual fog frequency at Vancouver International Airport have been noted by several previous workers, some of whom have attributed the changes to increasing urban and industrial influences. This paper discusses the relationships between fog occurrence, synoptic weather regimes and secular changes in fog frequency on the Pacific Coast of Canada. It de-. scribes the atmospheric conditions which are associated with both fog occurrence and particular synoptic weather patterns, largely through an analysis of meteorological data for Vancouver. International Airport. The study concludes that much of the temporal variability in the occurrence of fog at Vancouver may be attributed to mesoscale influences such as land-sea breeze regime and to the larger scale synoptic weather regimes.. 1. Introduction Fog is not a major factor in the climatology of Vancouver. However, there are times when. it does have an impact on economic activity and affect the quality of the atmospheric environment.. In 1961 Belhouse presented a method for forecasting the occurrence of fog at Vancouver Internationl Airport and in 1970 Wright and Penny published a comprehensive climatology of fog in Vancouver, again based on data from the airport, Munn (1975) made mention of the secular change in fog frequencies which had been previously noted by Wright and Penny, and subsequently updated by Hay and Oke (1976). The relatively high frequency of fog occurrence in the early 1960's had a significant disrupting influences on airport operation in Vancouver to such an extent that a fog dispersal programme was implemented. However a subsequent reduction in natural fog frequency led to the abandonment of that programme.. (25).
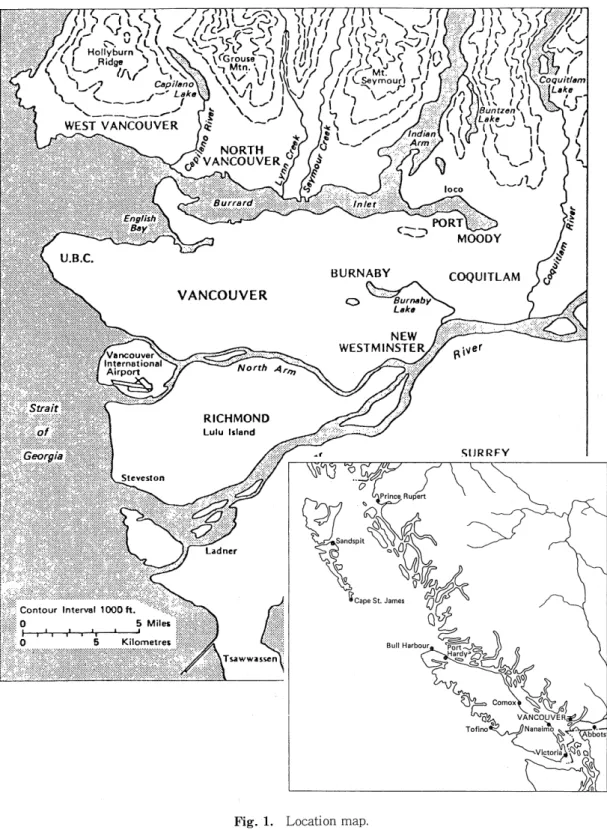
(3) Kazuo FUKAISHI. WSVi. WSK n) '<. <N //w^n. ^Lvfc,\ty^i yi>\. : Contour Interval 1000 h. ' "^. :. 0. 5. Miles. : 0 5 Kilometre* ;-^:::m<:^.?:mA.::S^.m::m:^. Fig. 1. Location map.. (26).
(4) A Climatological Analysis of the Fog at Vancouver, B. C. Canada. At least part of this reduction in fog frequency has been attributed to the expansion of the urban and industrial land uses in the vicinity of the airport, to the change in domestic and industrial fuels from wood and coal to oil and gas, and to the abolition of waste wood burners (or tepee burners and slash fires) in the Fraser delta area around the airport (Munn 1975). Howevever, similar reductions in fog frequency have been experienced in some areas of coastal southern. British Columbia removed from the urban and industrial influences. Moreover the winter of 1976-77, with its anomalous synoptic pattern, saw a marked increase in fog frequency to levels reminiscent of early 1960's.. This paper will attempt to show relationships between fog occurrence and synoptic weather regimes, to use such relationships to explain at least part of the observed secular changes in fog. frequency in the Pacific Coast of Canada and to describe the atmospheric conditions (particularly temperature and wind) which are associated with both fog occurrence and particular synoptic weather patterns.. 2 . Location of Study, Data and Definitions Vancouver International Airport, the observing site, is located on Sea Island, the smaller of. two islands in the mouth of the Fraser River (see Figure 1). The airport is surrounded by the open water of the Strait of Georgia to the west, Vancouver City to the north and the rolling farm lands of the Lower Fraser Valley to the east and south. Fog is defined as a cloud that envelops the observer on the ground and is sufficiently dense to reduce the horizontal visible range to 1,000m (0.62 mile) or less. AU data are based on the hourly observation file [Card One Format Documentation (Atmospheric Environment Service, 1964) for Vancouver Internatinal Airport (1953-1975) supplied by the Canadian Atmospheric Environment Service). Any fog that reduced the visibility to less than 5/8 miles (806m) at the time of observation is taken into account. A fog which only existed between observation hours. is not considered. A "full fog day" has 24 consecutive of hourly fog reports while a "fog day" is defined as any day on which at least one occurrence of fog was reported.. In this study, two basic types of fog are considered to occur in Vancouver. The first is "radiation fog" which occurs as a consequence of radiadve cooling of the air to the dew point. temperature or below and usually occurs before dawn with little or no wind and clear skies (Neiburger et al 1973). The second is a kind of "advection fog" which comes from the Strait of Georgia. According to Wright and Penny (1970), radiation fogs predominate in the Vancouver area and are associated with light easterly winds throughout the evening and night. The fogs tend to form a few hours after sunset on clear nights and dissipate shortly after sunrise. However, in more extreme cases where fog has formed for two or three nights in a row, it eventually becomes deep and widespread, covering all low areas and extending out over the waters of the. Strait of Georgia. Occasionally in such cases, partial clearing takes place over land during the afternoon, but as soon as the sea breeze begins to blow, the fog from the Strait is advected back over the airport. In this study such a fog is called "advection fog" for convenience.. (27).
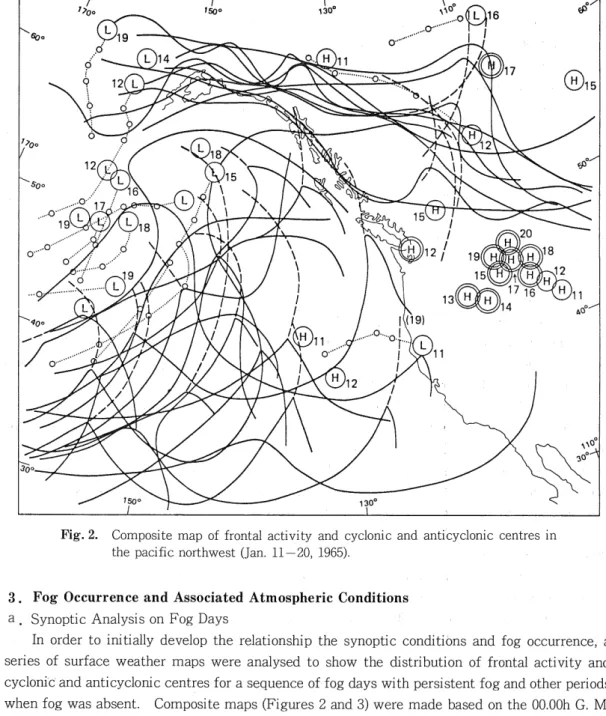
(5) Kazuo FUKAISHI. Fig. 2. Composite map of frontal activity and cyclonic and anticyclonic centres in the pacific northwest (Jan. 11-20, 1965).. 3. Fog Occurrence and Associated Atmospheric Conditions a . Synoptic Analysis on Fog Days In order to initially develop the relationship the synoptic conditions and fog occurrence, a series of surface weather maps were analysed to show the distribution of frontal activity and cyclonic and anti cyclonic centres for a sequence of fog days with persistent fog and other periods when fog was absent. Composite maps (Figures 2 and 3) were made based on the OO.OOh G. M. T. (IG.OOh P. S. T.) surface analysis performed by the Pacific Weather Office, Atomospheric Environmental Service, Vancouver International Airport. For the period November 21 to 30,. 1956, the weather was characterized by persistent fog, light winds and relatively cold temperature (Atmospheric Environmental Service). During that period an anticyclone persisted in the interior of the Pacific Northwest extending frontal activity from the area and concentrating it in the northeast Pacific Ocean.. Figure 2 is a composite surface synoptic weather map for the period January 11 to 20, 1965.. (28).
(6) A Climatological Analysis of the Fog at Vancouver, B. C. Canada. ^^\1. Fig. 3. As for Fig. 2, but for (Jan. 21-30, 1965).. In this case, the high pressure systems are centred further inland than was the case for the November, 1956 situation. This allowed frontal activity to reach into the Vancouver area on a number of occasions during the ten day period, bringing cloud, rain and stronger winds with the consequent absence of fog. However, as with the previous example, the synoptic situation was. conducive to the formation of persistent fog when f rental activity was absent. This regime may be contrasted with the ten days which followed (Figure 3). In that period January 21 to 30 1965, frontal activity was not excluded from the Pacific Northwest. The anticyclonic systems had moved southward and were no longer the dominant synoptic features. Rather a series of frontal. disturbances dominated the area with the result that conditions were far from favourable for the formation of fog. On only one day, January 29, was fog reported and then only for a short time in the morning. From these examples, it is concluded that there is no fog when atmospheric disturbances such as fronts or depressions are near or in the Vancouver area, on the other hand, there is fog when high pressures with fronts substantial distances away are predominant.. The foregoing results suggest that it is worthwhile exploring the synoptic weather pattern. (29).
(7) Kazuo FUKAISHI. TABLE 1 Observed frequency of fog days by synoptic type 'and expected frequency on the basis of climatology.*. Type. Observed. Expected. 1 2 3 4 6 11 12 15 16 22 24 25 26. 28 19 5 54 7 9 17 6 7 13 16 5 23 80 14 3 3 3 3 4 2 5 1 4 2 4 1 4 0 2. 24.5. Unclassified. Missing. 5 7 8 9 10 13 14 17 18 19 20 21 23 27 28. 29.9 13.7 27.1 6.1 5.6 8.9 9.6. 10.2 8.9. 11.2 8.5 9.8. 81.9 8.5. 10.5 5.1 5.5 4.9 6.9 5.2 4.0 3.8 4.6 9.9 4.5 3.8 4.0 3.5 3.5. *The first 15 groups were used in the Chi Square analysis.. - fog occurrence relationships over a long time period and in a more objective manner. Suckling. (1977) and Suckling and Hay (1976) have analysed the frequency of synoptic weather types for British Columbia and adjacent areas of the Pacific Ocean on a daily basis for the period 19631972. They used 1,000mb height for a 113 point grid with an average grid spacing of 381km and an objective correlation classification method pioneered by Lund (1963). For the ten year period 28 types (plus unclassified and missing) were recognized. Table 1 lists the types, their relative frequency over the ten year period and the observed frequency of fog days by synoptic types for the same period. Despite the low frequencies for some of the types, it is generally apparent that there are differences between the observed frequencies and those expected from climatology.. (30).
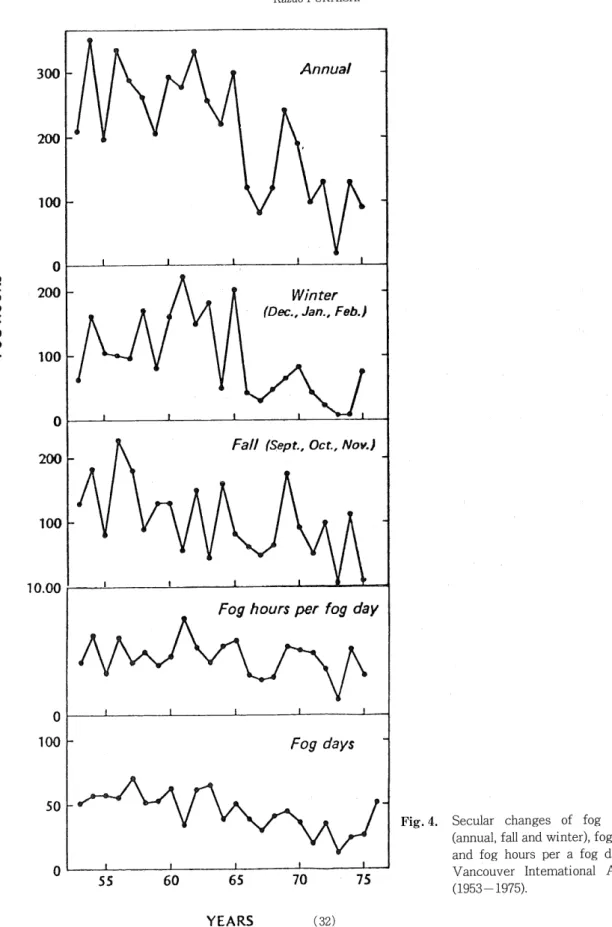
(8) A Climatological Analysis of the Fog at Vancouver, B. C. Canada. TABLE 2 Frequency of high and low pressure centres in a nine cell grid centred on Vancouver, B. C.. With Fog Climatology Number of High Pressure Centres 128 60 Number of Low Pressure Centres 61 128. This deduction was tested using the 15 types when both frequencies were greater than or equal to 5. A Chi Square value of 75.4 was calculated indicating a significant difference between the two frequencies at the 0.1 percent probability level. An analysis of the weather patterns which are associated with above average fog frequency indicates that all types are basically high pressure ridges along the western coastline or in the Pacific Northwest, generally producing clear skies and a light southerly air flow. By way of contrast the below-average frequencies are associated with. either well developed high pressure centres in the northern Pacific Ocean, giving northwesterly flow along the coast, or with well developed lows in the Pacific Ocean. In another analysis of the synoptic climatology of the British Columbia region, Hay (personal communication) has determined the frequency of high and low pressure centres in 72 grid squares covering an area similar to that used by Suckling (1977). Table 2 shows the observed frequency of highs and lows for fog days and for the ten year period 1965-1974 for nine grid centres on Vancouver. Again the difference in observed and expected frequencies was significant at the 0.1 percent level. It is apparent that when an anticyclone dominates the Vancouver area, there is a greater likelihood of. fog while the opposite is true for cyclonic regimes. The changed frequency of the synoptic types and pressure centres will be used in section 3.b in an attempt to rationalize the changes in fog frequency over the decade of concurrent observations.. b . Secular Changes in the Frequency of Fog Days and Fog Hours As mentioned in the introduction to this paper, an interesting aspect of the fog climatology of Vancouver is that the annual frequency of fog days underwent a comparatively steady decline from the early 1960's, though the winter of 1976-1977 had frequencies more characteristic of the 1950's. Figure 4 shows the number of fog hours for the fall, winter and annual periods at Vancouver International Airport from 1953 to 1976. The annual number of fog days and the number of fog hours per a fog day are also included. Although there is a considerable interannual variability, the previously mentioned trend towards decreasing fog frequency is readily apparent, but is perhaps best developed in the data for the winter season. There is clearly only a weak relationship between the annual number of fog days and fog hours. This is a consequence of a change in the persistency of fog.. The annual number of fog days for selected locations in British Columbia (see Figure 1) are given in Figure 5. While some stations (eg. Nanaimo, Comox, Victoria) exhibit a secular change similar to that experienced in Vancouver, other locations (eg. Tofino) have a somewhat dissimilar change of fog frequency over time. Table 3 gives the correlation in the annual values of fog frequency between Vancouver and each of the ten other stations. A strong positive correlation. (31).
(9) Kazuo FUKAISHI. 300. Annual. 200. 100 I. \r>. oi. 3. Q. 0| 200. Winter. X. ^ 0. (Dec., Jan., Feb.}. 100. 0 Fall (Sept.. Oct., Nov.). 200. 1001-. 10.00. Fog hours per fog day. 0 100. Fog days. 50 Fig. 4. Secular changes of fog hours (annual, fall and winter), fog days and fog hours per a fog day at. 55. 60. 65. YEARS. 70. 75 (32). Vancouver International Aiport. (1953-1975)..
(10) A Climatological Analysis of the Fog at Vancouver, B. C. Canada. 140 120. Cape St. James. 100 80. 601 401. Prince Rupert. 40. 20] Sandspit. 601. d. <. Q. 40] 20|. g Port Hardy IL 601. 401 201 Comox. 40] 201 Abbotsford. i 20. 601. Vancouver. 40] 20] 75. Fig. 5. Secular changes of annual fog days for selected locations in british Columbia, Canada (1956—. 1975).. (33).
(11) Kazuo FUKAISHI. TABLE 3 Correlations of annual number of fog days for given stations and Vancouver. (1956-1976).. Station. No of Observations. r2. r 0.67. Comox. 21. 0.45. Victoria. 21. 0.63. 0.79. Tofino. 18. -0.04. -0.20. Abbotsfords. 21. 0.28. 0.53. Nanaimo. 21. 0.21. 0.46. Cape St James. 21. 0.12. 0.35. Prince Rupert. 21. 0.05. 0.22. Port Hardy. 21. 0,36. 0.60. Sandspit. 21. 0.49. 0.70. 21. 0.00. 0.00. Bull Harbour. is experienced with adjacent stations, particularly those having in common a proximity to the water bodies of the Strait of Georgia and Juan de Fuca. This suggests that factors causing the main interannual variations in fog frequency are common to all these locations. Changes in synoptic weather patterns have been shown to have a strong bearing on the day to occurrence of fog.. It is likely that these same factors have an influence on the interannual variability of fog frequency. However it is interesting to note that a stronger correlation exists between annual fog frequencies between Vancouver and Victoria than for Nanaimo, which is much closer. Victoria and Vancouver have a more common exposure to fogs moving through the Strait of Juan de. Fuca in contrast to the sheltered location of Nanaimo, and this may be an explanation for the different correlations. Another possible explanation is that urban and industrial influences have had comparable effects on fog frequencies in Victoria and Vancouver with lesser influence on Nanaimo. At this time, it is not possible to develop these hypothesis any further. c . Frequencies of Fog Occurrence, Formation and Dissipation Figure 6 shows the percentage frequency by hour and month of fog occurrence at Vancouver International Airport. It is evident from the data presented that there are occasional fog occurrences in the early morning in late summer and then there is a gradual increase in fog frequency. until October which is the month of highest fog frequency. In the winter months, fog may persist throughout the daylight hours although its early morning frequency decreases. The close relationship between the maximum occurrence of fog and the time of sunrise is also illustrated in Figure 6. In Section 3.a, it is shown that certain synoptic weather types were more commonly associ-. ated with fog. Table 4 shows the monthly frequency for ten years (September to February) of synoptic weather types (Suckling 1977) which are shown in Table 1 to have greater than expected frequency of fog. Many of these synoptic regimes are clearly more common in the fall. (34).
(12) A Climatological Analysis of the Fog at Vancouver, B. C. Canada. TIME (h) 9 12 15 Jan.. 18. 7. 5.3 5,5 6.0^5.9\6.2 \5.8 / 6.0 6.5 \7.6 ,6.2. 21. .3.5 3.9 3.8 3.7 ^3.0'"~2.8—3.0—3.0^ 3.7 '4.2. Feb.. 5 0.8 0.6 0.9 \ 1.1 1.8 1.2"\2.5 2.9. Mar.. 0 0 0\ 0.3 0.3 0.3 0.1 0.3 0.1 ^. Apr.. 0.1 0.1 0.4^0.7 0.6 0.6 Q.6 /0.\. 000000000000000. May. 0 0 0 0 \ 0.1 0.4 0.3 0.1. 000000000000^000. June. 00000000000000000000000. July. 0 0 0/0.3 ,.0.6 0.7 ^0.4 0,1\000000000000d00. Aug.. 0.1 0.3^/07 0.8^1.8^3,0^1.4 0.6\0.1\ 00000000000000 \:Y'~ '" ~ ~" """ "&. \.. / • _\ •s. Sept.l. 0.9\J3.1\ 0 0 0 0 0 ,0.1 0.1 0.1 0.4 0.3-^-1'2 1.S. Oct.. 6.0CS3.8^2.2~^.7 1.3 1.5 1.4 1.8/2.2 2.4 3.0— 3.1^4.3-T,. Nov. |-. 6.5 6.6^\8.1 8.4\9.1y^7.7 7.8\\1Q. 179,4 ;| 6.2 ^5.1 \3.6 '2,2 2.3 '1.9' 2.8 2.8 2.8 ,3.3 3.2 (4.6 5.2 5.0. Dec.\-. 6.3 6.7 6.7 /5.9\ 6.5 6.5\7.6 7.7\8.3 7.4 \ 5,9 \4.\ 3.2 \2.7 2.7 2.4 2.5 2.4 2.7 2.8 2.8 14.4 f5.3. <wnsef>. ® <su/7/7se>. Fig. 6. The percentage frequency by hour and month of fog occurrence at Vancouver International Airport (1953-1975, 0.1%).. TABLE 4 Number of observed high pressure centres and frequency of fog days at Vancouver, 1965—1973.. 1965 1966 1967 1968 1969 1970 1971 1972 1973 Highs 21 12 12 20 18 19 12 13 1 Fog Days 51 39 30 41 45 37 20 36 14. (35).
(13) Kazuo FUKAISHI. TIME (h) 0 1 2 3 4 5 6 Sept. 1 2 3 4 5 6 Oct. 1 2 3 4 5 6 Nov. 1 2 3 4 5 6 Dec. 1 2 3 4 5. Aug.. 6. 1 2 3 4 5 6 Feb. 1 2 3 4 5 6 Mar. 1 2. Jan.. 3. 4 5 6. 1 1 1 2^. 1 1 1. 3. r 2 2 1. ^ 1. 2,. _5.. 1, "3. ~3. 2'. 3. 2'. 2 2 1. ,5. 4~. 2 1 2. 2. T. 1 2 2. 1. 3. 1 2 1 1 2. C3. 3. 1. 5 4. 3. T .3-. '2—-4.—3'. 3. '6. ^ .^ 3 ^ T I. 2. 1. -4'. b 4. J -3-. 1 1 1 2. 1. 1 1 2. 2 1 1 1. <3. 1. 4.. 1 1. 1. 4 3 1 1. '4. 2 2. 2 2. 4 1 I. 2 2. 2 1. 2. 3«I 4. ^ <5;. ^. T ^ T. ^)j L. 2. T. I 1 1. 3. 9. 1. 2. 1. 2 2. 2 2 1. 2". 1•. 1. 1 2 2. 1. 3J<>. 2. )1. 19. a. • •ll. '2. 1. 2 2 1. •1 91 •1. •I. 4. I. 2. 1. I. ^$N .4-. .Q. 1. -3-. 3:. 2. N2. 4. 1 "4. 1. 2. JT\ fd%; 1^»^>? 1. 2.. -2-. •1 •3 3« 3« 3». © ^ ^. 1 1 1 2. 9. 6. 3. 2« 1c. 2, i« 2. !•. \ (2) 76> [5,. ^ 1. 1. 1. 1 2. 1. 1 2 1 1. 1 2 2. 2 1. 1. 1 1 1 1 1 1. 1. c?. 1 1 1. 1 1. 1 1. 1. 2 1. 2 1. -t. 2. 1. 1. 2. 1. 1. 2. 1. 1 1 1. 1. 1. 1. 1. 1.
(14) A Climatological Analsis of the Fog at Vancouver, B. C. Canada. TIME (h) 0 1 2 3 4 5 6 Sept. 1 2 3 4 5 6 Oct. 1 2 3 4 5. Aug.. Nov,. Jan.. 1. I 2. ^3,. 5. 6 1 2 3 4 5 6 1 2 3 4 5 6. [3. ) I 1. 1 2. 1 1 2. 1. 2 2. 1 2 3 4 5 6 Mar. 1 2 3 4 5 6 Feb.. I. 2. 1. 3 4 Dec.. e. ^. 6. 6. 3. ;2 1. I. 1 2 1. 2 1. I 1. 1 1. 1. r4. 2. x. 1. 1. 1. I. ^ •. Ie. 1. 2 2. 2. 3 3 1 '3 '1. ~2. 1 2 I 1 1. ~3~. L3.. 1 2 ) 1. '3. 1. 2 2 1 2 1. 2 2. 3l. '1. ^ I. 1 1 1. <? ) 1 2 1. 1 1. 1. I I 1 1 1 2 1 1. 2 1. ® 'r. •. ^. e? a2. '4. 4. ^. 2 1. 2. 1 I I 2 1. 3. 1 1 1. ®I. 2. 8. I.2. \^\. « ^ 6 1 el el. 1 2. i C^. ^. 2 1. 4. 2. Ie 2 2. • (T. 1 1 1 2. ai r el 1. ®1 1.. al C^. s 1 )3-. 2. 3^. 2 2 1. 8. I®. 4. ^. e I i. Ie. 1. 1 1. ^^ 0 2 1 5'. 4 .3". I 2. ,2. 4 r3. 13 4 '2". 1 2 2 _1. ''^>. (D.•';^ -fj. 2. 1 2 1. 3'. 2 2 2 I 2. <53^. 2 1 2. 0. 4 4. -5<. 2a I6. 3. 8. j^ 0. B ,11. e. 4~. 4;. "I. ':3- 4. ^^ 4. '4. «2~. 1 1 1. ^-^. 2'. 1. I 1 I. 6 \3>. .8 ^. L5>. .2. .1. ~6^^1. ^ (6. 6 2e 2,. 1 2 I 2. 'f^T^P. "5. 4,. 2 I 2. 1. 2 2. 2 • 1. '3. 1. 1. 4 3 3. .2. 2. •3-. I. 1. 1. 9. I. 2 2 1.
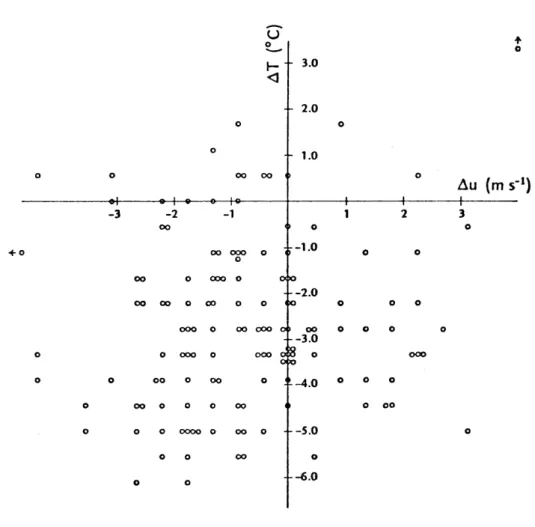
(15) Kazuo FUKAISHI. (J. ^. 0. 0. 3.0. t-. 0. 2.0 0. 0 0. 1.0. 0. 0. 00. -3. -2. 0. 00. 0. -<-0. 0. 00 00. 0. 00. 0. 0. 0. 000 0. 000. 0. 0. 00. 000. 0. 000. 0. 0 00. 00. 0. 0. 00. 0. 00. 0. 0. 0. 0 0. 0000 0. 0. 3. 0. 0. 0. 0 0 0 CX30 0. -2.0 0 00 -3.0. 0 0. 0 0. 0. 0. 3 o. 0. 00. -1.0. 0. 0. -4.0. 0 000. 000 0 0 0. 00. 0. 0. 00. 2. 1. -1. 00. Au (m s'. 0. 0. 0. 0. 00. -5.0. 0. 0. 00. -6.0. 0. Fig. 9. The changes in temperature and wind speed between the 5 hours preceding the occurrence or fog and the hour of fog formation.. d . Temperature and Wind Conditions Associated with fog Figure 6 shows that on a monthly basis, October has the highest frequency of fog occurrence. The 137 foggy days, which are defined as one during which two or more consecutive hourly observation of fog occurred, were selected from among fog days in October for 23 years(1953-. 1975). An intensive study of the temperature and wind conditions was attempted to show the atmospheric conditions associated with fog occurrence and to show the relative roles of radiative cooling and warming and of advection.. Figure 9 shows the changes in temperature and wind speed which took place in the five hours preceding the occurrence of fog. It is apparent that most of the fogs were preceded by a cooling of up to 2-5°C. A tendency toward lighter wind speed is less well developed which is not surprising since there must be air movement with an advective fog and Petterssen (1956) and George (1960) both argue that a light wind favours radiation fog because the radiatively cooled air near to the ground surface is more effectively transported to the higher levels, thereby increasing. (38).
(16) A Climatological Analysis of the Fog at Vancouver, .B. C. Canada. 5 hours. 2 hours. 4 hours. 1 hour. 3 hours. hour of fog formation. Frequency 5 10 . 5. Calm ^—. a <u a. Wind ^ E £ E" force .'o)n •a r*. HE. B) Q.. JD. "r -S7 J. £ 00. a>'". 0. Fig. 10. The change in wind regime in 5 hours prior to fog formation.. the depth of the cooled layer. The change in wind regime in five hours prior to fog formation is illustrated in Figure 10. At the start of the five hours period,the winds are predominantly light and from the west,through there are a significant number of calms and to a lesser extent, easterly winds. In the following. four hours, the winds gradually weaken with an increasing incidence of calms and easterly winds with a consequent reduction in the frequency of westerly winds. Such a change of wind condition means that initially, moisture air is advected from the Strait of Georgia and is subsequently radiative cooled to produce a fog associated with the weaker wind. This kind of wind system is considered to be a land-sea breeze regime previously mentioned in this district (Hay and Oke 1976, Emslie 1968). It is pointed out that a land-sea breeze is closely associated with the generation of. (39).
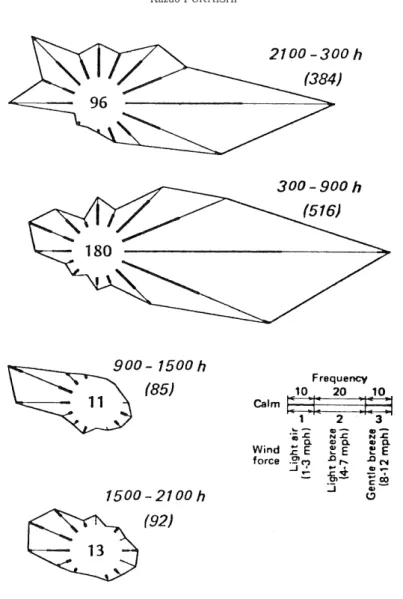
(17) Kazuo FUKAISHI. 2100-300h. (384). 300 - 900 h. (516). 900-1500 h. (85). Frequency Calm. JO.. 1. 'H. Wind ^ E. 20 2. it » ~-. ?-?. 32 IS. force "n -Q r^. 1500-2100h. 10 S-£. ® 0.. £E. -°CN B> T-. cS 0). u. (92). Fig. 11. The wind condition during fog.. fog (Byers 1974, Petterssen 1956, Fukaishi 1973). It is instructive to analyse the wind conditions during fog in October on an hourly basis in order to illustrate the distinctive diurnal regime which prevails. In the data presented here the 24 hours have been grouped into four periods-night (21h.-3h.), morning (3h.-9h.), day (9h.-15h.) and. evening (15h.-21h.). The data are presented as Figure 11. At night relatively weak winds from the easterly quarter prevail. In addition for 25 percent of the occurrences, no wind was reported.. In the morning the same general pattern prevails but there are a noteworthy number of light winds from the sea. Figure 10 shows that in order for fog to occur during the day in October, the winds must usually be from the westerly quarter. This direction and the associated velocities generally between 2m/see and 6m/see, imply that in order for the fog to persist during the day, it must have advective origines in the Strait of Georgia. However, the wind speed in this case is lower than that of advection fogs in other regions (Petterssen 1956, Fukaishi 1974). The wind. (40).
(18) A Climatological Analysis of the Fog at Vancouver, B. C. Canada. x. 10. 5. fog no fog. 0. 000^ 0'. <° 0 ^. 0 0'. 0. 0. 12. 18. 15. 24/0. 21. 12. TIME (h) Fig. 12. Temperature deviation from the 6h temperature for fog days in October, 1974.. u. +5.0 00 0. 4.0. 0 0 0. +3.0. 00 000 0 0 0400 00 0 0. 000. 00 '2.0. 0 000 00. 0 00. 000 <>0 000. t 1.0. °f8. 000. -3. •e®—e®—^. -2. -1. 0. A. 0 0. 00 000 0 00. Au (ms-1). •®+~®—®—t. GO © 030 ©$©. 0.5. Fig.13. The changes in temperature and wind speed between the final fog hours and the fog dissipation.. (41).
(19) Kazuo FUKAISHI. conditions in the evening show both a combination of the daytime fog regime (i. e. westerly winds or sea breeze) and the beginning of the night regime of radiation fogs forming under light easterly winds or land breeze.. Figure 12 illustrates the diurnal temperature variation, plotted as deviations from the 6h. temperature for that day, for fog days in October 1974. The presence of fog at any given hour is noted in the diagram. Also plotted is the mean temperature by hour for all days in the month. The figure shows that the fog days all had a greater rate of cooling, nearly equal to 0.6°C per hour, than occurred on an average for the month. Oke and Maxwell (1975) quote cooling rates as large as 3°C per hour on calm clear nights for a rural area near Vancouver. The lower cooling rates. found in the present study may be at least partly attributed to the presence of large water body and airport land uses in the vicinity of the observation site. Finally in this section, the changes in temperature and wind speed at the time of fog dissipation will be discussed. Figure 13 confirms that fog dispersal is associated with an increase in temperature as large as 5.6°C from the time when a final fog is reported and an hour later when. fog is absent. Since fog dissipation usually takes place during the daylight hours, this temperature reflects the increase in solar radiation available for sensible heating once the reflecting fog layer has been removed. Thus at least, part of the temperature increase is a consequence rather. than a cause of fog dissipation. 4. Summary. The results obtained in this paper are summarized as follows : 1. Compilation of daily synoptic weather maps on foggy days and an analysis of weather patterns which are associated with fog, showed that a high pressure ridge along the western coastline or in the Pacific Northwest, with resulting clear skies and a light southerly gradient wind, was the synoptic weather pattern with which fogs at Vancouver are most commonly associated. 2 . From the beginning of the early 1960's, annual fog days and hours have decreased except for. the winter 1976-77. The same trend can be seen in Victoria, Nanaimo and Comox. Synoptic weather patterns. play a large role in determining the frequency of fog at Vancouver and are likely to dominate the effects of urban and industrial activities that previous workers have suggested as the source of observed secular changes in fog frequency.. 3 . The fall months have the highest frequency of fog which is also associated with the time of frequent occurrence of ridge type synoptic weather patterns. Such fogs generally have the temporal characteristics of radiation fog with maximum frequency near dawn. On the other. hand, fogs in the winter tend to be more persistent and rely on the slower rate of fog dissipation over the Strait of Georgia. However, in general, the frequencies of fog dissipation and formation are closely related with the time of sunrise, and to a lesser extent on a seasonal basis with variations in the synoptic weather situation.. 4 . In October the formation of fog is associated with only a gradual cooling of the air. Substantial warming generally accompanies fog dissipation, but there is no evidence of the. (42).
(20) A Climatological Analysis of the Fog at Vancouver, B. C. Canada. relative extents of cause and consequence in this change.. 5 . From this viewpoint of temperature and wind regime, it is concluded that initially, moist and warm air advected from the Strait of Georgia as a sea breeze and is subsequently fog occurs. as a consequence of the effects of weak radiative cooling in the light wind condition (i. e. land breeze).. Acknowledgement The author wishes to thank Dr. John E. Hay for his encouragement and guidance at all stages. of this study. He wishes also to thank Dr. Timothy R. Oke and Mr. John Knox for their useful advice. The study was greatly aided by the Department of Geography, University of British Columbia where the author studied for one year (1976/77) as a research associate. The author would like to thank Miss. R. Dobrowics for typing the manuscript and Mr. P. Jance for drawing the figures.. References. Belhouse, H. C. (1961) An Empirical Method of Forecasting Radiation Fog at Vancouver, British Columbia. Bul. of Amer. Meteor. Soci,42 (3) 349-368 pp.. Byers, H. R. (1974) Fog (in General Climatology Chapter 11) McGraw Hill, 277-279 pp. Canada Atmospheric Environmental Service (1956, 1965) Monthly Meteorological Summary at Vancouver International Airport.. Court, A. (1966) Fog Frequency in the United States, Geogr. Rev. 56 (4) 543-550 pp. Deacon, E. L. (1969) Fog (in General Climatology editated by Flohn, H., Chapter 2 Physical process near the surface of the earth) Elsevier Holland 89—94 pp. Department of Transport Meteorological Division (1948) Meteorological Conditions at Selected Airport in Canada Newfoundland and Labrador Toronto.. Emslie, J. H. (1956) An Investigation of the fog situation at Comox, British Columbia, November 22—30 1956 C. I. R. 2998 TEC 262. Emslie, J. H. (1968) Wind flow in Burrard Inlet, Vancouver, B. C. A Summary of six years of Data. Department. of Transport Mfiteorological Branch TEC 686. Fukaishi, K. (1973) On Summer Fogs in Kushiro Hokkaido, Japan. Geogr. Rev. Jap. (11) 741—754 pp. (in Japanese with English abstract). Fukaishi, K. (1974) Distribution of Summer Wind in the Kushiro District, Hokkaido, Japan. Geogr. Rev. Jap. 47 (12) 733-747 (in Japanese with English Abstract). George, J. J. (1951) "Fog" in Compendium of Meteorology Amer. Meteor. Soci. 1179—1189 pp. Hay, J. E. and T. R. Oke (1976) The Climate of Vancouver, Tantalus Research Limited Vancouver, Canada 1— 48pp. Lund, I. A. (1963) MEap-pattern Classification by statistical methods. J. Appl. Meteor. 2. 56—65 pp.. Munn, R. E. (1975) Secular Increase in Summer Haziness in the Atlantic Provinces. Atmosphere 11 (4) 156—161 pp.. Neiburger, M. et al (1971) Condensation (in Understanding Our Atmospheric Environment, chapter 8) Freeman, 135-139 pp. Oke, T. R. and G. B. Maxwell (1975) Urban heat island dynamics in Montreal and Vancouver, Atmos. Environ. 9.191-200 pp.. (43).
(21) Kazuo FUKAISHI. Patton, C. P. (1957) Climatology of Summer Fogs in the San Francisco Bay Area. Univ. of Calif. Publications in Geography vol. 10. Petterssen, S. (1956) Weather Analysis and Forecasting vol. II McGraw-Hill 103—132 pp.. Suckling, P. W. and J. E. Hay (1976) Synoptic Weather Types for British Columbia and the Adjacent Pacific Ocean Region (in manuscript).. Suckling, P. W. (1977) A Solar Radiation Model and an Analysis of Synoptic Solar Radiation Regimes in British Columbia. Unpublished Ph. D. Thesis, Dept. of Geography,. Univ. of British Columbia, Vancouver, 1-271 pp.. Wright, J. B. (1971) Fog Occurrence at Prince George Airport, British Columbia, Technical Memoranda TEC 751.. Wright, J. B. and N. E. Penny (1970) The Incidence of fog at Vancouver International Airport, Technical Memoranda TEC 748.. (44).
(22)
図

+7


関連したドキュメント
The approach based on the strangeness index includes un- determined solution components but requires a number of constant rank conditions, whereas the approach based on
We classify the rotary hypermaps (sometimes called regular hyper- maps) on an orientable surface of genus 21. There are 43 of them, of which 10 are maps (classified by Threlfall),
pole placement, condition number, perturbation theory, Jordan form, explicit formulas, Cauchy matrix, Vandermonde matrix, stabilization, feedback gain, distance to
⑹外国の⼤学その他の外国の学校(その教育研究活動等の総合的な状況について、当該外国の政府又は関
Applications of msets in Logic Programming languages is found to over- come “computational inefficiency” inherent in otherwise situation, especially in solving a sweep of
In this paper, we continue this line of study, considering certain uniform estimates that are motivated by an analysis of a bilinear Hilbert transform along polynomial curves..
Shi, “The essential norm of a composition operator on the Bloch space in polydiscs,” Chinese Journal of Contemporary Mathematics, vol. Chen, “Weighted composition operators from Fp,
This paper presents an investigation into the mechanics of this specific problem and develops an analytical approach that accounts for the effects of geometrical and material data on
