Rail Deterioration Detection Method using Image Spectral Analysis
6
0
0
全文
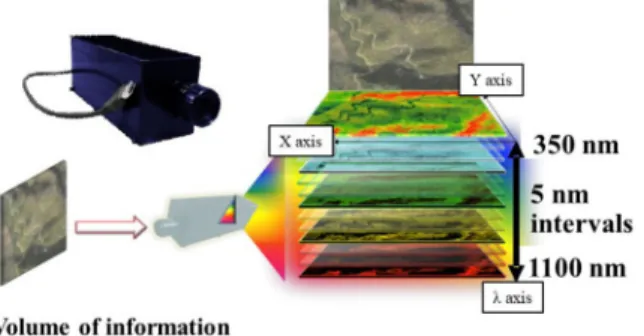
(2) hyperspectral camera. Figure 1 shows that in a hyperspectral image, 200 million pixels can be obtained by splitting wavelengths from 350 nm (near ultraviolet) to 1100 nm (near infrared) into 151 wavelength bands at 5 nm intervals with a 1.31 million pixel camera.. the rail, the irradiation direction of the halogen light, and the presence or absence of light diffusion, and confirmed the effect on the spectrum of the captured image. Figure 3 shows the conditions of the laboratory test, and Table 2 shows the imaging conditions.. 3. Image spectrum analysis method and image. 3. Image spectrum analysis method and image capcapture method ture method. Hyperspectral Table 1camera Main. Fig. 2 Test rail. Hyperspectral. specificationscamera of the camera. Item. Specification. Shooting speed. 1280 × 1024 pixel (131.1 million pixels) 7.7 seconds as standard. Data transfer rate. 133 fps. Measurement wavelength. 350 nm ~ 1100 nm. Light diffusion box Resolution. 第3図 Rail Wavelength interval. 5 nm. Hyperspectral camera Halogen light Light diffusion Fig.box 3. Rail. Hyperspectral camera Halogen light. State of laboratory test. in Fig. 2 [1]. We also set eight imaging conditions that differed Railcamera and in the relative positional relationship between the 第3図 Rail. Halogen light. Fig. 3. Halogen light. State of laboratory test. Fig. 3 State of laboratory test. in Fig. 2 [1]. We also set eight imaging conditions that differed in the relative positional relationship between the camera and. QR of RTRI, Vol. 62, No. 2, May 2021. Light direction. Condition No. ○. Long. ①. Diagonal(45°). × ×. Positional relationship between camera and rail Light direction Long : Rail longitudinal direction Vertically upward(90°). Short Diagonal(45°) : From the camera side. Diffuse. Short(From the other side of the camera) Short(From both sides of the rail) Light direction. ⑦ ⑧ Condition No. Long. ○: Rail perpendicular Short Short ○ direction. ① ② ③ ④ ⑤. × × ×. Long Short Long Short(From the camera × ⑥ side) Short : From the Short(From other Short: From both sides the other × of the camera side of the rail ⑦ side of the camera) Short(From both sides × ⑧ of the rail). Light direction Long : Rail longitudinal direction. Short : Rail perpendicular direction. 3.2 Examination of image analysis method. 3.2 Examination of image analysis method. We photographed the test rail We photographed the test rail Field Gauge under imaging condition ① corner corner Short : ① Fromindithe other Short: From both sides Short : From thecondition under imaging indicated in camera Table itscamera side of the of the rail side 2 to obtain cated in Table 2 to obtain its hyhyperspectral image, shown in Fig. perspectral image, shown in Fig. 4. 4. Then we selected 5 spots shown in Then we selected 5 spots shown in Fig. 4 as areas to analyze: spot① Fig. 4 as areas to analyze: spot① (rust), ①②③④ ⑤ (rust), spot②(white spot②(white etching etchinglayer), layer), spot③(the boundary between spot② spot③(the boundary between spot 3.2 Examination of image analysis method andand ④ ④ where ② where the the presence presenceoror absence of the white etching layer is absence of the white etching layer We photographed the test rail Fig. area is not clear) , spot④(No white not clear) , spot④(No white etching Field4 Analysis Gauge under imaging condition ①. corner4 Analysis cornerarea etching layer ( ≈ rail steel)), and Fig. indicated in Table 2 to obtain its spot⑤(Rail bottom). Figure 5 Difference in spectral hyperspectral image, shown in Fig. shape between the twofrom 350 Rust shows a spectral graph of the wavelength band 4. Then we selected 5 spots shown wavelength bands White etching layer in nm to 1100 nm for each analysis area. The vertical axis of Boundary between ② and ④ Fig. 4 as areas to analyze: spot① Fig. 5 is the spectral No intensity the reflectance of white etching representing layer (rust),from spot②(white etching layer), Rail bottom ①②③④ light the material. Since the magnitude of the ⑤ spectral spot③(thechanges boundary between spot② intensity depending on the angle of the light source and the ④ brightness where the presence or and of the surroundings, the difference in the absence of the white etching appears layer is as the difference in the properties of the material Analysis area shape of the graph each etching analysis Fig. area.4The spectral data not clear) , spot④(No 505 inwhite 635. Spectral intensity. image, 200 million pixels can be obtained by splitting Weexamined examined the for analyzing images takentaken by a We themethod method analyzing images wavelengths from 350 nm (near for ultraviolet) to 1100 nm (near hyperspectral cameracamera for rails. In railIninspections, although by a hyperspectral for rails. rail inspections, infrared) into 151 wavelength bands at 5 nm intervals withala damage damage inside the rail such thesuch lengthasofthe transverse though theasrail length cracking of trans1.31 million pixelinside camera. is quantitatively by a rail flaw detect orflaw a flaw verse cracking ismeasured quantitatively measured by acar rail dedetector, deterioration of the rail surface is determined visually. tect car or a flaw detector, deterioration of the rail surface 3. Table Image spectrum method and image 1 shows the mainanalysis specifications of the hyperspectral is determined visually. capture method camera used in this the test.main Givenspecifications the vast amount of information Table 1 shows of the hyperspecacquired by hyperspectral the standard time required tral camera used in this camera, test. Given the vast amount of to in3.1 Outline of laboratory testcan be capture oneacquired image with camera long asthe 7.7 standard seconds. formation by this hyperspectral camera, As for the light used the test, no prior time required to source capture oneinimage withthere thisare camera can examples of shooting a rail with a hyperspectral camera, We examined the method for analyzing images taken a be long as 7.7 seconds. As for the light source used inbythe therefore, spectral distribution of rail the hyperspectral camera forexamples rails. In inspections, although test, therethe are no prior of shooting a rail with a reflected light from thesuch rail is damage inside the rail asunknown. the length transverse cracking hyperspectral camera, therefore, the of spectral distribution Therefore, we used a halogen light that is quantitatively measured by a rail flaw detect car or a flaw of the reflected light from the rail is unknown. Therefore, includes the entire wavelength band that detector, deterioration of the rail surface is determined visually. we used a halogen light that includes the entire wavecan beTable acquired bycan this camera. 1 that shows thebe main specifications the hyperspectral length band acquired by thisof camera. First, in in order basic camera used thistotest. Giventhe thethe vastbasic amount of information First, in order toexamine examine analysis method analysis method after grasping the acquired by hyperspectral camera, the standard time required to after grasping the spectrum of the reflected light from spectrum of the reflected light from the capture one image with this camera can be long as 7.7 seconds. the rail, we photographed the normal railWhite as a test rail, rail, we photographed the used normal astest, there As which for thea light source in rail thewas are no prior etching on white etching layer aexamples test rail, on a white layer of shooting a etching rail with a in hyperspectral camera, layer confirmed onwhich its surface, as shown was confirmed on its surface, as shown therefore, the spectral distribution of the Fig. 2 [1]. We also set eight imaging reflected light the railinisthe unknown. conditions thatfrom differed relative Fig. 2 Test rail Therefore, we used a halogen light that positional relationship between the includes and the entire wavelength band that camera the rail, the irradiation Item Specification can be acquired this camera. direction of the by halogen light,1280 and the pixel × 1024 First,Resolution order to examine the basic presence orinabsence of light diffusion, (131.1 million pixels) analysis method after grasping specthe and confirmed Shooting the speedeffect on the 7.7 seconds as standard spectrum of the reflected light from the White trum of the image. 133 Figure Datacaptured transfer ratethe fps as 3 rail, wethe photographed normal rail etching shows conditions of the laboratory wavelength 350 nm ~ 1100 nm a testand rail,Measurement on which white etching layer layer test, Table 2 ashows the imaging Wavelength interval was confirmed on its surface, as5 nm shown Fig. 2 Test rail conditions.. Diffuse. the rail, the irradiation direction of theShort halogen light, and the ○ ② upward(90°) or absence of light diffusion, and the effect presenceVertically × Longconfirmed③ × ShortFigure 3 shows ④ on the spectrum of the captured image. the × Long conditions of the laboratory test, and Table 2 shows the⑤imaging Short(From the camera × ⑥ conditions. side). 950. 1050. Difference in spectral. Fig. 5. Spectral intensity. 3.1 Outline of of laboratory test 3.1 Outline laboratory hyperspectral camera. Figure test 1 shows that in a hyperspectral. Table 2 Imaging condition Positional relationship between camera and rail. shape between the two Rust Wavelength (nm) wavelength bands White etching layer Boundary between ② and ④ No white etching layer Rail bottom. Spectral graph of each analysis area on the test rail. 505. 635. 950. 1050. Wavelength (nm). Fig. 5 Spectral graph of each analysis area on the test rail. Fig. 5 Spectral graph of each analysis area on the test rail. 125.
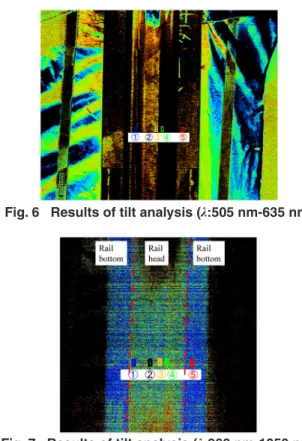
(3) obtained by photographing with a hyperspectral camera is a combination of the spectral distribution of the reflectance of the material and the spectral distribution of the light source. Therefore, a white plate is photographed as a material to obtain the spectral distribution of the light source under the test conditions, and the spectral intensity of the object is obtained by (1). Spectral intensity �. Spectral data of material � 400 White plate spectrum. (1). where the coefficient of 4000 is the default value to be multiplied when calculating the spectral intensity with the software used for the processing of this camera. From Fig. 5, we found that there is a difference in the shape of the spectrum of each analysis area between the wavelengths of 505 nm to 635 nm and 950 nm to 1050 nm. Therefore, we focused on this band to examine an analysis method for grasping the white etching layer.. Fig. 6 Results of tilt analysis (λ:505 nm-635 nm). 3.2.1 Tilt analysis Tilt analysis, which is also called normalized spectroscopic reflection index analysis (NDSI analysis), is an analysis method that color-codes images based on the magnitude of the difference between spectral absorption and reflection. Tilt analysis is expressed by (2). NDSI, which is defined to reduce the influence of the error factor in the spectral waveform, is the value obtained by dividing the difference between the spectral intensities of the two selected wavelengths (λ1, λ2) by their sum. NDSI �. I �1 � I � 2 I �1 � I � 2. (2). where Iλ indicates the reflectance at the wavelength of λ nm. Figure 6 shows the results of setting the color-coded thresholds based on the difference in NDSI values. Fig. 6 shows that the two wavelengths from the tilt analysis are 505 nm and 635 nm and the presence or absence of the white etching layer is clearly distinguished between spot ② and ④. The parts with the white etching layer on the rail surface are color-coded in yellow, and the parts without the white etching layer are color-coded in black. However, since the spectral shapes of the analysis area with the white etching layer and the analysis area at the bottom of the rail look similar, it is determined that there is a white etching layer in a part of the bottom of the rail. The boundary of spot③ was identified in the same way as the part with the white etching layer spot②. Figure 7 shows the results of the tilt analysis with two wavelengths of 950 nm and 1050 nm. In the figure, it is difficult to distinguish the presence or absence of the white etching layer. The reason for this result is that in the spectral graph of Fig. 5, there is no significant difference in the spectral shapes of spot② and ④ between the wavelengths set by tilt analysis. However, since the spectral shapes of the analysis area with the white etching layer and the analysis area of the rail bottom are different in the wavelength bands of 950 nm and 1050 nm, the rail head and rail bottom are clearly color-coded. Therefore, it is considered that erroneous detection of certain parts with a white etching layer can be prevented by using the results of the two wavelength bands together. 126. Fig. 7 Results of tilt analysis (λ:960 nm-1050 nm) 3.2.2 Differential analysis As shown in Table 1, the hyperspectral camera used in the test acquired spectral intensities with wavelength intervals of 5 nm. Therefore, after the spectral intensity was converted to a percentage using (3), the difference in spectral intensity between 5 nm was taken for each analysis area to obtain the change between each 5 nm interval. Spectral intensity (percentage)=. Spectral intensity × 100 4000. (3). Figure 8 shows the results of the differential analysis. Comparing the results of spot①(rust), spot④(no white etching layer) with the results of spot②(white etching layer) and spot③(the boundary between spot② and ④) in the figure, we found that at wavelengths from 500 nm to 650 nm there were differences depending on the surface condition of the rail. However, setting a threshold value for identification would be difficult because the waveform variation of the numerical values in each state is large. Next, we calculated the average value for 5 data (from 25 nm intervals) in order to reduce the variation in numerical values. The results are shown in Fig. 9. The calculation result of the average value at a wavelength of 25 nm intervals within the differential analysis made the difference depending on the state of the rail surface clearer. The results of the difference analysis show the possibility of improving the accuracy of the color-coded detection of the tilt analysis by setting the wavelength and parameters of the tilt analysis. On the other hand, since the result from spot⑤ (Rail bottom) was close to the result from the spot with the white etching layer, it was necessary to distinguish between them using results from different wavelengths, like a tilt analysis, or to exclude it when setting the analysis area. QR of RTRI, Vol. 62, No. 2, May 2021.
(4) Fig. 10 Results of differential analysis Fig. 8 Results of differential analysis. Fig. 9 Results of differential analysis (Average wavelength of 25 nm intervals) 3.3 Examination of image shooting method We photographed the test rail under imaging condition ② indicated in Table 2 (short light direction) in order to grasp the effect of the light source condition at the moment of shooting on the spectrum. The spectral graph of the image is shown in Fig. 10. Comparing Fig. 10 and Fig. 5, although the spectral intensities were reduced and the rate of reduction was different in all analysis areas, the spectral shapes were similar. Under imaging condition ②, it was considered that the spectral intensity decreased in all the analysis areas because the amount of light captured by the camera decreased. The reason is that the irradiation to the curved part of the top of the rail with light made the reflected light disperse. Figure 11 shows the results of differential analysis to obtain the average value at a wavelength of 25 nm intervals. Comparing the results of spot①(rust) and spot④ (without white etching layer) with the results spot②(with white etching layer) and spot③(the boundary between spot ② and ④), it can be confirmed that there is a clear difference in the spectral shape at wavelengths from 500 nm to 650 nm. Since the spectral intensity decreased overall, the differential analysis result of imaging condition ② was smaller than that of imaging condition ①. In addition, even under imaging condition ③ (light direction length, no diffusion) in which the light diffusion box was removed, the spectral intensities decreased, and the spectral shapes in all analysis areas were similar. It was also confirmed that the magnitude of the spectral intensity changes as the amount of light captured by the camera decreases under imaging conditions ⑤ to ⑧ where the positional relationQR of RTRI, Vol. 62, No. 2, May 2021. Fig. 11 Results of differential analysis (Average wavelength of 25 nm intervals) ship between the camera and the rail is 45° . From the above-mentioned results, in order to accurately identify the state of the rail surface from the hyperspectral image, it is important to secure a certain amount of light during shooting, and to set the light source conditions and set the threshold value. 4. Identification of rail deterioration 4.1 Effect of rail material We photographed the bainite rail shown in Fig. 12 under imaging condition ① to grasp the effect of the difference in rail material [2]. The spectral graph of the image is shown in Fig. 13. The spectral intensities between the wavelengths of 505 nm and 635 nm used to distinguish the white etching layer on normal rails varied greatly in all the analysis areas of the bainite rails, in spite of the small difference in spectral shape. Fig. 12 Bainite Figure 14 shows the results of difrail with white ferential analysis to obtain the averetching layer age value at a wavelength of 25 nm intervals. The bainite rail was sometimes identified even in the wavelength bands of 550 nm to 650 nm because there is a difference in spectral intensities depending on the presence or absence of a white etching layer. However, the analysis result was small on the normal rail, but it was large on the bainite rail in the area with the white etching layer. 127.
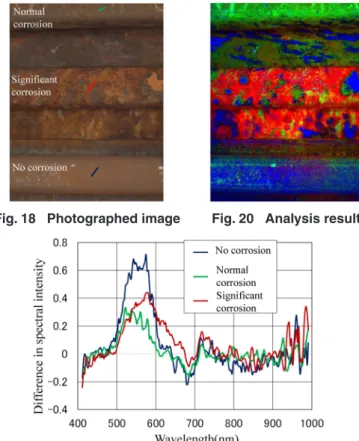
(5) Fig. 13 Spectrum graph of bainite rail (condition ①). Fig. 14 Results of differential analysis of bainite rail. Fig. 15 Analysis area of corrosion rail. Fig. 16 Spectrum graph of corrosion rail. These results demonstrate that different rail materials have different spectral shapes because the degree of light reflection or absorption is different. Therefore, we found that it is necessary to set the threshold value in consideration of the material when detecting the deteriorated part. In addition, it is possible that the same phenomenon will occur at the welded part of the rail. 4.2 Different rail deterioration (corrosion) We examined corrosion which is a typical deterioration seen noticeably on the sides and bottom of rails. We photographed the corroded rail shown in Fig. 15 under imaging condition ① to obtain spectral information and compared it with the spectrum of the white etching layer. In Fig. 15, we can see significant corrosion on the side of the rail. Although the top of the rail does not appear to be corroded, it was confirmed that the composition of the analysis area was the same because the shapes of the spectral intensities were similar. This confirmed the detectability of the white etching layer on this rail. Figure 16 shows a comparison of the spectral graphs of rail steel, corrosion, white etching layer, and rust. We have shown that the white etching layer can be detected by focusing on the difference in the spectral shape around the wavelength of 500 nm to 650 nm. In addition, we found that the corrosion of rail differs in spectral shape around the wavelength of 900 nm to 1050 nm. Next, Fig. 17 shows the average value at a wavelength of 25 nm from the results of differential analysis for each analysis area. From the figure, it is seen that corrosion is different from rail steel and white etching layer at wavelengths of 500 nm to 650 nm. Therefore, we found that the white etching layer of the rail and the corrosion can be distinguished by spectral analysis at wavelengths of 500 nm to 650 nm and wavelengths of 900 nm to 1050 nm because of the difference of spectral shapes. 128. Fig. 17 Results of differential analysis of corrosion rail 5. Examination of portable hyperspectral camera We found that it was possible to detect deterioration of the rail surface using its spectral shape. However, since the spectral intensity changes depending on the amount of light at the moment of photographing, it is necessary to photograph a deteriorated image under various conditions to examine an imaging method and an analysis method to propose a quantitative evaluation index. The cameras in Chapters 3 and 4, which are often used indoors, are too large for use in the field, to picture railroad tracks. Therefore, we used a portable hyperspectral camera to photograph a corroded rail with only halogen lights to confirm whether corrosion could be detected. Compared to a fixed camera, the portable camera used in this study had a wavelength resolution of 7 nm, which is slightly coarser, and needed about 35 seconds to capture one image. However, since the camera weighs only 1.5 kg and has a built-in simple spectrum display function, it was possible to check the photos taken of the railroad immediately. We photographed the three rails shown in Fig. 18 at QR of RTRI, Vol. 62, No. 2, May 2021.
(6) the same time: a non-corroded rail, a normally corroded rail, and a heavily corroded rail (where the corrosion is likely to come off). After photographing the rails, we selected an analysis area from the head of each rail. Figure 19 shows the differential analysis results of the analysis area, and Fig. 20 shows the identification result based on Fig.19. In Fig. 19, since the analysis area with normal corrosion or significant corrosion is less likely to reflect light than the analysis area without corrosion, the difference in spectral intensity in differential analysis was small at the wavelengths between 500 nm and 650 nm. This result is consistent with the result of image differential analysis by a fixed hyperspectral camera. In addition, there was a difference between normal corrosion and significant corrosion at the wavelengths of around 600 nm to 700 nm. By colorcoding the hyperspectral image based on the result of this. Fig. 18 Photographed image. Fig. 20 Analysis result. differential analysis, it was demonstrated that each rail could be clearly identified as shown in Fig. 20. It should be noted however, that it would be necessary to increase the number of samples in the future to confirm why the spectral shape differs between normal corrosion and significant corrosion. 6. Summary and future prospects For the purpose of improving the efficiency of inspection of various parts used in railway equipment, we investigated a method for detecting deterioration from characteristic changes in the spectrum using a hyperspectral camera. The basic test results for rail surface deterioration detection are described here: (1) The spectral intensity of the hyperspectral image acquired by this camera is affected by the brightness of the surroundings at the moment of shooting. We found that it was important to secure a certain amount of light at the momet of photographing in order to detect deterioration and evaluate deterioration with spectrum analysis. (2) Regarding the white etching layer and corrosion on the rail surface, there is a difference in the shape of the spectrum in the hyperspectral image between the wavelengths of 500 nm to 750 nm and wavelengths 900 nm to 1050 nm. Therefore, we found that the existing area in the rail cross-sectional direction can be quantitatively grasped by tilt analysis or differential analysis. (3) The authors confirmed that the spectral shape and the result of the differential analysis change significantly because the reflection and absorption of light change depending on the material of the rail. (4) We are planing to increase the number of image samples using a portable hyperspectral camera for analysis, to improve the detection accuracy of rail deterioration using spectrum analysis. References. Fig. 19 Results of differential analysis of corroded rail. [1] Tsujie, M., Matsuda, H., et al.,“Examination of the Micro Crack Propagation Caused by Rail White Layer and the Grinding Method,”RTRI Report, Vol. 23, No. 10, pp. 53-58, 2009 (in Japanese). [2] Satou, Y., and Tatsumi, M.,“Prevention of shirring with bainite rails,”RRR, Vol. 66, No. 4, pp. 18-21, 2009 (in Japanese).. Authors. . Yosuke TSUBOKAWA. Senior Researcher, Track Geometry & Maintenance Laboratory, Track Technology Division Research Areas: Track Measuring. . Tomoyuki ISHIKAWA. Researcher, Track Geometry & Maintenance Laboratory, Track Technology Division Research Areas: Track Measuring. Jun MIZUTANI. Researcher, Rail Maintenance & Welding Laboratory, Track Technology Division Research Areas: Rail Maintenance. QR of RTRI, Vol. 62, No. 2, May 2021. 129.
(7)
図

関連したドキュメント
Using an “energy approach” introduced by Bronsard and Kohn [11] to study slow motion for Allen-Cahn equation and improved by Grant [25] in the study of Cahn-Morral systems, we
We show that the Chern{Connes character induces a natural transformation from the six term exact sequence in (lower) algebraic K { Theory to the periodic cyclic homology exact
The study of the eigenvalue problem when the nonlinear term is placed in the equation, that is when one considers a quasilinear problem of the form −∆ p u = λ|u| p−2 u with
“Breuil-M´ezard conjecture and modularity lifting for potentially semistable deformations after
So far, most spectral and analytic properties mirror of M Z 0 those of periodic Schr¨odinger operators, but there are two important differences: (i) M 0 is not bounded from below
In this section we state our main theorems concerning the existence of a unique local solution to (SDP) and the continuous dependence on the initial data... τ is the initial time of
After briefly summarizing basic notation, we present the convergence analysis of the modified Levenberg-Marquardt method in Section 2: Section 2.1 is devoted to its well-posedness
Starting from a dualisable, strongly irregular algebra M, we may use the general theory of P lonka sums to produce a version of Theorem 2.3 that preserves the type of M ∞
