Quality Control Acceptance Criteria Improvements for Pre-Stressed High Strength Concrete
Pile Driving Operations in Japanese Building Construction
Kenneth Bull
*
1, Juan Jose Castro2 and Kozo Nakada3 1 Civil Engineer, OYO Corporation, Pacific, Japan2 Professor, Faculty of Engineering, University of the Ryukyus, Japan 3 Associate Professor, Faculty of Engineering, University of the Ryukyus, Japan
Abstract
The current practice in Japan for most driven pre-stressed high strength concrete (PHC) piling sites utilizes an "energy formula" approach involving the "set-penetration test." In its current state, driven PHC piles in the Japanese construction industry are at increased risk of being damaged due to inferior driveability evaluation procedures leading to an increased probability of damaged piles remaining undetected after installation. This study presents two case studies in Okinawa, Japan which utilized dynamic analysis as the primary piling quality acceptance criteria and compares results to the energy formula approach which is more common to Japanese construction sites. Based on the observations of these two case studies, the applicability of dynamic testing, particularly the high-strain dynamic test, the low-strain integrity test, and wave equation analyses is analyzed. In conclusion, a case is presented that Japan's over reliance on an energy formula approach should be augmented by additional QC procedures. A combination of wave equation analysis, dynamic testing and simple visual inspection of post-driven PHC pile conditions is recommended to better protect the integrity of driven PHC piles throughout Japan.
Keywords: pre-stressed high strength concrete (PHC) pile; pile driving; pile quality control; dynamic analysis
1. Introduction
Precast high strength concrete (PHC) piles are used extensively throughout the world due to the many advantages they offer in strength in bearing and bending, durability, and economy. In Japan, PHC piles are commonly installed by the pre-bore end-driving method with fairly limited quality control (QC) testing occurring during construction. The primary QC field test for driven piles in Japan involves the "set-penetration test" which utilizes an energy formula approach to estimate the final bearing capacity of the installed pile. The energy formula approach in Japan uses a calculation adapted from Hiley's original pile driving formula of 1925, Hiley (1925), and is promulgated by the Japan Ministry of Land, Infrastructure and Tourism (MLIT) for driven piles. This study compares Japan's "energy formula" approach to a more rigorous "dynamic analysis" approach which is widely
employed throughout the world. The types of dynamic analysis discussed in this paper specifically include the high-strain dynamic load test (HSDLT), the low-strain integrity test (LSIT), and wave equation analysis (WEA).
This study presents data from two case study sites in Okinawa, Japan both of which implemented dynamic and energy formula approaches. The results of the dynamic testing programs and comparative analysis to standard Japanese industry practices are presented. In doing so, significant disadvantages to the energy formula approach are discussed and recommendations for improved QC through the introduction of increased dynamic analysis and increased visual inspection for PHC piles are recommended.
2. Japan Acceptance Criteria for Driven PHC Piles
Pre-bored end-driven PHC pile acceptance criteria in Japan is primarily focused on confirming end-of-driving conditions consisting of 1) auger torque records which prove the dense soils of the bearing layer have been reached; and 2) the measurement of set per blow, "set-penetration test", conducted at final driving. These verifications provide evidence that the pile is embedded into a dense and reliable bearing layer important in ensuring bearing capacity is satisfactorily achieved. The MLIT pile driving formula estimates the
*Contact Author: Kenneth Bull, P.E., Civil Engineer, OYO Corporation, Pacific
1-24-13 Kume, Naha-shi, Okinawa, 900-0033, Japan Tel: +81-98-863-0260 Fax: +81-98-863-0223 E-mail: kbull@oyopacific.com
( Received March 29, 2017 ; accepted July 23, 2018 ) DOI http://doi.org/10.3130/jaabe.17.519
long term allowable bearing capacity of the pile using mathematical correlation between bearing capacity, blow energy, and set (measured penetration depth per blow). The MLIT driving formula, MLIT (2007), is defined as:
where:
Rɑ = Allowable bearing capacity (kN) F = Hammer blow energy (kN·m) For drop hammers,
For hydraulic hammers,
W = Weight of hammer (metric-ton) H = Drop height (m)
γ = Conversion factor (metric-tons to kN) s = Set (m)
3. Energy vs. Dynamic Approaches to Pile Driving
The MLIT formula is an energy-based equation which assumes that the "energy of impact by a hammer" equals to the "work done by the pile resistance and losses of the pile-soil system". Energy formulas make broad assumptions about "average hammer performance" that do not realistically account for site-specific driving systems, pile characteristics, and soil parameters leaving results open to gross inaccuracy and therefore, significant risk, Allin, et al. (2015). Conversely, the MLIT driving formula method is preferred due to its ease of use and low cost making it a very practical and convenient field check.
In contrast, QC testing using dynamic analytical techniques for driven piles (i.e., WEA, HSDLT) based on tenants of one-dimensional (1D) wave propagation theory and, although more complex, were ultimately developed out of a long-recognized need to establish a more reliable method for predicting the bearing capacity of driven piles. Using WEA, driveability simulations that estimate driving resistance, driving stresses, transferred energy, blow count, set and pile bearing capacity, etc. are based on site-specific driving system-pile-soil input parameters which can be modeled by computer software at relatively low cost to the project. Additionally, the energy imparted during the driving process can be directly measured by strain and accelerometer gauges in the HSDLT to assist engineers not only to evaluate pile capacity but also to assess pile integrity and hammer performance. Dynamic testing for piles continuous to be routinely used worldwide on over 5000 job sites each year, Hussein, M. et al. (2004). WEA and HSDLT are conducted at a lower frequency in Japan compared to other countries that have adopted dynamic foundation testing codes and standards, Beim, G., et al. (2008).
4. Research Methodology
The two case study sites presented in this study investigate two distinct dynamic testing methods
for driven piles but include also the energy formula approach of the set-penetration testing at final driving which is typical of Japanese piling QC protocol. Case Study 1 focuses on the HSDLT, a test method originating from research conducted in the 1960s and 1970s at what is now known as Case Western Reserve University which uses strain and acceleration measurements in conjunction with 1D wave propagation theory to evaluate transferred energy and stresses during driving as well as pile bearing capacity. Case Study 2 provides a stepped analysis on the effectiveness of LSIT, a non-destructive pile testing method for integrity assessment, focusing specifically on the case of spliced PHC pile installation. Data from the Case Study 1 site was subsequently used to conduct WEA, a numerical method of analysis for the behavior of driven foundations developed in the 1950s by E.A. Smith. WEA was conducted to retrospectively simulate variable driving system conditions for the Case Study 1 site. Although the QC testing programs are different between the case studies, the results are related to an overall discussion regarding dynamic testing QC acceptance criteria for PHC piles.
5. Case Study 1 – HSDLT as Acceptance Criteria
The Case Study 1 site involved the construction of a 2-story school facility with a deep foundation system consisting of approximately 1100 PHC piles installed by the pre-bore end-driving method. Installed pile lengths varied from 15 to 20 meters (m) below ground surface with most piles requiring splicing of two pre-cast pile elements. PHC piles were required to meet an allowable bearing capacity, Ra, of 620 kilonewtons (kN).
In contrast to QC requirements common to Japan for PHC pile driving, the QC testing and acceptance criteria for Case Study 1 required HSDLT for 15% of the total piles installed at the site. In total, HSDLT was conducted at 164 test piles in accordance with the ASTM D4945-12 test method. The results of the HSDLT later underwent signal matching analysis using the CASE Pile Wave Analysis Program (CAPWAP) software during which static shaft and toe bearing capacity of the pile is estimated by matching the calculated results from wave propagation analysis with the measured HSDLT values. Pile Dynamics, Inc. manufactured the Pile Driving Analyzer (PDA), and the PAK Model was used to conduct the HSDLT as shown in Fig.1. below.
R
��
�������(kN)
� � � � � � �
� � �� � � � �
�
������ ������
���� ���������
�
�������� ������� �
��� ���������
(
1)
(
2)
(
3)
(1)R
��
�������(kN)
� � � � � � �
� � �� � � � �
�
������ ������
���� ���������
�
�������� ������� �
��� ���������
(
1)
(
2)
(
3)
R
��
�������(kN)
� � � � � � �
� � �� � � � �
�
������ ������
���� ���������
�
�������� ������� �
��� ���������
(
1)
(
2)
(
3)
5.1 Driving Energy and Pile Capacity
Piles were driven at Case Study 1 using a 4-ton double-acting hydraulic driving system set initially with a 1.14-meter (m) ram stroke. Pile driving was conducted simultaneously by multiple pile drivers (all of which were of the same model and manufacture) across the site. Initially, piles were driven using the 1.14m ram stroke, however, crack damage observed through visual inspection was discovered in an unacceptable number of installed piles. As a result, the remaining piles were subsequently installed with a reduced ram stroke of 0.95m. This reduction in ram stroke provided the opportunity to compare pile behavior under two distinct pile-driving energies, as presented below. Data obtained for maximum energy transferred (EMX) during driving at the two ram stroke settings averaged across the site is summarized in Table 1.
The maximum ram energy for the 4-ton pile driver used at the site is listed as 45.6 kJ and 38.0 kJ at 1.14m and 0.95m ram strokes, respectively. Based on the data obtained from HSDLT for three pile drivers, an average energy transfer ratio [EMX/E-rated] at the 1.14m stroke was 40%, 58%, 36% for pile drivers 1, 2, and 3, respectively. At a 0.95m stroke, pile drivers 1, 2 and 3 showed average energy transfer ratios of 34%, 56%, and 33%, respectively, indicating a significant variance of transferred energy even when driving systems of the same manufacturer are acting on similar piles and across similar soil conditions. This variability between driving efficiency is not accounted for under the Japanese MLIT energy equation, presenting a source for significant deviation in the estimation of pile bearing capacity. The difference between MLIT energy equation and HSDLT estimates for calculated pile bearing capacity differ significantly, as is indicated in Case Study 1 test results summarized in Table 2., below. HSDLT estimates, unlike the MLIT energy formula, are based on both site and driving system-specific variable inputs, Bull (2016a).
5.2 Damage to Piles During Pile Driving
PHC piles are cracked when high driving stresses are continued, disintegrating the concrete by fatigue failure and resulting in the eventual brittle failure of
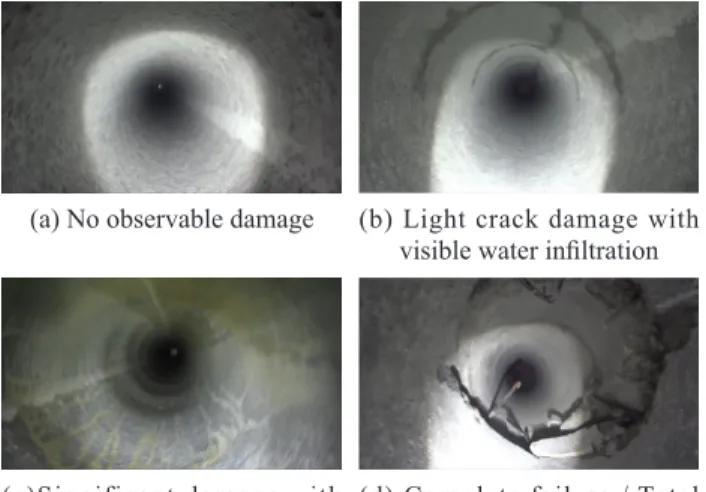
the reinforcing steel tendons. In a referenced study conducted by Gerwich Jr. B., horizontal cracks in driven PHC piles are shown to appear suddenly about one-third of the length down from the head of the pile and spaced about 0.5m apart, Gerwick (1968). However, in Case Study 1, pile damage was characterized by semi-circular cracks visible primarily in the lower sections near the pile toe and spaced roughly 0.5 to 1m apart. Complete pile failure due to excessive forces during driving was detected at 4 production piles, which required replacement piles to be installed. As a result of video assisted inspection of 164 test piles, the post-installation conditions were observed and categorized into four categories shown in Fig.2., below.
5.3 Allowable Stresses During Pile Driving
Limits for allowable driving stresses for prestressed concrete piles provided by the project specifications are based on U.S. Federal Highway Administration (FHWA) criteria shown below, Vanikar, (1986):
Where σcomp. and σtensile are the maximum allowable compressive and tensile driving stress (MPa), fc' is the
compressive strength of concrete (MPa), and UPL is the unit prestress after losses (MPa). Based on Equations (2) and (3) above, the calculated allowable limits for the Case Study 1 site were 68.25 MPa and 6.30 MPa for compressive and tensile driving stresses, respectively.
The percent decrease in EMX due to the change from 1.14m to 0.95m ram stroke was approximately 21-29%. This decrease in energy led to an immediate decrease in tensile stresses imposed on the piles and a marked improvement in reduction of piles damaged by pile driving when averaged across the site. The reduction in driving stress and subsequent reduction in pile damage resulting from the reduction in ram stroke is shown in the following Tables 3. and 4.
Table 1. Averages in Maximum Energy Transferred (EMX) Pile
Driver 1.14m stroke (kJ) 0.95m stroke (kJ) Decrease% EMX
1 18.11 12.94 28.5%
2 26.67 21.11 20.8%
3 16.54 12.71 23.2%
Table 2. MLIT and HSDLT Derived Bearing Capacities, Ru
Ram Stroke
(m)
Ru [MLIT]
(kN) Ru [HSDLT] (kN) Range Avg. Range Avg. 1.14 1971~2628 2460 1411~2489 1894 0.95 1995~2160 2076 1260~1612 1484
Fig.2. Post-Installation Condition Categories
(a) No observable damage (b) Light crack damage with visible water infiltration
(d) Complete failure / Total structural compromise (c)Significant damage with
visible mud infiltration (or greater than 10 cracks)
R��������� (kN) � � � � � � � � � �� � � � � ������� ���������� ��������� ��������� ������� ���� ��������� (1) (2) (3) (2) (3)
Upon the decrease in ram stroke to 0.95m, an immediate reduction in transferred energy, internal stresses, and crack damage was noted. Since the set-penetration test does not provide any information on pile integrity, the observation of damaged piles was directly attributable to the 164 HSDLT and visual inspections conducted at the site as a part of the dynamic analysis pile QC program. In fact, four piles were confirmed broken from excessive driving stresses, while they passed the set-penetration test with no obvious negative indications, Bull (2016b).
6. Case Study 2 – LSIT as Acceptance Criteria
The LSIT is a non-destructive technology (NDT) standardized by ASTM D5882-16. LSIT quickly evaluates pile integrity by inducing a pulse wave into the pile which is then measured with a piezo-electric accelerometer held tightly to the pile head measuring impedance changes encountered by the pulse wave in the pile material. The LSIT test record, called a reflectogram, indicates pile integrity by the presence of a clear pile toe response and absence of significant impedance variations in the pile body. Although the LSIT provides information on pile integrity, it does not provide any information on the bearing capacity, Massoudi, et.al. (2004). Thus, the LSIT should not provide the sole basis for pile acceptance and should be augmented by a separate test capable of evaluating in-situ pile bearing capacity.
In Case Study 2, LSIT was conducted in a stepped fashion during the installation of spliced PHC piles. The testing program was designed to separate various environmental effects during the various stages of the pile installation process. These influences include the presence/absence of a welded splice and shaft friction before and after driving. The results of stepped LSIT yielded interesting data in regards to the applicability of the LSIT to PHC piles, particularly to the case of weld-spliced piles. LSIT results were augmented by visual inspections of the inner pile to confirm the existence and exact locations of cracks, if observed.
6.1 Testing Sequence
The LSIT testing sequence for Case Study 2 was conducted at T1 through T4 stages: Stage T1 - LSIT was conducted while the pile was laid on the ground prior to insertion (simulating no friction); Stage T2 -
LSIT was conducted after insertion of the bottom pile into the pre-bore hole prior to splice welding; Stage
T3 - LSIT was conducted after the spliced pile is
inserted into the pre-bore hole but prior to pile driving (simulating spliced case with no friction); Stage T4
- LSIT was conducted immediately following pile
driving penetration into the bearing layer of roughly 2 times the pile diameter (simulating spliced condition with introduction of shaft friction near the bottom of the pile). An assumed pulse echo wave velocity of approximately 4500 meters per second (m/s) was used in the analysis.
6.2 Detection of Pile Damage
Based on visual inspection conducted at Case Study 2, cracks were detected in 4 out of 5 test piles. Similar to the cracks observed at Case Study 1 piles, cracks at Case Study 2 were semi-circular, appeared at 0.5 to 1m repetitive intervals, and were concentrated in the lower portion of the bottom piles near the pile toe. Two characteristic test pile LSIT results are presented in Fig.3., below.
Fig.3. shows the reflectograms obtained during each stage of the LSIT which can be studied and compared to analyze the changes brought about by the varying conditions of each stage of pile installation. Comparing T1 and T2 stages for both piles No.43 and No.45 show a slight change in the smoothness of the reflectogram, likely caused by the introduction of modest skin friction when the pile is inserted into the pre-bore hole at stage T2 of the installation process.
T3 and T4 stages are useful to observe the effects of shaft friction introduced by the penetration of the pile after driving. It is evident in the pile No.43 test record
Table 3. Change in Internal Stresses Ram
Stroke (m)
Max. Comp. Stress
(MPa) Max. Tensile Stress (MPa) Range Avg. Range Avg. 1.14 20.5~39.7 30.5 1.5~6.7 4.2 0.95 21.4~29.0 23.9 1.4~4.0 2.9 Table 4. Change in Observed Pile Damage
Ram Stroke
(m)
Pile Condition After Driving No
Damage DamageLight Significant Damage Complete Failure 1.14 40.8% 48.3% 9.0% 2.0% 0.95 63.5% 33.3% 1.6% 1.6%
that skin friction introduced to the pile after driving at stage T4 creates a significant compressive reflection (upward wave) to appear a few meters in advance of the toe reflection. In pile No.45 the reflectogram shows an indication of high shaft friction even at the T3 stage, indicative of actual site conditions because driving was required in order to seat the pile to the bottom of the bore hole at the T3 stage of pile No. 45. Although the reflection from the splice is obvious in both stages T3 and T4 test records for both test piles, the toe response is significantly reduced at T4 stages although a downward reflection is still visible in both cases near the 27m pile toe location.
Fig.4. below illustrates the results of video inspection after driving and denotes the presence of any observed cracks inside the test piles.
Based on stepped testing at Case Study 2, it appears that shaft friction and pile set-up (the increase of shaft friction due to the shift of soil particles over time) appear to heavily influence the LSIT results, possibly masking reflections that may be caused by cracks in the pile body. LSIT of single pile elements appear much simpler to interpret than in the spliced pile case.
In the case of spliced PHC piles it is proposed by many in the industry that the LSIT pulse wave is
completed reflected by the welded splice between piles, thereby making information below the splice impossible to attain when employing this technology. Additionally, when utilizing the LSIT on PHC piles, the tubular geometry of the pile does not satisfy the plane-section assumption of the 1D wave-propagation theory, Shi, et al. (2008).
Despite assertions that the LSIT impulse wave cannot penetrate through the welded spice between piles, a simple glance at stages T3 and T4 reflectograms indicates a contrary situation. Reflections which occur at the lower portions of the pile appear to be due to shaft friction and are not apparently caused by secondary reflections of upper pile impedances or reflections of the splice. This is evident by the non-symmetrical nature of upper and lower halves of the T3 and T4 reflectograms. This supports the supposition that the pulse wave penetrates through the weld, at least partially, and therefore, the LSIT can provide some information below the splice, which is indicative of conditions of the lower pile body and its interaction with surrounding soils.
Due to significant reflection of the pulse wave caused by the welded splice and due to secondary reflections of this large impedance, it can be difficult to distinguish between the toe reflection and a secondary reflection of the splice, particularly when bottom and top piles are similar in length. The significant size of the splice reflection and additional influences of shaft friction appear to cause a large masking effect on the pile toe reflection.
Video inspection results showed multiple light crack damage in pile No. 45 at 14, 15, 18.5, 24.5, 25, and 26 m depths (See Fig.4.). Visible reflections in the LSIT reflectogram are not obvious and are likely being masked by the splice or by shaft friction, or both. Alternatively, cracks may be too small to create impedance changes that are detectable to the LSIT.
Crack damage confirmed by video observation was in many cases impossible to detect by the standalone results of the LSIT. This situation is likely the outcome of complications which arise from the welded joints and the effect of multiple reflections of the joint which potentially mask lower anomalies such as crack damage.
7. WEA for Case Study 1 Driving Conditions
Based on the observation that many piles were cracked during driving at both case study sites, WEA was conducted to re-evaluate the driving conditions at the Case Study 1 site. GRLWEAPTM Ver. 2010 software created by PDI, Inc. was used to conduct WEA drivability analysis by inputting site-specific soil parameters gathered from site boring logs and the measured results of the HSDLT. Driving system specifics, cushion materials, and pile information were modeled and multiple simulations ran with various ram stroke options for 4-ton and 7-ton driving systems
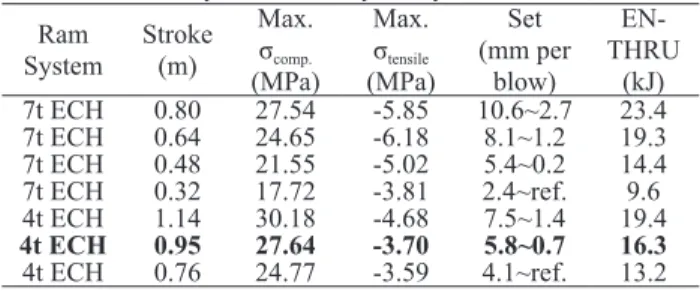
to retrospectively evaluate optimal driving settings. The calculated allowable limits based on FHWA equations (2) and (3) for the Case Study 1 site were 68.25 MPa and 6.30 MPa for compressive and tensile driving stresses, respectively. The results of the WEA driveability analysis are shown in Table 5., below.
Based on an ultimate capacity of 1770.7 kN attained by the inputted model, WEA simulations in general show an expected decrease in driving stress when ram strokes are reduced. Based upon decreased tensile driving stresses and an estimated set indicative of a reasonable pile driving rate, the 4-ton ECH at 0.95m ram stroke shows the most promising results. The 0.95m stroke estimated as the most advantageous by WEA matches the stroke which was ultimately selected by project engineers at the Case Study 1 site to reduce piles being damaged due to overdriving.
8. Conclusions
The MLIT pile driving formula does not account fully for the hammer-cushion-pile-soil system and is therefore susceptible to significant inaccuracy. In addition, significantly damaged piles and even broken piles were observed to pass the inspection requirements of the set-penetration test thus running the risk of inadvertent acceptance of severely impaired or even broken piles into structural foundations. Other PHC piling sites across Japan may similarly fail to recognize pile integrity issues due to a lack of sufficient QC monitoring of the driving process during construction. In general, PHC pile driving practices in Japan appear to overly rely on outdated energy equation methods and have not required pile contractors to use more sophisticated dynamic analysis. From a practical standpoint, a WEA is almost as fast and simple as using an energy formula to govern pile installation, Likins (2004) and can be performed at a relatively low cost.
The resulting analysis of the two case studies presented in this research argues that a combination of WEA and HSDLT offers a much more realistic and site-specific understanding of the pile-soil-hammer interaction during driving which correlate with critical information that can be used to improve those same driving processes and can both recognize and avoid costly pile foundation damage. Additionally, visual inspection by accessing the inner pile with simple
camera equipment is a cost-effective way to quickly confirm the presence or absence of pile damage in PHC piles and identify potential pile driving issues during construction.
In regards to the LSIT studied in Case Study 2 the LSIT to spliced PHC piles is less practical than in the single pile case. Video assisted visual inspection of the inside annulus of PHC piles is recommended as a more cost-effective and reliable inspection solution, Bull (2016a). Although LSIT is a very quick and cost-effective NDT for assessing pile integrity, its application to spliced PHC piles is both complex and limited, thus, should be approached with caution by the QC engineer.
In examining current deficiencies in Japanese pile installation practices, this study makes the case that a combination of WEA, HSDLT, and visual inspection QC requirements, if implemented, will enhance the current state of driven PHC piling QC for the Japanese construction industry.
References
1) Allin, R., Likins, G., Honeycutt, J. (2015) Pile Driving Formulas Revisited. IFCEE Geotechnical Special Publication No. 256, pp.1052-1063.
2) Beim, G. & Likins, G. (2008) Worldwide dynamic foundation testing codes and standards. Science, Technology and Practice, Jaime, Alberto dos Santos (ed), pp.698-697.
3) Bull, K., Castro, J.J., Nakada, K. (2016a) Capabilities and Limitations for Low-Strain Dynamic Testing of Spliced PHC Piles. Architectural Institute of Japan, AIJ Kyushu Chapter August 2016 Architectural Research Convention, Fukuoka University, pp.665-666.
4) Bull, K., Castro, J.J., Nakada, K. (2016b) Study on the Acceptance Criteria and Quality Control Processes for PHC Driven Piles – Case Study in Okinawa Prefecture. Architectural Institute of Japan, 55th Kyushu Chapter Architectural Research Meeting, pp.545-548.
5) Gerwick Jr., B. (1968) Prestressed Concrete Piles. Journal of Prestressed Concrete Institute (PCI), October 1968, pp.66-93. 6) Hiley, A. (1925) A rational pile driving formula and its application
in piling practice explained. Engineering, (London) (119): 657, 721.
7) Japan Ministry of Land, Infrastructure, and Transportation. (2007) Architectural Construction Management Guideline, Volume 1: 1208-1214.
8) Likins, G. (2004) Pile Testing – Selection and Economy of Safety Factors. Current Practices and Future Trends in Deep Foundations, Geotechnical Special Publication No. 125, ASCE, pp.239-252. 9) Massoudi, N., Teferra, W. (2004) Non-Destructive Testing of Piles
Using the Low Strain Integrity Testing Method. Proceedings of the 5th International Conference on Case Histories in Geotechnical
Engineering, Paper No. 9.03.
10) Shi, F., Huang, Y., Liu, J., and Hou, W.S. (2008) Limitations of low-strain integrity test for PHC piles and solution. Science, Technology, and Practice, Jaime Alberto dos Santos Ed., pp.459-463.
11) Teferra, W., Thendean, G.E., Likins, G. (1996) Driving Stress Control During the Installation of Precast Prestressed Cylindrical Concrete Piles. Proceedings of the 5th International Conference on
the Application of Stress-wave Theory to Piles 1996, pp.903-911. 12) Vanikar, S. N. (1986) Manual on Design and Construction of
Driven Pile Foundations. U.S. Department of Transportation, Federal Highway Administration, Demonstration Projects Division, Washington D.C.: 310-320.
Table 5. Case Study 1 Driveability Analysis Ram System Stroke (m) Max. σcomp. (MPa) Max. σtensile (MPa) Set (mm per blow) EN-THRU (kJ) 7t ECH 0.80 27.54 -5.85 10.6~2.7 23.4 7t ECH 0.64 24.65 -6.18 8.1~1.2 19.3 7t ECH 0.48 21.55 -5.02 5.4~0.2 14.4 7t ECH 0.32 17.72 -3.81 2.4~ref. 9.6 4t ECH 1.14 30.18 -4.68 7.5~1.4 19.4 4t ECH 0.95 27.64 -3.70 5.8~0.7 16.3 4t ECH 0.76 24.77 -3.59 4.1~ref. 13.2