© JCRM All rights reserved. ① 上椎葉 ② 岩屋戸 ③ 塚原 ④ 諸塚 ⑤ 山須原 ⑥ 西郷 ⑦ 大内原 日向市 ① 上椎葉 ② 岩屋戸 ③ 塚原 ④ 諸塚 ⑤ 山須原 ⑥ 西郷 ⑦ 大内原 日向市
Mimikawa
River
1.Kamishiiba
93 MW
[1955]
2. Iwayado
51 MW
[1942]
4. Morotsuka
50 MW
[1961]
5. Yamasubaru
41 MW
[1932]
6. Saigou
27 MW
[1929]
7. Oouchibaru
16 MW
[1956]
[
] indicates year of
commissioning
Stream length: 94.8km
Watershed area: 884.1km
2Kyushu
3. Tsukabaru
63 MW
[1938]
① 上椎葉 ② 岩屋戸 ③ 塚原 ④ 諸塚 ⑤ 山須原 ⑥ 西郷 ⑦ 大内原 日向市 ① 上椎葉 ② 岩屋戸 ③ 塚原 ④ 諸塚 ⑤ 山須原 ⑥ 西郷 ⑦ 大内原 日向市Mimikawa
River
1.Kamishiiba
93 MW
[1955]
2. Iwayado
51 MW
[1942]
4. Morotsuka
50 MW
[1961]
5. Yamasubaru
41 MW
[1932]
6. Saigou
27 MW
[1929]
7. Oouchibaru
16 MW
[1956]
[
] indicates year of
commissioning
Stream length: 94.8km
Watershed area: 884.1km
2Kyushu
3. Tsukabaru
63 MW
[1938]
Volume 11, Number 1, January 2015, pp.1-10[Issue
Paper]
Wide-area slope failure prediction based on characteristics of past slope
failures: Case of Mimikawa River Basin
Hiroaki YOSHITAKE*, Takeshi YOSHIMURA** Mutsuhiro KAKU**, Hiroaki IKEMI*** &
Yasuhiro MITANI***
* Member of ISRM: Kyushu Electric Power Co., Inc., Fukuoka City, Japan * *Kyushu Electric Power Co., Inc., Fukuoka City, Japan *** Member of ISRM: Kyushu University, Fukuoka City Japan
Received 25 06 2014; accepted 16 01 2015
ABSTRACT
Mimikawa River with seven dams and power stations in operation runs in the eastern area of Kyushu. With a total output of 341MW, the river basin is an important hydro-energy source in the Kyushu region. Typhoon No. 14 in 2005 brought record-breaking heavy rainfall, causing severe slope failures in approximately 500 locations. This experience raised awareness of the potential risk of slope failures which might occur in Mimikawa River Basin. Kyushu Electric Power owns hydroelectric power stations distributed over a wide area in this basin. From the viewpoint of appropriate dam operation, facility maintenance, and medium-long term installation, it is essential to understand the future risk of disaster due to slope failures, in advance, and optimally control this risk. However, because the slope failure phenomenon is very complex, and occurs over a wide area of the Mimikawa River Basin, there are no established methods to predict or manage these failures. The unprecedented Typhoon No. 14 disaster experience has provided key data for future slope failure prediction. By carrying out investigations such as a wide-area survey of slope failures, characteristics of slope failures including the locations, scales, failure mechanism and the level of rainfall that causes failure were clarified. In addition, through the use of information obtained from records of past disasters, a simplified method for wide-area slope failure prediction based on the characteristics of the river basin was structured. And through the use of this information and this method, the authors sought to identify slopes for which failures might occur and the level of rainfall that would cause failure (risk map). One example of specific hydroelectric installation risk management was also considered.
Keywords: Mimikawa, Typhoon No. 14 (2005), slope failures, wide area, prediction
1. INTRODUCTION
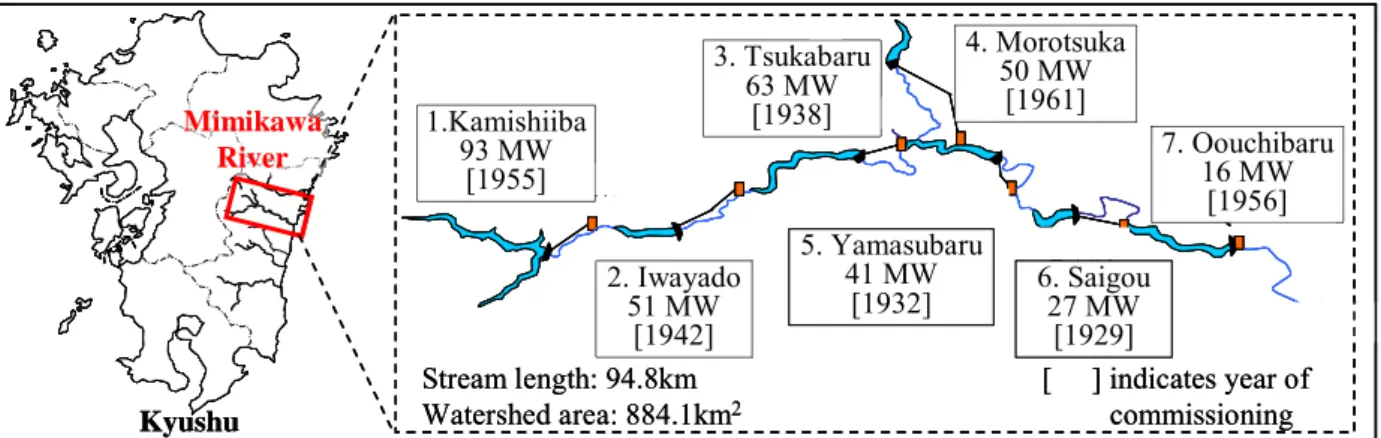
Mimikawa River with a length of 94.8km runs in Miyazaki in the eastern area of Kyushu. The seven dams and hydroelectric power stations, which have been installed in the
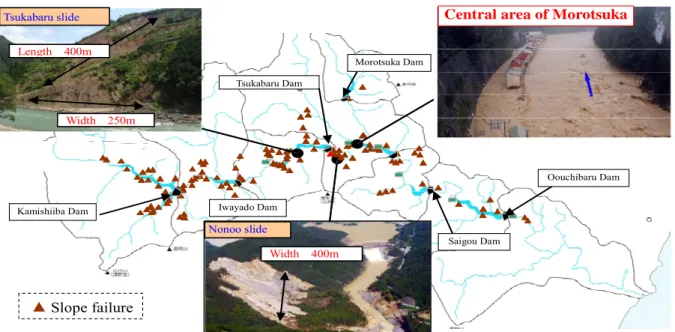
river basin as shown in Figure 1, have a total output of 341MW, making them an important hydro-energy source in Kyushu. In September, 2005, Typhoon No. 14 hit Japan, bringing record-breaking rainfall exceeding 1,000mm to the mountainous areas in Miyazaki, causing extensive slope failures that were the worst on record in terms of both number
and scale. Sediment amounting to 10 million m3 attributable to slope failures flowed into dam-regulating reservoirs and rivers, causing a rapid rise in the riverbed, and leading to a worsening of the flood disaster, as shown in Figure 2.
This experience raised awareness of the potential risk from slope failures which may occur in the basin in future. Kyushu Electric Power (KEPCO) owns hydroelectric power generating facilities (incl. dams, reservoirs, and generation and transmission facilities) distributed over a wide area in this basin, which remain at risk from natural disasters. From the viewpoint of appropriate dam operation, facility maintenance, and medium-long term facility installation, it is essential to understand the future risk of disaster due to slope failures, in advance, and optimally control this risk. To realize this, a specific technique is needed to identify “locations at which slope failures might occur” and the “probabilities of such events occurring” over the wide area of the Mimikawa River Basin. In recent years, through research that has been progressing through various approaches, including methods that employ wide-area slope stability analysis models using GIS, and statistical methods that use tank models, the degree of risk is being assessed relatively (Japanese Geotechnical Society, 2006). However, because the slope failure phenomenon is very complex, and occurs over a wide area of the Mimikawa River Basin, there are no established methods to predict or manage these failures.
The severe Typhoon No. 14 disaster experience has provided key data for future slope failure prediction, and the aim of this study was to clarify the characteristics of slope failures in the basin, including the locations and scales of failures, failure mechanism, and level of rainfall that causes failure. Further, through the use of information obtained from records of past disasters, a simplified method for wide-area slope failure prediction based on the characteristics of the river basin was structured. And through the use of this information and this method, the authors sought to identify slopes for which failures might occur and the level of rainfall that would cause failure (risk map). In this connection, for prediction, rainfall data was used as an indicator, one which is easily applicable to dam operation. In addition, one example of proposed risk management based on characteristics of hydroelectric installations was also considered.
2. TOPOGRAPHICAL AND GEOLOGICAL CHARACTERISTICS
The geology of the Mimikawa River Basin is characterized with an accretionary prism that is mainly composed of Shimanto Supergroup sedimentary rock. A number of faults generated in the course of accretion prism formation can be seen (MITI, 1995). In areas near faults, brittle fracture zones created through transformation and compression are distributed, making these areas fragile, as shown in Figure 3. In the area, precipitous V-shaped valleys are formed through upheaval due to plate subduction as well
Slope failure
Tsukabaru Dam
Saigou Dam
Oouchibaru Dam Morotsuka Dam
Kamishiiba Dam Iwayado Dam
Central area of Morotsuka Tsukabaru slide
Width 250m Length 400m
Nonoo slide
Width 400m
Figure 3. Mimikawa River Basin geology and geological structure.
〔Mimikawa River cross-section schema〕
Right bank 左 岸 右 岸 不安定斜面 耳 川 遷急線 遷急線 Left bank Occurrence of large-scale slope failures Erosion Colluvial soil Opposite dip Dip slope Break line Steep gradient (many failures) Break line Mimikawa River
〔Geology in Mimikawa River basin〕
Butsu zoutect onic l ine Chich ibu be lt Shima ntoSup ergrou p lower s
ection Mimikawa
River Shim anto Supe rgro up uppe r sec tion Butsu zoutect onic l ine Chich ibu be lt Shima ntoSup ergrou p lower s
ection Mimikawa
River Shim anto Supe rgro up uppe r sec tion
Neogene igneous rocks (granite, rhyolite, andesite)
Mesozoic- Paleozoic sedimentary (sandstone, shale, chart, limestone) Paleogen
(sandstone, shale, interbeds of sandstoneand shale) Cretaceous sedimentary
(sandstone, shale, interbeds of sandstone and shale)
as the action of river erosion. In addition, as the river descends through the valley following a sinuous course, there are many water colliding fronts.
This basin also constitutes the geological structure of the northern side incline of the northeast-southwest line of strike, therefore the right bank side dip slope, and left bank side stratum of opposite dip predominate. Concerning the dip slope structure, there is a tendency for slope failures to occur in a bedding plane acting as a boundary. For this reason there have been repeated slope failures in the past as well, and it has been confirmed that colluvial deposits are thickly distributed on slopes (Yoshitake, 2009), as shown in Figure 3.
3. CHARACTERISTICS OF SLOPE FAILURES
To predict slope failures that occur in response to the characteristics of the Mimikawa River Basin, from the points of view of: locations and scales of failures, failure mechanism, and level of rainfall that causes failure, the characteristics of slope failures in the Mimikawa River Basin were clarified as follows.
3.1 Locations and scales of failures
3.1.1 Wide area slope failure survey carried out after Typhoon No. 14 in 2005
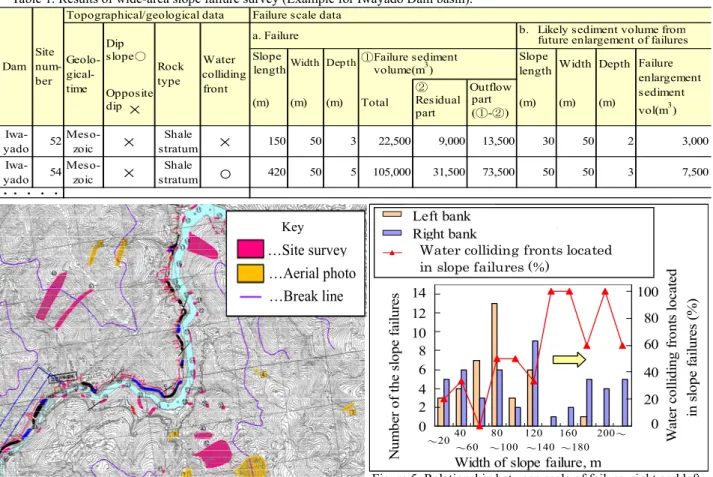
Through interpretation of aerial photographs and a field survey carried out in the basin after the Typhoon No. 14 disaster, slope failures were identified at 491 locations. The data on failure scale by slope (i.e. width, depth, length and
failure soil volume) as well as data on topography and geology was organized as illustrated in Figure 4 and Table 1.
3.1.2 Characteristics of locations and scales of failures
Figure 5 shows the relationship between width and number for extracted slope failures. From this graph, it can be seen that almost all large-scale slope failures (slope failure width greater than approximately 100m) occur on the right side (dip slope). In addition, it has been ascertained that the majority of large-scale slope failures are located in water colliding fronts, which are susceptible to the effects of erosion at slope peripheries. In other words,large-scale slope failures have a high probability of occurring on the dip slope (right side) where there have been repeated failures in the past, and a very significant factor in these failures is the erosive action of flooding, which is evident from the record of failures.
In addition, concerning slope failures, when aerial photographs and topographic maps from before and after Typhoon No. 14 were compared, it was understood that landforms such as scarps and convex gentle slopes were important elements (Figure 6). These elements are indicative of locations with thickly distributed colluvial deposits that have a history of repeated movement. In the case of the Mimikawa River Basin, slope failures are not what are generally termed rock failures, but classified as colluvial deposit failures. And it is known for example, that scarps and step landforms found in the basin microtopography are associated with these latter failures (Suzuki, 2008).
Table 1. Results of wide-area slope failure survey (Example for Iwayado Dam basin).
Key
…Site survey
…Break line
…Aerial photo
Iwa-yado 52 Meso-zoic×
Shale stratum×
150 50 3 22,500 9,000 13,500 30 50 2 3,000 Iwa-yado 54 Meso-zoic×
Shale stratum○
420 50 5 105,000 31,500 73,500 50 50 3 7,500Failure scale data
Dam Topographical/geological data Geolo- gical-time Site num-ber Water front Rock type (m) Width a. Failure Total Slope length Slope Depth (m) ・・・・・ Failure enlargement sediment vol(m3) (m) (m) (m) (m) Width Depth
b. Likely sediment volume from future enlargement of failures ①Failure sediment volume(m3) Opposite dip
×
Dip slope○ Residual part ② Outflow part (①-②) length colliding 0 2 4 6 8 10 12 14 ~20 40~6080~100120~140160~180200~ 0 20 40 60 80 100 colliding fronts 崩壊斜面の 水衝部の該当数 左岸 水衝部の該当数 右岸 水衝部の該当数 水衝部該当率(右岸) Left bankProportion of failures located in water colliding fronts Right bank N ou m ber o f t he sl ope fa ilur e
Width of slope failure, m ~2040 ~60 80 ~100 120 ~140 160 ~180 200~ Pr opor tion of f ai lur es lo cat ed w ate r c ol lid in g fro nt s % 0 2 4 6 8 10 12 14 20 40 60 80 0 100 N um be r of th e sl op e fa ilur es
Water colliding fronts located in slope failures (%) W ate r c olli di ng fro nt s lo ca te d in s lo pe fa ilu re s (%)
Figure 4. Examples of slope failures identified in survey (Tsukabaru Dam basin).
Figure 5. Relationship between scale of failure, right and left banks, and water colliding fronts located in slope failures.
3.2 Failure mechanism
As part of a wide-area slope failure survey, in particular, for each location on the peripheries of Yamasubaru, Tsukabaru, Iwayado and Kamishiiba dam-regulating reservoirs where large-scale slope failures occurred, boring and other detailed geological surveys, together with seepage flow and other analyses for reproduction calculations were conducted. And through these, the failure mechanism (predisposing factors, contributing factors) was then analyzed (Yoshitake, 2009) (Figure 7).
3.2.1 Analysis of predisposing factors
As a result of detailed surveys, it was found that there had been thickly distributed colluvial deposits on most slopes that had been subject to large-scale slope failure. The principle predisposing factor of large-scale slope failure was thus clarified. (Yoshitake, 2009)
3.2.2 Analysis of contributing factors
Reproduction analysis of failure phenomena (seepage flow analysis and stability calculations) based on geological information obtained, were carried out. And as a result, a process in which saturation progressed from the surface layers of thick colluvial deposits to bring about the
occurrence of slope failure was reproduced, and it was found that the effect of rising ground water levels was small. In this way it was clarified that the main cause of large-scale slope failures was saturation resulting from slope surface layers (Yoshitake, 2009). In addition, as shown in Figure 5, many of the large-scale slope failures in the river basin occurred in the river’s water colliding fronts. It is therefore considered that river bank (slope lower periphery) erosion due the effect of flooding during the typhoon was one contributing factor.
3.3 Level of rainfall causing failure
The relationship between rainfall (flooding) and slope failures in Mimikawa River Basin was analyzed as follows.
3.3.1 Relationship between slope failures and rainfall based on past disaster records
Figure 8 shows the relationship between the record of previous slope failures in the river basin and maximum rainfall in a 2-day period (Miyazaki Prefecture, 1998-2008). This was used to understand the level of rainfall causing failures. From this figure, it can be understood that when total rainfall (maximum rainfall in a 2-day period) exceeds a 500 to 600mm level, there is a sharp increase in the number of locations where slope failures occur. And it can be inferred for this river basin that the quantity of sediment that flows into the river begins to increase at this level of rainfall.
Figure 7. Failure mechanism [schema](Yoshitake, 2009).
A-B-Heavy
rainfall
Rainwater inflow Thickly deposited colluvial soil Bedrock RoadHeavy
flooding
Rise in groundwaterSurface saturation due to rainfall penetration
Peripheral erosion Failure 0 10 20 30 40 50 60 70 80 90 0 100 200 300 400 500 600 700 800 90 最大2日雨量( ) 崩 壊箇所数 椎葉村 諸塚村 美郷町
Shiiba Village
Morotsuka Village
Misato Town
Data: 1998 to 2008
10 0 20 30 40 50 60 70 80 90 0 100 200 300 400 500 600 700 800 900 № of f ail ur e lo ca tio nMax. rainfall in 2-day period, mm
Figure 8. Relationship between number of failurelocations by administrative district for previous slope failures and rainfall.
100m Road
(c)Step landform
(g)Convex slope
Road (a)Scarp landform (f)Typhoon No. 14 failure
(b)Linear valley
(f)Typhoon No. 14 failure
Before Typhoon No. 14 (1985) After Typhoon No. 14 (Oct 2005) (d)Gentle slope
Figure 6. Comparison of aerial photographs taken before and after Yamasubaru Dam slope failure. Photographed by Asia Air Survey Co., Ltd.
Saigaou Dam Saigou PS Yamasubaru PS Yamasubaru Dam Tsukabaru Dam Morotsuka PS Tsukabaru PS IwayadoPS Iwayado Dam Kamishiiba PS Morotsuka Dam Kamishiiba Dam
9/6 6:00 Debris flow Yakariuchi area
9/6 10:09 Debris flow immediately downstream of Kamishiiba PS
9/6 8:15 Slope failure Koba area
9/6 12:00 Debris flow Nojitanigawa River
9/7 00:00 Slope failure Tsukabaru Dam regulating reservoir
Slope failure Debris flow 9/6 7:30 Debris flow central
area of Kamishiiba
【Large-scale slope failure / water colliding front】
【Large-scale slope failure / water colliding front】
Oouchibaru Dam・PS
9/6 10:00 Slope failure right bank upstream of Iwayado Dam 9/6 10:00 Slope failure Kamishiiba
PS access road
9/6 21:30 Slope failure Nonoo
9/6 10:00 Slope failure Kamishiiba
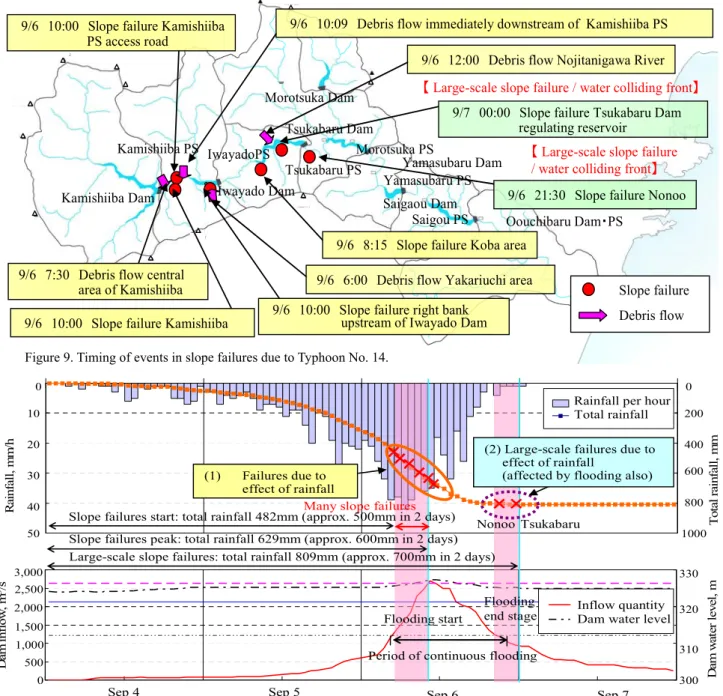
Figure 9. Timing of events in slope failures due to Typhoon No. 14.
Figure 10. Relationship between rainfall, flooding and slope failures due to Typhoon No,14 (Hydrograph for Iwayado Dam)
3.3.2 Relationship between failures that occurred during Typhoon No. 14 and rainfall (flooding)
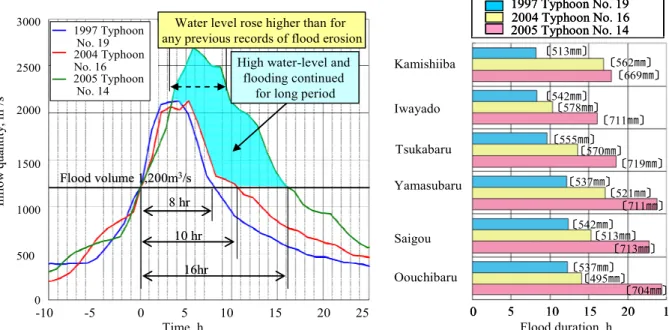
To understand the stages in which slope failures due to Typhoon No. 14 occurred, interviews with local residents, as well as collections of dam operation records and distribution line failure records were conducted to determine the timing of slope failure events, as shown in Figure 9. Figure 10 shows a hydrograph for Iwayado Dam, and timing of slope failure events. From this information, it was ascertained that small to medium-scale slope failure events began to occur when total rainfall reached a level of 500mm, and became frequent at peak rainfall intensity when total rainfall reached a level of 600mm. This result matches that shown in Figure 8, i.e. when total rainfall reached the range 500 to 600mm, there was a sudden increase in slope failures.
By contrast, large-scale slope failures, those for which volume of slipped soil exceeded one million m3, occurred after peak rainfall intensity had past and total rainfall had reached a level of 800mm (700mm in a 2-day period). It was
observed that flooding due to Typhoon No. 14 was the largest ever experienced, and water levels rose to the highest levels since dam construction. Also, the period of continuous flooding was much (1.5 to 2 times) longer than for previous large-scale flooding (Figure 11). Further, most large-scale slope failures were located on water colliding fronts where slope peripheries are susceptible to erosion, and it is inferred that in addition to the effect of rainfall scale, these failures were also significantly affected by flooding.
3.3.3 Types of slope failure
From the above, slope failures occurring in the Mimikawa River Basin can be broadly divided into two types, which can be considered to be triggered by different levels of rainfall, and which are affected by different predisposing and contributory factors (Table 2).
9月4日 9月5日 9月6日 9月7日 時間 雨量( m m ) 累計雨 量( m m ) ダ ム 流入 量 (m 3 /s ) ダ ム 水 位 (m) 0 10 20 30 40 50 0 200 400 600 800 1000 時間雨量 累計雨量 -500 1,000 1,500 2,000 2,500 3,000 300 310 320 330 流入量 貯水位 0
Many slope failures
××
Nonoo Tsukabaru (1) Failures due to effect of rainfall
×
×
×
×
×
×
Slope failures peak: total rainfall 629mm (approx. 600mm in 2 days) Large-scale slope failures: total rainfall 809mm (approx. 700mm in 2 days)
Period of continuous flooding Flooding start
Flooding end stage
Sep 4 Sep 5 Sep 6 Sep 7
D am w at er le ve l, m
Slope failures start: total rainfall 482mm (approx. 500mm in 2 days)
(2) Large-scale failures due to effect of rainfall
(affected by flooding also)
Dam water level Inflow quantity Rainfall per hour Total rainfall 300 310 320 330 50 40 30 20 10 0 R ain fa ll, m m /h 1000 800 600 400 200 0 T ota l ra in fa ll , m m 500 1,000 1,500 2,000 2,500 0 3,000 Da m in fl ow , m 3/s 9月4日 9月5日 9月6日 9月7日 時間 雨量( m m ) 累計雨 量( m m ) ダ ム 流入 量 (m 3 /s ) ダ ム 水 位 (m) 0 10 20 30 40 50 0 200 400 600 800 1000 時間雨量 累計雨量 -500 1,000 1,500 2,000 2,500 3,000 300 310 320 330 流入量 貯水位 0
Many slope failures
××
Nonoo Tsukabaru (1) Failures due to effect of rainfall
×
×
×
×
×
×
Slope failures peak: total rainfall 629mm (approx. 600mm in 2 days) Large-scale slope failures: total rainfall 809mm (approx. 700mm in 2 days)
Period of continuous flooding Flooding start
Flooding end stage
Sep 4 Sep 5 Sep 6 Sep 7
D am w at er le ve l, m
Slope failures start: total rainfall 482mm (approx. 500mm in 2 days)
(2) Large-scale failures due to effect of rainfall
(affected by flooding also)
Dam water level Inflow quantity Rainfall per hour Total rainfall 300 310 320 330 50 40 30 20 10 0 R ain fa ll, m m /h 1000 800 600 400 200 0 T ota l ra in fa ll , m m 500 1,000 1,500 2,000 2,500 0 3,000 Da m in fl ow , m 3/s
3.4 Summary of slope failure characteristics
A summary of slope failure characteristics occurring in the Mimikawa River Basin understood from this study is given in Table 3.
Failure location and scale
Large scale failures occur on right bank (dip slope)
Failed slopes have specific geomorphic elements
Failure mechanism
Predisposing factor: thickly distributed colluvial deposits on slopes
Contributing factors: saturation of slope surface layers due to rainfall; erosion of slope peripheries due to flooding
Failure rainfall
Rainfall level giving rise to failures can be classified into 2 levels
Failure due to effect of rainfall: 500 to 600mm
Large-scale failure due to effect of flooding, in addition to effect of rainfall: 700mm
4.
WIDE-AREA SLOPE FAILURE PREDICTION
By using the results above, a simplified method for wide-area slope failure prediction based on the characteristics of slope failures in the Mimikawa River Basin was structured. Further, a broad classification of “location (slopes in which locations will fail)” and “probabilities of slope failure (with what level of rainfall will there be failures)” was made, and a study carried out.
4.1
Identification of slopes that have possibility of
future failure
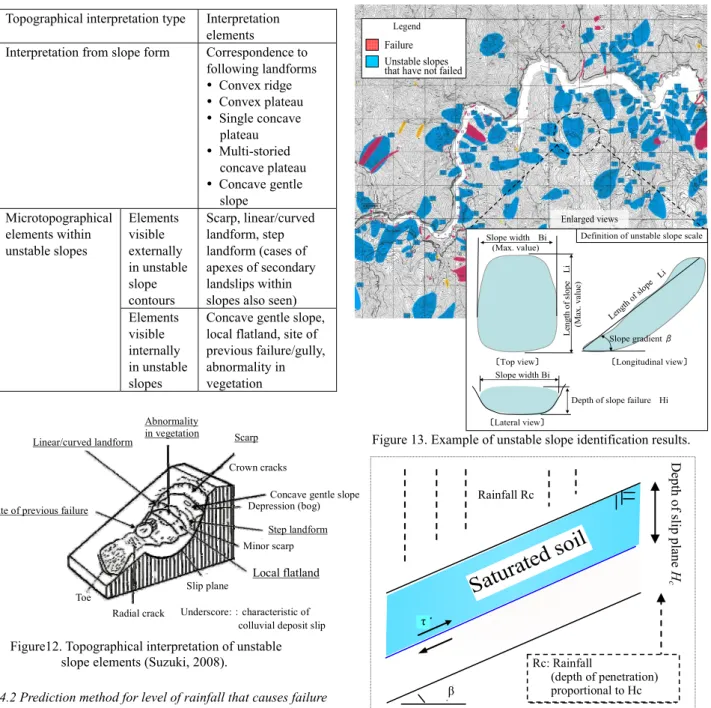
As noted above, failed slopes have characteristic geomorphic elements. Therefore, through interpretation of these elements in aerial photographs and topographic maps, it was decided to identify slopes having the possibility of future failure (referred to below as unstable slopes). This method is used in surveys to select suitable sites for dam construction.
In this study, two approaches: (1) “identification of slope contours corresponding to landslide morphology” and (2) “reading of microtopographical elements visible within a slope” were used to interpret which slopes were unstable. Figure 12 shows the elements used to interpret whether or not slopes were unstable. During interpretation, along with microtopographical elements corresponding to unstable slopes shown in the table section of Figure 12, note was also taken of peripheral land forms such as slope transform points (convex/concave knick lines), lineaments, abnormalities in rivers and streams (abnormalities in current direction, curvature, etc.), mountaintop and mountainside flatland, and linear depressions.
As a result of interpretation work focused mainly on areas alongside the mainstream and tributaries of Mimikawa River, unstable slopes in 353 locations were identified (Figure 13). And following the format of Table 1, information on each slope, such as slope scale (width, depth, length and potential failure soil volume) as well as topographical and geological data was organized.
Type of slope failure (Contributing factor) Level of rainfall causing failure (1) Slope failure due to effect of rainfall
Main contributing factor: process of saturation within slopes (up to the vicinity of slip planes) due to rainfall penetration from slope surface layers
500 to 600mm
(2) Large-scale slope failure due to effects of rainfall and flooding
Main contributing factors: combined effects of saturation due to rainfall penetration referred to in (1) above, and river bank erosion due to flooding
700mm level
Table 3. Slope failure characteristics (summary)
Flood duration, h 1997 Typhoon No. 19 2004 Typhoon No. 16 2005 Typhoon No. 14 Kamishiiba Iwayado Tsukabaru Yamasubaru Saigou Oouchibaru 〔513㎜〕 〔562㎜〕 〔669㎜〕 〔542㎜〕 〔578㎜〕 〔711㎜〕 〔555㎜〕 〔570㎜〕 〔719㎜〕 〔537㎜〕 〔521㎜〕 〔711㎜〕 〔542㎜〕 〔513㎜〕 〔713㎜〕 〔537㎜〕 〔495㎜〕 〔704㎜〕 0 5 10 15 20 1 Time, h Flood volume 1,200m3/s 8 hr 10 hr 16hr
Water level rose higher than for any previous records of flood erosion
-10 -5 0 5 10 15 20 25
High water-level and flooding continued
for long period 1997 Typhoon No. 19 2004 Typhoon No. 16 2005 Typhoon No. 14 0 500 2500 3000 1000 1500 2000 In fl ow qu an tit y, m 3/s Flood duration, h 1997 Typhoon No. 19 2004 Typhoon No. 16 2005 Typhoon No. 14 Kamishiiba Iwayado Tsukabaru Yamasubaru Saigou Oouchibaru 〔513㎜〕 〔562㎜〕 〔669㎜〕 〔542㎜〕 〔578㎜〕 〔711㎜〕 〔555㎜〕 〔570㎜〕 〔719㎜〕 〔537㎜〕 〔521㎜〕 〔711㎜〕 〔542㎜〕 〔513㎜〕 〔713㎜〕 〔537㎜〕 〔495㎜〕 〔704㎜〕 0 5 10 15 20 1 Flood duration, h 1997 Typhoon No. 19 2004 Typhoon No. 16 2005 Typhoon No. 14 Kamishiiba Iwayado Tsukabaru Yamasubaru Saigou Oouchibaru 〔513㎜〕 〔562㎜〕 〔669㎜〕 〔542㎜〕 〔578㎜〕 〔711㎜〕 〔555㎜〕 〔570㎜〕 〔719㎜〕 〔537㎜〕 〔521㎜〕 〔711㎜〕 〔542㎜〕 〔513㎜〕 〔713㎜〕 〔537㎜〕 〔495㎜〕 〔704㎜〕 0 5 10 15 20 1 Time, h Flood volume 1,200m3/s 8 hr 10 hr 16hr
Water level rose higher than for any previous records of flood erosion
-10 -5 0 5 10 15 20 25
High water-level and flooding continued
for long period 1997 Typhoon No. 19 2004 Typhoon No. 16 2005 Typhoon No. 14 0 500 2500 3000 1000 1500 2000 In fl ow qu an tit y, m 3/s Time, h Flood volume 1,200m3/s 8 hr 10 hr 16hr
Water level rose higher than for any previous records of flood erosion
-10 -5 0 5 10 15 20 25
High water-level and flooding continued
for long period 1997 Typhoon No. 19 2004 Typhoon No. 16 2005 Typhoon No. 14 0 500 2500 3000 1000 1500 2000 In fl ow qu an tit y, m 3/s
Figure 11. Comparison between Typhoon No. 14 flooding and previous large-scale flooding
Figure12. Topographical interpretation of unstable slope elements (Suzuki, 2008).
Topographical interpretation type Interpretation elements
Interpretation from slope form Correspondence to following landforms Convex ridge Convex plateau Single concave plateau Multi-storied concave plateau Concave gentle slope Microtopographical elements within unstable slopes Elements visible externally in unstable slope contours Scarp, linear/curved landform, step landform (cases of apexes of secondary landslips within slopes also seen) Elements
visible internally in unstable slopes
Concave gentle slope, local flatland, site of previous failure/gully, abnormality in vegetation
4.2 Prediction method for level of rainfall that causes failure of identified slopes
4.2.1 Numerical model
In this study, for each unstable slope a prediction on failure was made, with the prediction being based on rainfall in a 2-day period (referred to below as predicted failure rainfall Rc). This was done after taking into consideration the following 2 characteristics. Firstly, based on past records, slope failures in the Mimikawa River Basin have a strong correlation with prolonged rainfall (Miyazaki Prefecture, 1998-2008). Secondly, in the phenomenon of sediment failures induced by sedimentary rock, the effect of increase in level of saturation due to rainfall penetration is very significant, and further it takes time for rainfall to penetrate (JSCE, 2006).
In the calculation of predicted failure rainfall, reproduction of failure was carried out for each unstable slope using a slope stability calculation model that assumes an infinite length of slope, as shown in Figure 14. The slope
stability equation (1), and the relational equation between rainfall and penetration (2), were applied in the calculation. The failed soil volume was calculated using equation (3).
(1)
(2)
(3)
where Fs is safety ratio (Fs=1), ci is cohesion (kN/m2), φi is internal friction angle (°), γsat is saturated weight (kN/m3), γw is weight of water (kN/m3), βi is slope gradient (°), Rci is predicted failure rainfall (mm), hci is rainfall penetration (m),
Hci is predicted depth of failure slip plane (m), i is unstable
i i ci sat i i ci w sat i s H H c F
sin cos tan cos ) ( 2 j ci j ci j ci H H h h R R Linear/curved landform Crown cracksConcave gentle slope Depression (bog)
Step landform Minor scarp
Radial crack Toe
Site of previous failure
Slip plane
Local flatland Underscore::characteristic of
colluvial deposit slip Abnormality in vegetation Scarp i i i i B L H V
τ
表
層
飽
和
β
すべり
深
さ
Hc
雨量 Rc
Rc:雨量(浸透深さ)
に比例
Rainfall Rc τ β Rc: Rainfall (depth of penetration) proportional to HcSatu
rate
d so
il
D epth o f s lip p lan e H cFigure 14. Numerical model schema.
Figure 13. Example of unstable slope identification results.
Unstable slopes that have not failed
Legend Enlarged views L ength of slope Li Slope width Bi Slope gradient β 〔Top view〕 〔Longitudinal view〕 (Max. value) (M ax . v alu e) Leng th of slop e Li 〔Lateral view〕
Depth of slope failure Hi Slope width Bi
Definition of unstable slope scale
slope number (i=1 to 353), Rj is level of rainfall at time past slope failures occurred (mm), hj is rainfall penetration at time of past slope failures (m), Hj is depth of slope failure slip plane at time of past slope failures, and j is past slope failure assumed to be similar to failure that would occur on unstable slope i. Vj is failed soil volume of unstable slope i (m3), Bi is width of unstable slope i (m) (refer Figure 13), and Li is length of unstable slope i (m) (refer Figure 13).
Equation (1) is for a model in which colluvial deposits are thickly distributed on slopes, and assumes that saturation due to rainfall progresses from surface layers one-dimensionally. Since full reproduction of the extremely complex slope failure phenomenon in wide areas is very difficult, the model was simplified by assuming that saturation due to rainfall penetration from slope surface layers was the main cause of slope failures. In this regard, to simplify the model, effects other than the main cause of slope failures (saturation due to rainfall penetration from slope surface layers), such as changes in degree of saturation due to changes in reservoir level, and reactive force due to weight of water, were not considered. However, the effect due to erosion was reflected in the physical properties, as described later.
Equation (2) indicates that rainfall, rainfall penetration and depth of slip plane have a proportional relationship to each other. In this study, through application of equation (2), the relationship of rainfall and rainfall penetration (depth of slip plane) were predicted. When applying equation (2) to predict possible failure of a particular unstable slope, records for rainfall and rainfall penetration (depth of slip plane) for similar past slope failures were used. This proportional relationship was derived from the following previous research. Firstly, according to one previous report (Cheng, 2006), using the Green and Ampt model, on the condition that water is supplied constantly from the ground surface, and that one-dimensional vertical penetration is applied to a uniform soil, there is a proportional relationship between rainfall and seepage line depth. And, according Mimikawa River Basin past slope failure records, the occurrence of slope failures is
due to a constant supply of water from rain over a long period, rather than rain over a short period (Miyazaki Prefecture, 1998-2008). And further, colluvial deposits are thickly distributed in this area. In view of these points, this proportional relationship was adopted. Secondly, in the vicinity of seepage lines (depth of rainfall penetration) shear deformation (slip plane) occurs due to penetration of rainfall (Sasahara, 1999). According to the slope failure survey noted above, slip planes formed in the vicinity of permeable slopes (Yoshitake, 2009). In view of these points, this proportional relationship is considered applicable to Mimikawa River Basin.
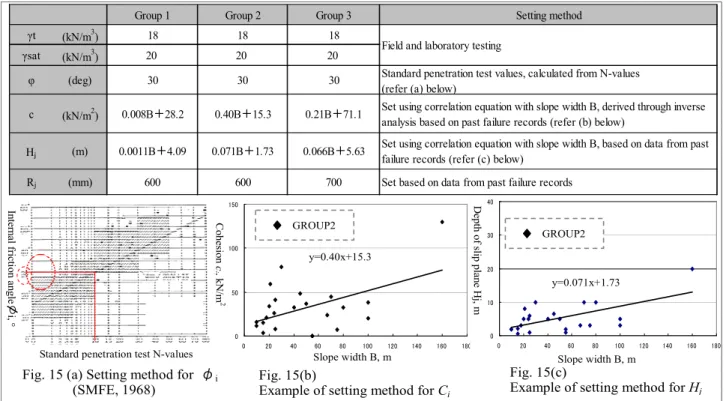
4.2.2 Setting of parameters
Here, the setting of parameters to be used in calculations is explained. To gather data for parameters attributable to subsurface structure, such as soil strength, over a wide area would have been very difficult. Given the situation, it was decided to use not just data (N-values, density testing, etc.) from representative points gathered in the field survey, but also other data such as that from failed slopes over the whole basin (Table 1), to set wide-area parameters that reflect characteristics of the area.
The specific method used for setting parameters is shown in Figure 15. Unit weight γ and internal friction angle φi were calculated from the results of field testing at representative points (N-values), and laboratory testing (RA, 2005; SMFE, 1968). Cohesion ci was calculated through inverse analysis (with φi set at a fixed value and Fs = 1) by reproducing slope failures that had occurred within the basin. Then using the correlation equation with slope width, the value of ci was sought for each unstable slope. The basis for using the correlation equation with slope width is that according to previous research, slope width and depth of slip plane are correlated (Isshiki, 2008), and depth of slip plane and cohesion c are also correlated (JICE, 2010).
In addition, depth of slip plane Hj for Typhoon No. 14 was also calculated from failure records using the correlation
Fig. 15 (a) Setting method for φi
(SMFE, 1968) Fig. 15(b) Example of setting method for Ci
Fig. 15(c)
Example of setting method for Hj
右岸
GROUP2 Slope width B, m Coh es ion c i, k N /m 2 y = 0.0706x + 1.7273 0 10 20 30 40 0 20 40 60 80 100 120 140 160 180 斜面幅B 深さH j( m ) 右岸右岸
Slope width B, m De pt h of s lip p la ne Hj, m GROUP2 y=0.071x+1.73 y = 0.041x + 1.56 0 50 100 150 0 20 40 60 80 100 120 140 160 180Standard penetration test N-values
Int erna l f ric ti on angl e i,
Group 1 Group 2 Group 3 Setting method
γt (kN/m3) 18 18 18
γsat (kN/m3) 20 20 20
φ (deg) 30 30 30 Standard penetration test values, calculated from N-values (refer (a) below)
c (kN/m2) 0.008B+28.2 0.40B+15.3 0.21B+71.1 Set using correlation equation with slope width B, derived through inverse analysis based on past failure records (refer (b) below)
Hj (m) 0.0011B+4.09 0.071B+1.73 0.066B+5.63
Set using correlation equation with slope width B, based on data from past failure records (refer (c) below)
Rj (mm) 600 600 700 Set based on data from past failure records
Field and laboratory testing
y=0.40x+15.3
右岸
GROUP2Group
1 Stratum of opposite dip (left bank)
—
Group
2 Dip slope (right bank) Other than below Group
3 Failure 100m or more in width located in water colliding front
Figure 17. Disaster locations and forms of damage. equation with slope width. In addition, rainfall Rj for when
failures occurred was set by using failure record information (Table 2 ).
In this study, to better reflect the characteristics of slope failures in the Mimikawa River Basin, a group division that best reflected characteristics of the basin was chosen based on findings from the slope failure survey noted above, and for each group parameters were set (Table 4). This group division is indicative of slope failures that occur in the Mimikawa River Basin, which, rather than being influenced by different geological epochs or types of base rock, is strongly influenced by geological structure (dip slope, stratum of opposite dip), and water colliding fronts.
4.3 Results of wide-area slope failure prediction
Following the method above, as shown in Figure 16, slopes for which failure was predicted together with predicted failure rainfall (slope failure risk map) were identified. From the prediction results, it was clarified that with 600mm or more of rain (in 2-day period), both the number of slope failures and failure soil volume showed a tendency towards increase. On the basis of the results, predicted failure soil volume in the case of a typhoon with rainfall reaching the scale of Typhoon No. 14 (700mm: probability 1/100) is approximately 44 million m3. In other words, in the case that there was rainfall on a similar scale to that experienced during Typhoon No. 14 in 2005, the results indicate that there is a risk that the extent of slope failures would be about the same as for Typhoon No. 14.
5. IMAGE OF RISK MANAGEMENT TAKING INTO ACCOUNT CHARACTERISTICS OF
HYDROELECTRIC INSTALLATION
This section presents an image of how the above prediction results could be used for specific hydroelectric installation risk management. While dams, power stations and other installations are scattered over the river basin, the dam-regulating reservoirs and river form an extended line structure. For this reason, as shown in Figure 17, the form of damage to hydroelectric installations at each slope failure location is different. Therefore, in addition to understanding the risk of occurrence, for each location it is necessary to envision different damage scenarios, and determine action levels.
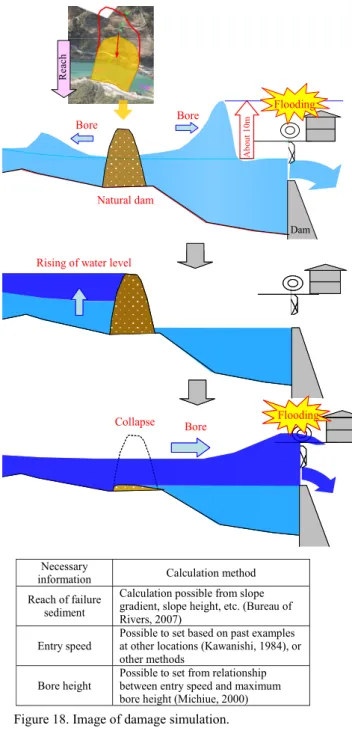
In Figure 18, a specific image envisioned for a slope failure damage scenario for Mimikawa River is presented. The figure shows a schema for a location upstream from a dam. In this example, it is envisioned that a slope at this location fails due rainfall equal to or greater than the predicted failure rainfall, and due to the inflow of sediment, bores occur both upstream and downstream of the inflow, and there is a danger that an installation will be flooded. Subsequently, a natural dam is formed, then with a buildup of
water upstream and the collapse of the natural dam, downstream flooding is envisioned. A number of studies have been carried out on calculation methods for the reach of failure sediment and bore height (Bureau of Rivers, 2007; Kawanishi, 1984; Michiue, 2000). Figure 18 shows just one example.
From the analysis presented above, location and rainfall for the occurrence of future slope failures could be predicted. Table 4. Parameter group division used for parameter setting
Figure 16. Results of slope failure prediction for Tsukabaru Dam (risk map).
Failure rainfall 0 20 40 60 80 100 120 140 500 600 700 800 900 崩壊 土 量 (百 万 ㎥ ) ★:Typhoon No. 14 record
Rainfall in 2-day period, mm ★ 44 million m3 Fa il ure s oil v olu m e, m ill io n m 3 Tsukabaru DAM Rising of riverbed Rising of water level Direct hit Flooding due to surge/submergence Flooding due to rising of riverbed Sedi ment out flow Surge Over topping Residences Control facility Power rainfall Residences Natural dam station Rising of riverbed Rising of water level Direct hit Flooding due to surge/submergence Flooding due to rising of riverbed Sedi ment out flow Surge Over topping Residences Control facility Power rainfall Residences Natural dam station Rising of riverbed Rising of water level Direct hit Flooding due to surge/submergence Flooding due to rising of riverbed Sedi ment out flow Surge Over topping Residences Control facility Power rainfall Residences Natural dam station
Location Form of damage
Point ◆Maintained facilities hit directly
Line Area Maintained environs(dams, power stations) Along main stream
◆Rising of riverbed due to sediment inflow rising of water level, submergence of facilities
◆Flooding in up/downstream basins due to surge with inrush of sediment ◆Flooding in upstream basin due to waterlogging on formation of natural dam
◆Flooding in downstream basin due to surge on collapse of natural dam ◆Rising of riverbed with inflow of sediment from mountainous areas (tributaries) rising of river water level(flooding damage), submergence of facilities Mountainous
areas, tributaries
And for each location, the effect of measures to maintain integrity could be evaluated in advance. On the basis of such information, in relation to the operation of dams, it is anticipated that it will be possible to clarify risk management at the time of large-scale flooding, and also the effects of investment in, and order of priority for facility installation and maintenance.
6. CONCLUSIONS
This study set out to clarify the characteristics of slope failure in the Mimikawa River Basin, and by using the results obtained, make simplified predictions of future slope failures.
Concerning the understanding gained about characteristics of slope failures in the Mimikawa River Basin, based on information such as records of slope failures, the characteristics of locations where failures could easily occur, predisposing and contributing factors, as well as the level of rainfall that brings about the occurrence of failures were
clarified. Slope disasters are infrequent, so the findings on locations where they occur are extremely valuable information, and it is anticipated that this will form a base for various future studies on slope disasters.
Furthermore, by clarifying the characteristics of past slope failures in the Mimikawa River Basin, a method for wide-area slope failure prediction using a simplification of the complex slope failure phenomenon was structured. As a result, slopes for which failure was predicted together with predicted level of failure rainfall (slope failure risk map) were identified. One example of a specific method for use of a hydroelectric installation risk map was also considered. Issues to be tackled include incorporation into the prediction model of improved prediction accuracy in the rainfall penetration process, change in degree of saturation due to changes in reservoir level, and the effects of reactive force and erosion due to the weight of water. It is also necessary to verify physical properties such as cohesion c.
REFERENCES
Bureau of Rivers, Ministry of Construction, 2007. Design for Slope Failure Preventative Works, and their Actual Cases, pp.234-244. Cheng Qiu, 2006. Development of a GIS-based 3D Deterministic
Methodology for Spatio-temporal Assessment of Landslide Hazard, Environmental Geology, 240, pp.118-121
Isshiki H, 2008. Study on form and scale of landslides in Chichibu terrain soil, Proceedings of Japan Society of Engineering Geology, p.11
Japanese Geotechnical Society, 2006. Slope failure mechanism during intense rainfall and hazard prediction, Maruzen, pp.73-151
Japan Institute of Country-ology and Engineering, 2010. Surveys and measures about landslides in the vicinity of dam-regulating reservoirs, Kokinshyoin, pp4-8
Japan Road Association (JRA), 2005. Guidelines for slope protection and slope stabilization, Earthworks, p348
JSCE Typhoon No.14 Investigation Team, 2006. Research on Disasters due to Typhoon No.14 Rainfalls, and Study on Measures to Reduce Disasters, p99
Kawanishi M, 1984. Reservoir Water Level Fluctuation due to Landslides, Proceedings of the Japanese Conference on Hydraulics, No28, pp.819-826.
Michiue M, 2000. Numerical Analysis Considering Effects of Failed Soil Mass, Abstracts on Announcement Meeting for Research, Japan Society of Civil Engineering, Chugoku Regional Branch Office, No.52, pp.113-114 .
MITI Agency of Industrial Science and Technology, 1995. Geological Survey, Geologic Atlas of Japan Kyushu, p7
Miyazaki Prefecture, 1998-2008. Miyazaki Prefecture Record of Disasters, p.190
Sasahara K, 1999. Analysis of Shear Deformation of Steeply-inclined Sandy Soil Slops due to Rainfall Penetration, Landslide, Vol. 36 No.1, p12-19
Soil Mechanics and Foundation Engineering (SMFE), 1968. Soil Survey Results and Applicable Cases, Soil Mechanics and Foundation Engineering Library, 4, p58
Suzuki, R, 2007. Introduction to Reading of Topographical Maps for Architect Engineers, Kokonshoin, pp.557-866.
Yoshitake, H. et al, 2009. Study on Slope Structure and Collapse Mechanism of Large-scale Slope Failure. JGS Symposium No.144, Symposium on Slope Failure Mechanism against Rainfall and Earthquake; and Stability Evaluation, pp.265-Necessary
information Calculation method Reach of failure
sediment
Calculation possible from slope gradient, slope height, etc. (Bureau of Rivers, 2007)
Entry speed Possible to set based on past examples at other locations (Kawanishi, 1984), or other methods
Bore height Possible to set from relationship between entry speed and maximum bore height (Michiue, 2000) Bore Re ac h Bore Flooding Abo ut 10 m Dam Flooding Collapse Bore
Rising of water level Natural dam