JAIST Repository: 日本と中国の大学機能の比較と評価
63
0
0
全文
(2) 修 士 論 文. 日本と中国の大学機能の比較と評価. 指導教官 Gu Jifa 教授. 北陸先端科学技術大学院大学 知識科学研究科知識社会システム学専攻. 950096 山本 明久. 審査委員: Gu Jifa 教授(主査) 吉田 武稔 助教授 本多 卓也 教授. 2001 年 2 月. Copyright _ 2001 by Akihisa Yamamoto.
(3) Master thesis. Comparison and Evaluation of Performance of Universities in both Japan and China Adviser: Professor Jifa Gu. Department of Social Knowledge Science School of Knowledge Science Japan Advanced Institute of Science and Technology Student Number: 950096 Akihisa Yamamoto Thesis committee: Professor Jifa Gu Associate Professor Taketoshi Yoshida Professor Takuya Honda February 2001. Copyright _ 2001 by Akihisa Yamamoto.
(4) Contents Chapter 1. I. n. t. r. o. d. u. c. t. i. o. n. 1 1.1. The backgrounds. 1. 1.2 1.3. Purpose WSR systems approach in the evaluation of the University. 3 4. 1.3.1 The concept of Wuli. 4. 1.3.2 The concept of Shili. 5. 1.3.3 The concept of Renli. ...6. 1.4. The evaluation methods. 6. 1.5. The characteristic of this thesis. 7. Chapter 2. E v a l u a t i o n o f u n i v e r s i t y o f C h i n a 9 2.1. 2.2. Evaluation index and the score of university in principal component analysis 2.1.1 An explanation in Wuli layer. 9. 2.1.2 An explanation in Shili layer. 11. 2.1.3 An explanation in Renli layer. 15. The ordinal solution. 16. Chapter 3. E v a l u a t i o n o f u n i v e r s i t y o f J a p a n 2 0 3.1. 3.2. Evaluation index and the score of university in principal component analysis 3.1.1 An explanation in Wuli layer. 20. 3.1.2 An explanation in Shili layer. 22. 3.1.3 An explanation in Renli layer. 26. The ordinal solution. 27. Chapter 4. Comparison of the universities in both Japan and China 30 4.1 4.2 4.3. General comparison in both Japan and China SCI and CA A study of the evaluation of universities in USA. 30 34 41. Chapter 5. C o n c l u s i o n s a n d f u t u r e d i r e c t i o n s 4 2 5.1 5.2. A. c. Conclusions Future directions. k. n. o. 42 43. w. l. e. i. d. g. e. m. e. n. t.
(5) 4 R 4 P 4 S 4. e u. f b. u. l p. e i. s. r h. p. l. e e. n. d e. c. p m. a. e p. e. n. e. r t. 4 s 5 s 7 s 8. List of Figures Chapter 2. Evaluation of university of China 2.1 the results of principal component analysis in Wuli layer of China 2.2 the score of each university in Wuli layer of China 2.3 the efficiency of human production in Shili layer of China 2.4 the efficiency of investment in Shili layer of China. 9 11 12 13. 2.5 the score of production efficiency of each university 2.6 the score of investment efficiency of each university. 14 15. 2 . 7. t h e. t o l e r a t e. s o l u t i o n i n 1 2.8 the tolerate solution in Shili layer (Investment efficiency) 2.9 the tolerate solution in Shili layer (human efficiency) 3.0 the ordinal solution (total of Wuli and Shili layer). W u l i. l a y e r 7 17 18 18. 3.1 the results of principal component analysis in Wuli layer of Japan 3.2 the score of each university in Wuli layer of Japan 3.3 the efficiency of human production in Shili layer of Japan 3.4 the efficiency of investment in Shili layer of Japan 3.5 the score of production efficiency of each university 3.6 the score of investment efficiency of each university 3 . 7 t h e t o l e r a t e s o l u t i o n i n W u l i 2 3.8 the tolerate solution in Shili layer (Investment efficiency) 3.9 the tolerate solution in Shili layer (human efficiency) 4.0 the ordinal solution (total of Wuli and Shili layer). 21 22 23 24 25 26 l a y e r 7 28 28 29. Chapter 3. Evaluation of university of Japan. Chapter 4. Comparison of the universities in both Japan and China. ii.
(6) 4.1 the correlation figure between student and teacher in 1998. 32. 4.2 comparison of financial resources in 1998 4.3 comparison of financial resource per teacher in 1998. 33 33. 4.4 the time-series data of CA and SCI 4.5 comparison of database of CA and SCI in each country (1997). 34 35. 4.6 comparison of database of CA and SCI in 9 countries (1997) 4.7 the correlation between Number of researchers and papers. 36 40. 4.8 the correlation between Financial resources and number of papers. 40. List of Tables Chapter 1. Introduction 1.1 1.2 1.3 1.4. An example of mixed comparison in Shili layer WSR system approach in evaluation index of university The characteristic of this thesis The role of WSR system approach. 5 6 7 8. Chapter 2. Evaluation of university of China 2.1 2.2. Number of stars University ranking of China by WSR system approach. 16 19. Chapter 3. Evaluation of university of Japan 3.1. University ranking of Japan by WSR system approach. 29. Chapter 4. Comparison of the universities in both Japan and China 4.1 4.2 4.3 4.4 4.5 4.6. General comparison the student and teacher in 1997 The progression rate in 1997 Comparison of the paper citied in SCI (In 1998) Ranking of the total paper citied in CA (1998) Ranking of English paper citied in CA (1998) The efficiency of human resources and investment in CA. 30 31 37 38 39 41. Chapter 5. Conclusions and future directions 5.1. The culture comparison. 42. iii.
(7) Chapter 1. Introduction. Chapter 1. Introduction. 1.1 The background The evaluation of university is a hot topic in USA, UK, Japan, China etc and many organizations have different opinions and approaches to do this work recently years. Because the education system in each country isn t same, so the university evaluation and comparison in different countries is very difficult. Some organizations had tried to evaluate the university crossing the borders, but the approach wasn t successful. For example, the magazine of Asiaweek in Hong Kong and Lincoln business administration consulting Inc. in Taiwan carried out the list of the best Asian universities recently years [13]. Despite they judged five categories, 35 famous universities in Asia were missed. When we focus on the university of Japan, Tokyo University was missed; there are 19 Universities of China were missed in that ranking even Tsinghua University and Peking University, so we couldn t make the status of each University clear without the Key Universities by this ranking. On the other side, Lincoln s ranking pay much attention on the Oceania and Southeast Asia. In ranking of best 35 universities, they only put six universities of East Asia in it. It maybe most of users (students) live in Taiwan, therefore, the ranking is a standard for studying abroad. At first, the situation of evaluation of university in Japan is shown as following; Diamond Weekly (a weekly magazine of Japan) sent the questionnaire tables to the personnel section of companies every spring that they ranked the useful universities [5]. The ranking of the directors, administrators and presidents in each university was carried out. Moreover, The statistics of numbers of the boards in venture companies (established after 1997) is published by them. Another weekly magazine of Weekly Toyo Keizai had an investigation, which surveyed the balance sheet of private universities, the variations of the applicants, number of computers, number of computers with connected Internet and the rate of employments in strong company [6]. Both those approaches emphasized on the social activity of the students, and some statistics data reflected that how many students would be active on social activity in future. Because most of students will work in the company, so the key point means whether the user (students) can get a good job or acquire the skill after graduation. In special, the private universities have many students, but the needs of basic research are low and vacancies of the faculties are few, so most of them didn t emphasize on the. -1-.
(8) Chapter 1. Introduction. research activities too much. On the other side, the capacity of student in national university is much lower than private one; moreover, the financial resources were higher than private university. It means that the research environment in national university is generally better than private one. Not only the situation was different in both private university and national university, but also the point view wasn t same to the database of papers. Science Citation Index (SCI) is a famous database of science and technology in the world, but some researchers pointed out that this database has many defects. For example, professor S.Ueda and T.Honda used the database of Chemical Abstracts (CA) instead of SCI in counting the number of papers, professor K.Seki pay attention to the number of paper citied in Nature, professor K.Ueno published the Social Science Citation Index (SSCI) ranking, etc [3]. Therefore, the paper citied in SCI isn t best database now. S.Ueda and T.Honda also pointed out that we need to pay attention to the research works, which were wrote by native language (as Japanese or Chinese). We also can evaluate our research by the rate of English paper that not only it gives us the point-view of degree of internationalization, but also it can show the amount of whole research works for us. A book of University ranking 2000 published more 30 evaluation items [3]. On the other hands, it suggests that we need to have a multi-factor view for evaluating university, that is, evaluation of university is a multi-factor evaluation problem. Next, the situation of evaluation of university in China is shown as following; There are many approaches to evaluate the universities in China. A newspaper of Science Times published the statistics results of science and technology papers of China in 1998. The main items are SCI, EI (Engineering Index) and ISTP (Index to Science & Technology Proceedings), and the frequency of the paper cited by others also carried out, but this paper hadn t mentioned the detail of the frequency of the paper cited by others. It only gives us the physical data, so we assumed that this is a kind of data resources for evaluating the university. Now, the university ranking by Netbig is being disputed in China [14]. We often find the extreme dispute news on the media; For example, some educators related to Sichuan University, Zhongshan University and South China University of Technology etc discontented the ranking of Netbig . The worse case was happened in this summer, some students of Renmin University of China charged Netbig , the reason is that the ranking of Renmin University of China is unfair [16]. Receiving these repercussions, some sections of government concerned with education were published the opinions and the national university ranking was carried out by the net site of uniranks.edu.cn . uniranks.edu.cn was established by Department of S & T of the Ministry of Education P.R.C, the Development Center of S. -2-.
(9) Chapter 1. Introduction. & T (an organization of the Ministry of Education P.R.C) and Beijing Thinking development of Science and Technology net co., Ltd. China Education Daily Online (a newspaper of China) had an interview to Department of Science and Technology of the Ministry of Education P.R.C for evaluation of university on June 8, 2000 [15]. The person in charge of accounts said that they already established the evaluation system of university in basis. Moreover, they assumed that the method of weight sum improper, so they published the single index ranking only. They will put number of papers (SCI etc), the frequency of the paper cited by others, the number of projects of government, local or company etc, the prize and effect of economics etc on the net. They also will announce the direction of establishment of department (IT etc) and the rate between number of graduated students and the number of vacancies [15].. 1.2 Purpose Responding to the change of times and the needs of labor market, the university reform will become an important policy. The ordinary Diet in next year will name Education Diet by the president Yoshirou.Mori. Needless to say, the role of university is significant and the quantitative evaluation of science and technology is request by the society. In China, the market became big with implementing a reform and an open economic policy recently years, but outflow of talented person to foreign countries probably become a trigger of short hands in internal talented person. For ensuring the talented person, it needs to reform the education system and set forth a new policy [17]. Although the education situations are different in Japan and China, but both two countries just wish reform the university. For reforming university, we need to compare and evaluate each university at first. The works of qualitative evaluation of university were carried out by some researchers yet; however, it has a trend that the combined quantitative and qualitative evaluation of university were appeared by the development of scientometrics recently [9]. About quantitative evaluation of university, if we emphasized one country only, then we couldn t catch the essences of the cultural factor in the university such as a frog in a well. Hence, the international comparison of university can make us to understand the situation of university more clear. In this thesis, we focus on the university of Japan and China, that is, both two countries have a similar culture and belong the East Asia area. Some researchers in. -3-.
(10) Chapter 1. Introduction. China pointed out that the evaluation method of Western or US isn t suitable to the Eastern. For example, the rank of university had done by Asiaweek. Furthermore, some Japanese researchers dislike the database of SCI, because this database is unfair for Eastern countries. By those reasons, we need to create the evaluation system of university which has gotten Eastern characteristic. WSR systems methodology [1] was proposed by professor Gu with Dr. Zhu in 1990th. WSR is an oriental system methodology which had applied to many evaluation projects in China. E.g. evaluation of High-Technology Regions, Weapon System, Labor Market, Commerce Integrated Automation etc, we assumed this methodology also could be appropriate in evaluation of university. In a sense, the oriental methodology is a good choice in order to solve the problem of evaluation of university in Eastern countries. On the other side, we also contacted to professor T.Honda who is a specialist of university evaluation in Japan. Moreover, professor Gu also had the education experience of several ten years in China. With their help, we started this research. Now, there exists many works to rank universities, so to rank the university isn t the main purpose in this thesis. We want point out some problems on the usual evaluation work of university. Here, we just wish apply the WSR Systems approach to help the right and comprehensive evaluation of universities and through the principal component analysis to analyze the relationship between evaluation indexes, the object of evaluation (universities) and the evaluators, and finally use the tolerate order method which combines both qualitative and quantitative advantages to rank universities in China and Japan. Through comparing the background of culture in both Japan and China which exist in the university, we found that the university has the strong points and weak points; each university should learn from others strong points to offset its weaknesses. Although we are lacking the data for evaluating the university, however, we propose some new ideas, a working framework and some methods for evaluating university.. 1.3 WSR systems approach in the evaluation of university 1.3.1 The concept of Wuli Wuli is a Chinese word. It denotes objectivity in the ontological existence (natural or social, concrete or abstract) which consists of material surroundings as well as structural organizations[1]. Wuli layer is a basic data without processed for measuring the university in this case. For example, number of students, number of teachers, financial. -4-.
(11) Chapter 1. Introduction. resources, number of papers, education environments, etc. Most of the works for evaluation of university emphasized in this layer, because some factors is easy to measure and it also can show the fact of university to us. By Wuli layer analysis, we can know the university s scales (large or small), resources, environments, etc. In usually, the changing of this layer isn t large. However, the university merger and the changing of university name are popular in China recently by the policy of government. In Japan, some university may merge by the problem of management and the problem of the decrease of students. Hence, those reasons, it is difficult for us to compare in vertical, that is, we probably couldn t to do the statistics every year. The enlargement of university also is an important evaluation items, but we can t control changing of it and it is hard for us to get the data of evaluation index. This is a serious problem.. 1.3.2 The concept of Shili Shili also is a Chinese word. It means the mechanisms which underlie the relationships and process within the Universe [1]. In evaluation of university, Shili means efficiency of input and output of the universities. For example, students per teachers, papers per teachers, financial resources per teachers, financial resources per papers, the rate of employments etc. In Wuli layer, we can know the universities scale, resources etc. For example, if some universities are large enough, but the efficiency is low, we can t say it is an excellent university. We classified efficiency as two parts; one is related to the human resources, the other is related to the financial resources. At first, we tried to mix them together, but we couldn t to interpret the calculation results. Table 1.1 shows an example of mixed comparison. Suppose we have two universities A and B. if the value of the papers per teachers and financial resources per teachers are shown in Table 1.1, we couldn t to calculate both two evaluation indexes by one dimension. For solving this problem, we need to classify these evaluation indexes as two parts.. University A University B. PAPERS / TEACHERS 5 papers/teacher 2 papers/teacher. PAPERS / FINANCIAL RESOURCES 5 papers/10000 RMB 8 papers/10000 RMB. Table 1.1 an example of mixed comparison in Shili layer (RMB: a monetary unit of China.). -5-.
(12) Chapter 1. Introduction. 1.3.3 The concept of Renli Renli is Chinese word which concerned with the inter-subjective relations among all parties involved in the systems projects: client, authority, organizer, expert, potential owner, user, operator, beneficiary and loser, etc [1]. Renli uses the qualitative data for evaluating university which express the effectiveness in this case. In other words, the basic data and the efficiency are not reflecting the effectiveness completely, because each evaluators, such as presidents, companies, academicians have his own subjectivity. Renli also is an important layer in WSR systems approach. As ranking of Netbig , if the results of ranking haven t approved by the person connected with education, it will become a cause of dispute. If we pay much attention on the calculation results of Wuli layer or Shili layer, then it probably hasn t fited our image of universities in some time. Therefore, we need to take the evaluation items in Renli layer carefully. Table 1.2 shows the evaluation indexes of university in Wuli, Shili, and Renli layer. WU-LI Number of students, number of teachers, financial resources, number of papers, education environments, Etc. SHI-LI Students per teachers, papers per teachers, financial resources per teachers, financial resources per papers, the rate of employments, Etc. REN-LI Evaluation of presidents, companies, academicians, Etc. Table 1.2 WSR systems approach in evaluation index of university. 1.4 The evaluation methods For evaluating university, the weighted sum method is a usual method in many organizations [12, 13, 14]. This evaluation method is easy to implement, and we can understand the method by intuition. However, the difficult problem is that how can we decide the weight. Dr. Y.Jiang and professor C.Y.Yue published a paper which titled Research on Comparing Method of Comprehensively Evaluation Education Quality of Graduate Student . In their paper, the weighted sum, TOPSIS (Technique for Order Preference by Similarity to Ideal Solution), AHP (Analytical Hierarchy Process), ELECTRE (Elimination Et Choice Translating Reality), PROMETHEE (Preference Ranking Organization Method for Enrichment Evaluations), DEA (Data Envelopment. -6-.
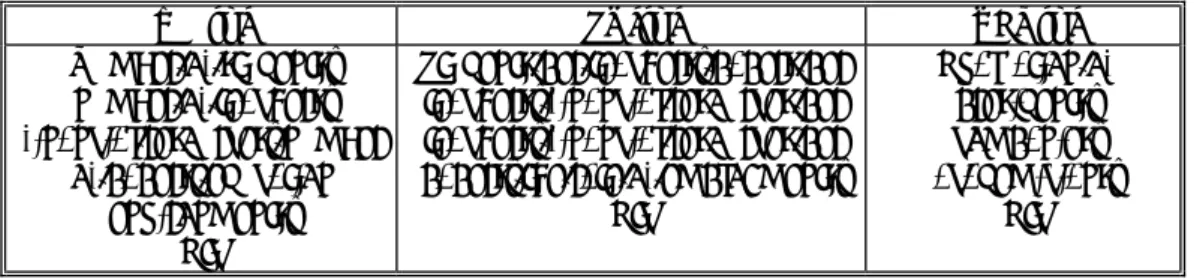
(13) Chapter 1. Introduction. Analysis), etc were compared by them. They also produced the software for comparing each method [12]. In our paper, using the software SPSS, we adopt the principal component analysis, factor analysis and cluster analysis to do analysis at first [4]. Based on these analyses, the ordinal solution on each component was calculated. We use the solution concept from Multiple Criteria Decision Making, and propose a new approach for evaluating university. Because the evaluation index in both Japan and China wasn t same, so we adopted the ordinal results for each country.. 1.5. The characteristic of this thesis. Table 1.3 shows the characteristic of find the method which suite to the component analysis, we found this university evaluation. Other methods. this paper. In usual case, it is difficult for us to methodology. However, through the principal method could reflect some phenomenons in (such as weight sum, AHP, NG,etc) probably. aren t suitable for knowing the relation between evaluation indexes. Moreover, most of evaluation works pay attention on the ranking, the relation between evaluation indexes was neglect. For evaluating university, the problem is that how much effect the ranking has. In special, the pointview of leader in education organization is most important, because they has the power of the budget allocation. By principal component analysis, we could found the relation between numbers of papers and the pointview of presidents or lectors in China [See Chapter 2 (2.1)]. For ranking the university, we propose the tolerate order method [See Chapter 2(2.2) and Chaper 3(3.2)]. THIS THESIS Methodology Method Application. Wuli-Shi-Renli Principal component analysis, factor analysis, cluster analysis tolerate order method. OTHERS OR,SE,SA,SD,QSD,STSD,SSM, Shinayakana, Meta-Synthesis Weight Sum, TOPSIS, AHP, ELECTRE, PROMETHEE, DEA, NG, Delphi, etc. Table 1.3 the characteristic of this thesis The role of WSR systems approach are shown in Table 1.4, that is, WSR can help us to construct the framework for evaluating university.. -7-.
(14) Chapter 1. Introduction. At first, the evaluation index was classified by WSR. To collect the data are important works for evaluating university. Without collecting data, quantitative and qualitative evaluation is impossible. (In this thesis, we couldn t collect too much data by our own effort, because we hadn t enough time and budget). Next, we can make each evaluation works more clear by WSR. For example, some evaluation works pay much attention on the data collection (Wuli), some works emphasize in evaluation methods (Shili) and some organization wish improve the reputation to rank the university (Renli). At last, we found a trend in point of view, that is, Wuli layer stressed on the quantitative factors and Renli layer stressed on the qualitative factors respectively. Our thesis wish combine the quantitative and qualitative factors together. Principal component analysis is a good method for multi factor analysis. Needless to say, this method can process the combined quantitative and qualitative data. based on principal component analysis, we propose the tolerate order method. tolerate order method has half quantitative factor and half quanlitative factor, in other words, this method isn t so accurate as the basic data and isn t so inaccurate as subjective evaluation. In a sense, this method probably fit with oriental culture.. Evaluation Index Comparison and Evaluation Point of view. WULI Fact (basic data) Data collection Explicit goal Quantitative. SHILI Efficiency (human, investment) Method Choice (principal component analysis, tolerate order method) Quantitative, Qualitative. Table 1.4 the role of WSR systems approach. -8-. RENLI Effectiveness (orientation) Evaluator User leader Qualitative.
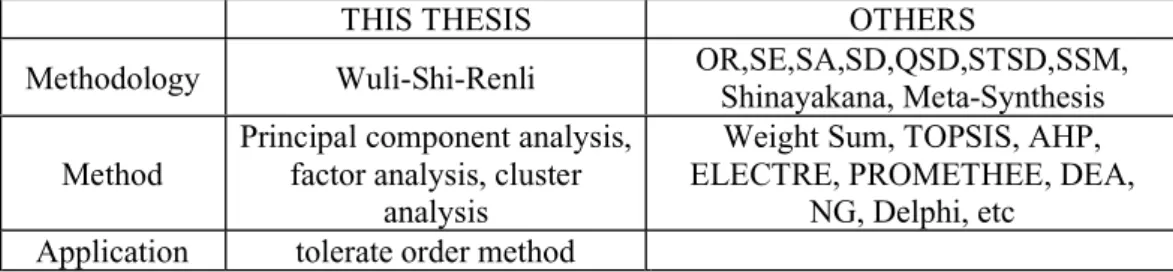
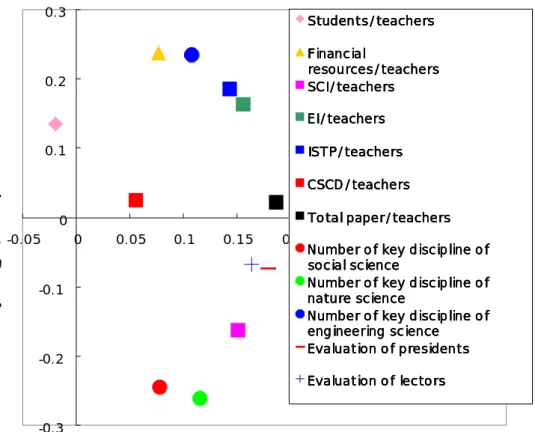
(15) Chapter 2. Evaluation of university of China. Chapter 2. Evaluation of university of China 2.1 Evaluation index and the score of university in principal component analysis In chapter 1, Asiaweek, Netbig and uniranks.edu.cn published the rankings of universities, each ranking is different by the reason of the evaluation indexes are different. Therefore, the university s rank wasn t fixed in each ranking. We selected the data for evaluating university from each organization site. We chose 32 universities to compare in this thesis since they had more than 10 evaluation indexes. We published the ranking in 1999 due to the collected data were carried out by the organization in 1998. Using the software of SPSS and WSR system approach, the analysis results are shown as following.. 2.1.1 An explanation in Wuli layer 0.4. 0.3. Second principal component. Number of Teachers 0.2. Number of Students Financial Resources. 0.1. SCI EI. 0. ISTP 0 CSCD 0.02. -0.1. 0.04. 0.06. 0.08. 0.1. 0.12. Number of Key discipline of Social Scinece Number of Key discipline of Nature Scinece Number of Key discipline of Engineering Science. -0.2. Evaluation of Presidents Evaluation of Lectors -0.3. First principal component. Fig 2.1 the results of principal component analysis in Wuli layer of China. -9-. 0.14. 0.16.
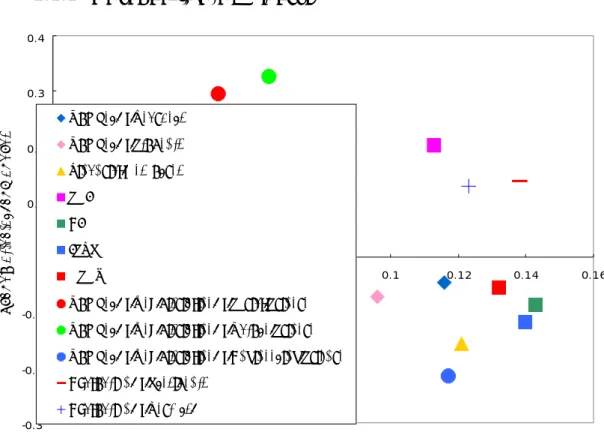
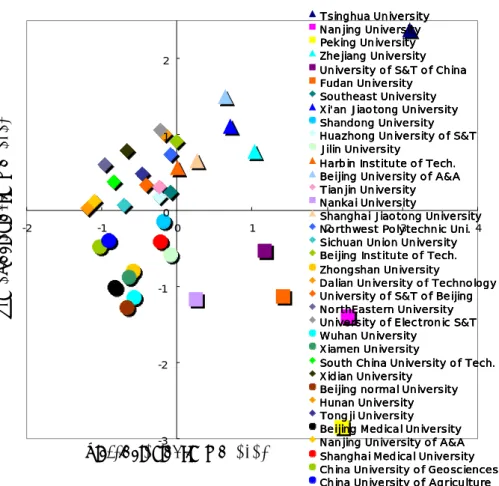
(16) Chapter 2. Evaluation of university of China. By using software SPSS, there are three principal components in Wuli layer of China. The ratio of contribution of third principal component took the small value, so we take the first and second principal component only [See Fig2.1]. In first principal component, the scores of all evaluation items took the small values. The changes of score also are small, so we couldn t found a new variable. On the other hand, we assumed that it shows total power of universities on this principal component. In second principal component, Number of papers cited in SCI, number of key disciplines of nature science and social science, evaluation of presidents and lectors take the positive scores; number of paper cited in EI, ISTP and CSCD, number of key disciplines of engineering science and financial resources take the negative scores. It suggests three points as following. l. Number of key disciplines of nature science was depend on number of papers cited SCI, and number of key disciplines of engineering science was depend on number of papers cited in EI and ISTP respectively. It suggests that the key disciplines of nature science and engineering science show the proper results.. l. l. The score of financial resources also take negative value, consequently, EI and ISTP are depending on financial resources, and SCI are not. For publishing the paper of EI or ISTP, it needs much investment of financial resources. The property of SCI isn t same to EI and ISTP, and it needn t the investment of financial resources. Both evaluation of presidents and lectors were near each other and they also are near to SCI, so it suggested the leader connected with education pay much attention on number of papers cited in SCI.. Fig 2.2 shows the score of each university in Wuli layer of China using principal component analysis. In first principal component, because it is shown the total power of universities, so the traditional universities got the high scores such as Tsinghua, Peking, Zhejiang, Nanjing and Fudan etc. In second principal component, positive scores were shown the universities which excellent on the social science and nature science. For example, Peking, Nanjing, Fudan and Nankai etc are excellent on this factor. From this principal component, Tsinghua University takes the negative score. In other words, Tsinghua University is excellent on engineering science and it gets many financial resources.. - 10 -.
(17) Chapter 2. Evaluation of university of China. Tsinghua University Nanjing University Peking University Zhejiang University University of S&T of China Fudan University Southeast University Xi'an Jiaotong University Shandong University Huazhong University of S&T Jilin University Harbin Institute of Tech. Beijing University of A&A Tianjin University Nankai University Shanghai Jiaotong University Northwest Polytechnic Uni. Sichuan Union University Beijing Institute of Tech. Zhongshan University 1.5Dalian University 2.5 of Technology 3.5 University of S&T of Beijing NorthEastern University University of Electronic S&T Wuhan University Xiamen University South China University of Tech. Xidian University Beijing normal University Hunan University Tongji University Beijing Medical University Nanjing University of A&A Shanghai Medical University China University of Geosciences China University of Agriculture. 4. 3. Second principal component. 2. 1. 0 -1.5. -0.5. 0.5. -1. -2. -3 First principal component. Fig 2.2 the score of each university in Wuli layer of China. 2.1.2 An explanation in Shili layer We classified the Shili layer as two parts; one is relating to the human resources, the other is relating to financial resources. Fig 2.3 and Fig 2.4 show the results of evaluation index of human resources and financial resources respectively. Number of key disciplines of engineering science is near to EI and ISTP; Number of key disciplines of nature science is near to SCI. it also suggests that the key disciplines of nature science and engineering science are depending on the efficiency of production of papers. The financial resources per teacher is near to the efficiency of the production of EI and ISTP, moreover, it is far to the efficiency of the production of SCI, that is, the efficiency of the. - 11 -. 4.5.
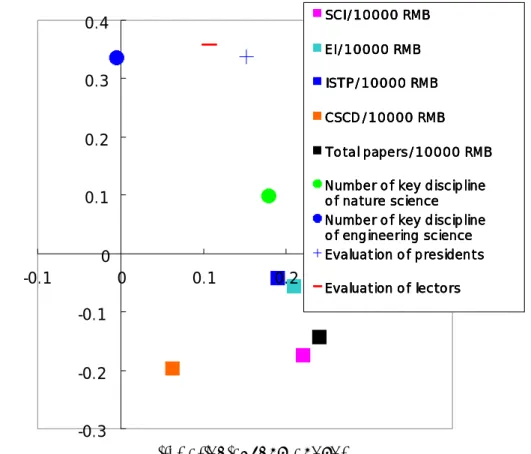
(18) Chapter 2. Evaluation of university of China. production of SCI isn t depending on the financial resource per teacher. In contrast, the efficiency of the production of EI and ISTP has a closely relation with financial resources. The evaluation of presidents and lectors is near to the efficiency of the production of SCI and it is far to the efficiency of the production of EI and ISTP. We also could see that the presidents and lectors pay much attention to the SCI again. The efficiency of investment of EI, SCI and CSCD (Chinese Science Citation Database) is far to the efficiency of investment of ISTP. It suggests that the property of conference of ISTP isn t same to EI, SCI and CSCD; moreover, the international conference (ISTP) takes much cost than usual internal conference. Hence, the efficiency of investment of ISTP isn t so high as others paper; the mount of ISTP also is small. In addition, because this paper published in Chinese National conference of System Engineering society of China, so the monetary unit is labeling by RMB. 0.3. Students/teachers Financial resources/teachers SCI/teachers. Second principal component. 0.2. EI/teachers 0.1. ISTP/teachers CSCD/teachers Total paper/teachers. 0 -0.05. 0. 0.05. 0.1. 0.15. -0.1. -0.2. 0.2. 0.25 0.3 0.35 0.4 Number of key discipline of social science Number of key discipline of nature science Number of key discipline of engineering science Evaluation of presidents Evaluation of lectors. -0.3. First principal component. Fig 2.3 the efficiency of human production in Shili layer of China. - 12 -.
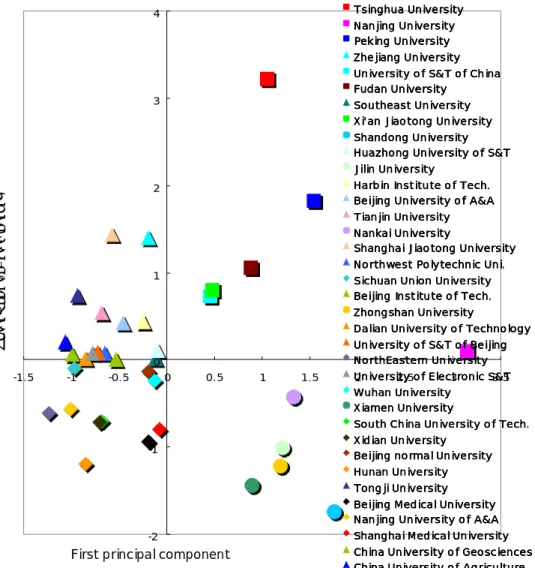
(19) Chapter 2. Evaluation of university of China. SCI/10000 RMB. 0.4. EI/10000 RMB. Second principal component. 0.3. ISTP/10000 RMB CSCD/10000 RMB. 0.2. Total papers/10000 RMB Number of key discipline of nature science Number of key discipline of engineering science Evaluation of presidents. 0.1. 0 -0.1. 0. 0.1. 0.2. 0.3. 0.4. Evaluation of lectors. -0.1. -0.2. -0.3. First principal component. Fig 2.4 the efficiency of investment in Shili layer of China The score of production efficiency and investment efficiency of each university is shown in Fig 2.5 and Fig 2.6 respectively. If the evaluation index in efficiency is high, than not only large university, but also the middle or small university can rank in this layer. This point of view isn t same to Wuli layer. With this comparing, the largest merit is that we can check whether the traditional university is excellent or not in efficiency.. - 13 -.
(20) Chapter 2. Evaluation of university of China. Second principal component. 2. 1. 0 -2. -1. 0. 1. -1. -2. -3. First principal component. Tsinghua University Nanjing University Peking University Zhejiang University University of S&T of China Fudan University Southeast University Xi'an Jiaotong University Shandong University Huazhong University of S&T Jilin University Harbin Institute of Tech. Beijing University of A&A Tianjin University Nankai University Shanghai Jiaotong University 2 3 Northwest Polytechnic Uni. 4 Sichuan Union University Beijing Institute of Tech. Zhongshan University Dalian University of Technology University of S&T of Beijing NorthEastern University University of Electronic S&T Wuhan University Xiamen University South China University of Tech. Xidian University Beijing normal University Hunan University Tongji University Beijing Medical University Nanjing University of A&A Shanghai Medical University China University of Geosciences China University of Agriculture. Fig 2.5 the score of production efficiency of each university. - 14 -.
(21) Chapter 2. Evaluation of university of China. 4. 3. Second principal component. 2. 1. 0 -1.5. -1. -0.5. 0. 0.5. 1. -1. -2. First principal component. 1.5. Tsinghua University Nanjing University Peking University Zhejiang University University of S&T of China Fudan University Southeast University Xi'an Jiaotong University Shandong University Huazhong University of S&T Jilin University Harbin Institute of Tech. Beijing University of A&A Tianjin University Nankai University Shanghai Jiaotong University Northwest Polytechnic Uni. Sichuan Union University Beijing Institute of Tech. Zhongshan University Dalian University of Technology University of S&T of Beijing NorthEastern University University S&T 2 2.5of Electronic 3 3.5 Wuhan University Xiamen University South China University of Tech. Xidian University Beijing normal University Hunan University Tongji University Beijing Medical University Nanjing University of A&A Shanghai Medical University China University of Geosciences China University of Agriculture. Fig 2.6 the score of investment efficiency of each university. 2.1.3 An explanation in Renli layer In Renli layer, we found that evaluation of presidents is closely to the evaluation of geological academicians, technical academicians, chemical academicians, mathematical academicians and biological academicians (the correlation coefficient was more than 0.9). We also got the same trend using the cluster analysis. By the results, we could arrange the evaluation index. In other words, Renli plays a navigation function in this study. In Wuli and Shili layer, we also tried to use the factor analysis and cluster analysis; the trend of results was similar to the principal component analysis.. - 15 -.
(22) Chapter 2. Evaluation of university of China. There are quantitative evaluation indexes and qualitative evaluation indexes in Wuli, Shili and Renli layer. In principal component analysis, because the entire evaluation index is calculating by correlation matrix, so we needn t care the unit. Therefore, it suggests that not only this analysis method is suite to evaluate the university, but also the method is fit with WSR systems approach. In addition, for finding the new index, the method played the important role in multi factor analysis.. 2.2 Ordinal solution Using the score of each university in principal component analysis, we propose the tolerate order method to rank the universities. We computed the optimum solution in single index, entire index, Pareto optimal solution, tolerate solution (top 20, top 15, top 10, top 5), robust solution and ordinal solution of each university respectively. There were nine principal components in Wuli, Shili (human) and Shili (investment). At first, we tried to find the optimum solution in entire index, but we couldn t find it. It suggests that no university is excellent in entire evaluation index. Next, utilizing Pareto optimal solution, we can rank the universities, but this computing is too detailed. We assumed the detailed ranking isn t fitting the human image for university. So we proposed the tolerate method. We tried to compute the tolerate solution in top 20, 15, 10 and 5. In top 15 and top 20, numbers of universities is too much; in top 5, numbers of universities also too small. So we published the tolerate solution of top 10 in Wuli and Shili layer [see Fig. 2.7, 2.8 and 2.9]. The total solution in Wuli and Shili layer, that is, ordinal solution is shown in Fig. 3.0. Using the results of ordinal solution, we classify four ranks for university. We give five stars for the universities which have more than five scores in ordinal solution [see Table 2.1]. Table 2.2 shows the university ranking of China in 1999 by tolerate method. NUMBERS OF STARS ★★★★★ ★★★★ ★★★ ★★. THE SCORES OF ORDINAL SOLUTION More than 5 3 and 4 2 1. Table 2.1 Definition of the Numbers of stars. - 16 -.
(23) University of S&T of China. University of S&T of China. Fudan University. Zhejiang University Shandong University Jilin University Harbin Institute of Tech. Tianjin University Shanghai Jiaotong University Zhongshan University Wuhan University Xiamen University Beijing normal University Tongji University Beijing Medical University Shanghai Medical University China University of. Huazhong University of S&T Shanghai Jiaotong University Sichuan Union University Wuhan University Xiamen University Tsinghua University Zhejiang University Xi’an Jiaotong University Jilin University Harbin Institute of Tech. Tianjin University Nankai University Zhongshan University NorthEastern University Beijing normal University. China University of Tongji University. Chapter 2. Evaluation of university of China. Nanjing University. 3. Tsinghua University. Nankai University. 2. Nanjing University. Fig 2.7 the tolerate solution in Wuli layer. - 17 -. Fig 2.8 the tolerate solution in Shili layer (Investment efficiency). Fudan University. Xi’an Jiaotong University. 1. 0. 3. 2. 1. 0. Peking University. Peking University.
(24) 8 7 6 5 4 3 2 1 0 2. 1. 0 Tsinghua University Nanjing University Peking University Fudan University Xi’an Jiaotong University Beijing University of A&A Dalian University of Technology NorthEastern University University of Electronic S&T Xidian University Zhejiang University University of S&T of China Shandong University Jilin University Nankai University Shanghai Jiaotong University Northwest Polytechnic Uni. Beijing Institute of Tech. Hunan University Tongji University. Chapter 2. Evaluation of university of China. Fig 2.9 the tolerate solution in Shili layer (Human efficiency). Fig 3.0 the ordinal solution (total of Wuli and Shili layer). - 18 -. Peking University Fudan University Tsinghua University Nanjing University University of S&T of China Xi’an Jiaotong University Nankai University Shanghai Jiaotong University Zhejiang University Jilin University NorthEastern University Wuhan University Xiamen University Tongji University Shandong University Huazhong University of S&T Harbin Institute of Tech. Beijing University of A&A Tianjin University Sichuan Union University Zhongshan University Dalian University of Technology University of Electronic S&T Xidian University Beijing normal University Northwest Polytechnic Uni. Beijing Institute of Tech. Hunan University Beijing Medical University Shanghai Medical University China University of Geosciences China University of Agriculture.
(25) Chapter 2. Evaluation of university of China. RANK. NUMBERS OF UNIVERSITIES. ★★★★★. 6. ★★★★. 8. ★★★. 11. ★★. 6. UNIVERSITY NAME Peking Univ. Tsinghua Univ. Fudan Univ. Nanjing Univ. Xi an Jiaotong Univ. Univ. of S&T of China Nankai Uni. Shanghai Jiaotong Univ. Zhejiang Univ. Jilin Univ. Northeastern Univ. Wuhan Univ. Xiamen Univ. Tongji Univ. Sichuan Univ. Huazhong Univ. of S&T Harbin Institute of Tech. Shandong Univ. Beijing Univ. of A&A, Tianjin Univ. Zhongshan Univ. Dalian Univ. of Tech. Univ. of Electronic S&T, Xidian Univ. Beijing normal Univ. Northwest Polytechnic Univ. Hunan Univ. Beijing Medical Univ. Chinese Univ. of Geosciences Chinese Univ. of Agriculture. Table 2.2 University ranking of China by WSR systems approach in 1999. - 19 -.
(26) Chapter 3. Evaluation of university of Japan. Chapter 3.. Evaluation of university of Japan. 3.1 Evaluation index and the score of university in principal component analysis As shown in Chapter 1, some private universities also have high reputation in Japan even they haven t so much number of papers, we also can see this phenomenon in principal component analysis. University Ranking 2000 has more thirty-evaluation indexes, however, in most of the evaluation works they take single evaluation index and the data collection as main work. The comprehensive evaluation for university wasn t appeared such as in Chinese case. On the other side, about evaluating the productivity and quality of paper between two groups in university, J.Makino, Y.Fujigaki and Y.Imai published a report using the frequency of the paper cited by others [9]. In this study, it is limited in two small research groups. In a sense, university ranking of Asiaweek probably is a first case to evaluate the universities related with Japan in comprehensively, but they are lacking the important universities such as Tokyo University [See Chapter1]. In fact, we found many data in the media, but the lack of data also are too much. Hence, we selected 12 evaluation indexes and 21 universities (both national and private university) in this thesis.. 3.1.1 An explanation in Wuli layer Comparing to China, the typical difference is that many works pay much attention to the social factors in Japan. For example, number of presidents, directors, administrators in company and the evaluation by the personal section in the company had done by some organizations [5]. Fig 3.1 shows the results of principal component analysis in Wuli layer of Japan. In first principal component, not only outside funds, financial resources, the paper cited in Nature, CA and SSCI are near each other, but also the correlation coefficients of them are more than 0.9. It suggests that the research of high technology had closely relation with the investment. The score of Mathematics paper isn t near to investment factors, that is, it doesn t need too much investments comparing to Nature, CA and SSCI.. -20-.
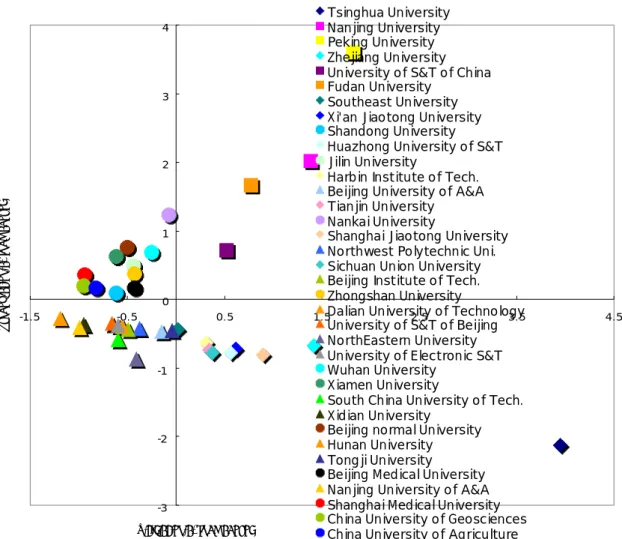
(27) Chapter 3. Evaluation of university of Japan. In second principal component, the number of students, number of presidents, directors, administrators and the evaluation by the personal section in the company are near each other. It suggests that five evaluation indexes have crossly relation. 0.25. 0.2 Number of teachers Number of students. Second principal component. 0.15. Financial resources Outside funds. 0.1. CA Math. 0.05. Nature 0 0 -0.05. SSCI 0.02 0.04 0.06 Evaluation of company. 0.08. 0.1. 0.12. 0.14. 0.16. Number of Presidents Number of directors. -0.1 Number of administrators -0.15 First principal component. Fig 3.1 the results of principal component analysis in Wuli layer of Japan As shown in Fig 3.1, the research activity and education activity are classified by two groups. One is financial resources and papers; the other is students and connected to companies. It suggests that some universities pay much attention to the research activity and some universities pay much attention to the education activity. Fig 3.2 shows the score of each university in Wuli layer of Japan. In this figure, the old-imperial-universities such as Tokyo University, Kyoto University, Osaka University, and Tohoku University etc were excellent in research activities. In other words, they produce many papers and get much financial resources.. -21-.
(28) Chapter 3. Evaluation of university of Japan. On the other side, the private universities such as Waseda University, Keio University were excellent in education activity. Therefore, they have produced many talented persons such as the president, director, and administrator of company to the society. They also have high reputation from the personal section in company as well as the oldimperial-universities. Waseda University 3.5 Fukuoka University 3. Science University of Tokyo Keio University. 2.5. Tokyo Metropolitan University Osaka Prefecture University Yokohama National University Hokkaido University. Second principal component. 2. 1.5 Nagoya University Tohoku University. 1. Tokyo University Tokyo Institute of Technology Universtiy of Tsukuba. 0.5. 0 -2. -1. 0. 1. 2. 3. -0.5. Chiba University 4 Shinsyu University Kobe University Kyoto University. -1. Kyusyu Universtiy Okayama University. -1.5. First principal component. Osaka University. Fig 3.2 the score of each university in Wuli layer of Japan. 3.1.2 An explanation in Shili layer In Shili layer, we pay attention to the number of students and number of teachers in 48 national universities and 68 private universities before using principal component. -22-.
(29) Chapter 3. Evaluation of university of Japan. analysis. Excluding the medical universities, we found that one teacher has about 13 students in national universities, however, in private universities one teacher has about 35 students. From this factor, we assumed that the main performance in private universities is education, and the main performance in national universities is research. We classified the Shili layer of Japan as two parts which are same to China. Fig 3.3 and Fig 3.4 show the efficiency of human resources and financial resources, Fig 3.5 and Fig 3.6 show the score of each university in efficiency of human resources and financial resources respectively. 0.6. Second principal component. 0.5 Financial resources/teachers 0.4 Outside funds/teachers 0.3. -0.2. Students/teachers 0.2 SSCI/teachers 0.1 Math/teachers 0 -0.1 Nature/teachers 0 -0.1 CA/teachers. 0.1. 0.2. 0.3. -0.2 Evaluation of companies -0.3 -0.4. First principal component. Fig 3.3 the efficiency of human production in Shili layer of Japan From Fig 3.3, evaluation of companies is far to other evaluation indexes, it suggests that the companies aren t pay much on the efficiency of paper production. It doesn t necessary follow that most of talented person in the company is excellent in the research activity. Now, the needs in society are the ability of problem solution and creation. Moreover, the key point is how produce many talented person in university. By this analysis, if we pay too much attention to the paper production or improve the efficiency of paper production, then the role of university probably become small for society. For. -23-.
(30) Chapter 3. Evaluation of university of Japan. this problem, it needs to investigate for us in next step. On other side, the financial resources per teachers are near to the efficiency of production paper in CA and Nature. It suggests that the investment and efficiency of human production have a closely relation. Contrast to CA and Nature, SSCI and Math aren t close to the investment, because the capacity of them are different to CA and Nature. Math and SSCI needn t big researching room and machines in usual case. In other words, it has an independent relation between three groups, that is, SSCI group, Math group and the group of Nature and CA. In Fig 3.4, the investment of SSCI is near to Nature; the investment of Math is near to CA respectively. It suggests that the efficiency of investment is different to the efficiency of human production. Financial resources/teachers 0.5. Outside funds/teachers Students/teachers. 0.4. SSCI/10000RMB Math/10000RMB. 0.3. Second principal component. Nature/10000RMB CA/10000RMB. 0.2. Evaluation of companies. 0.1. 0 -0.4. -0.3. -0.2. -0.1. 0. 0.1. 0.2. -0.1. -0.2. First principal component. Fig 3.4 the efficiency of investment in Shili layer of Japan. -24-. 0.3.
(31) Chapter 3. Evaluation of university of Japan. Osaka University. 3. Okayama University. Second principal component. Kyusyu Universtiy Kyoto University. 2. Kobe University Shinsyu University 1. Chiba University Universtiy of Tsukuba Tokyo Institute of Technology. 0 -2. -1. 0. 1. 2. Tokyo University 3 Tohoku University Nagoya University. -1. Hokkaido University Yokohama National University Osaka Prefecture University. -2. Tokyo Metropolitan University Keio University -3. Science University of Tokyo. First principal component. Fukuoka University Waseda University Saitama University. Fig 3.5 the score of production efficiency of each university. -25-.
(32) Chapter 3. Evaluation of university of Japan. Osaka University Okayama University Kyusyu Universtiy Kyoto University Kobe University Shinsyu University Chiba University Universtiy of Tsukuba Tokyo Institute of Technology Tokyo University Tohoku University Nagoya University Hokkaido University Yokohama National University Osaka Prefecture University Tokyo Metropolitan University Keio University Science University of Tokyo Fukuoka University Waseda University Saitama University. 3.5 3. Second principal component. 2.5 2 1.5 1 0.5 0 -2. -1. 0. 1. 2. 3. -0.5 -1 -1.5. First principal component. Fig 3.6 the score of investment efficiency of each university. 3.1.3 An explanation in Renli layer In University Ranking 2000 , there has the president evaluation, but this president evaluation isn t same to the president evaluation in China. Not only the survey method is deferent, but also the point-view of president is different. Most of Chinese presidents gave the traditional universities with a high reputation, but most of Japanese presidents pay much attention to whether the university carried out reforms or not. So Japanese president gives the high rank whether the university reform has an impact or not, it is not rank the present situation or the scale of university. In other words, president emphasized on the university s change. As shown in the Wuli and Shili layer of Japan, company evaluation becomes a typical. -26-.
(33) Chapter 3. Evaluation of university of Japan. evaluation index in university evaluation. About this approach, some organizations such as Netbig, uniranks.edu.cn hadn t to do this work in 1999. In ranking 2000 of Netbig, they only received five responses form company. It suggests that the survey scale isn t so large. About the database of paper, we will discuss in Chapter 4.. 3.2 The ordinal solution As shown in chapter 2, we use the same method to rank the university of Japan. Because the number of universities and the evaluation indexes are deferent to China, so the analysis result was changed. The biggest changing point is the number of principal components. Number of evaluation indexes in Japan is fewer than China. In fact, the principal components are only two in Wuli layer and efficiency of paper production in Shili layer, and the maximum ordinal solution is seven in Wuli and Shili layer. Fig 3.7, Fig 3.8 and Fig 3.9 show the tolerate solution in each layer, and Fig 4.0 shows the ordinal solution respectively. Here, we also classified four ranks for universities of Japan as same as Table 2.1 [see Chapter 2]. Table 3.1 shows the university ranking of Japan in 1999 using tolerate method. 2. Fig 3.7 the tolerate solution in Wuli layer. -27-. Fukuoka University. Science University of Tokyo. Osaka Prefecture University. Yokohama National University. Hokkaido University. Nagoya University. Tohoku University. Tokyo University. Universtiy of Tsukuba. Chiba University. Shinsyu University. Kobe University. Kyoto University. Kyusyu Universtiy. Okayama University. Osaka University. Waseda University. 0. Keio University. 1.
(34) Keio University Kyusyu Universtiy Kobe University Tokyo Institute of Technology Nagoya University Hokkaido University Yokohama National University Fukuoka University Waseda University. Fukuoka University Osaka University Kyoto University Saitama University Universtiy of Tsukuba Tokyo University Yokohama National University Tokyo Metropolitan University Waseda University Okayama University Kyusyu Universtiy Kobe University Shinsyu University Chiba University Nagoya University Osaka Prefecture University Keio University. Chapter 3. Evaluation of university of Japan. Tohoku University. 3. Tokyo University. 2. Universtiy of Tsukuba. Science University of Tokyo. Fig 3.8 the tolerate solution in Shili layer (Investment efficiency). -28-. Fig 3.9 the tolerate solution in Shili layer (Human efficiency). Kyoto University. 1. 0. 2. 1. 0. Osaka University.
(35) Chapter 3. Evaluation of university of Japan. 5. 4. 3. 2. Tokyo Institute of Technology. Tokyo Metropolitan University. Osaka Prefecture University. Hokkaido University. Chiba University. Shinsyu University. Saitama University. Okayama University. Nagoya University. Tohoku University. Kobe University. Kyusyu Universtiy. Science University of Tokyo. Yokohama National University. Waseda University. Fukuoka University. Keio University. Tokyo University. Universtiy of Tsukuba. Kyoto University. 0. Osaka University. 1. Fig 4.0 the ordinal solution (total of Wuli and Shili layer). RANK. NUMBERS OF UNIVERSITIES. ★★★★★. 7. ★★★★. 6. ★★★. 7. ★★. 1. UNIVERSITY NAME Tokyo Univ. Kyoto Univ. Osaka Univ. Keio Univ. Waseda Univ. Univ. of Tsukuba Fukuoka Univ. Yokohama National Univ. Kobe Univ. Science Univ. of Tokyo Kyusyu Univ. Tohoku Univ. Nagoya Univ. Hokkaido Univ. Chiba Univ. Okayama Univ. Saitama Univ. Shinsyu Univ. Osaka Prefecture Univ. Tokyo Metropolitan Univ. Tokyo Institute of Technology. Table 3.1 University ranking of Japan by WSR system approach in 1999. -29-.
(36) Chapter 5. Conclusions and future directions. Chapter 5. Conclusions and future directions 5.1 Conclusions The economic conditions and industrial structure between Japan and China are different. There are many agricultural and technical universities in China, but Japan has many high-tech and business universities. Therefore, we couldn t choose the same kind of universities for comparison. In other words, the existed works can help us to know the goal and to select the kind of university. We collected more ten evaluation-indexes in Wuli layer, that is, the excellent universities usually can provide many factor s data to survey organization. As shown in Table 5.1, through the evaluation in each country [see Chapter 2 and Chapter 3] and comparison in both Japan and China [see Chapter 4], we can see the culture difference in both two countries. In usual case, the data collection or methods improving became the main purpose on others work, but we extract culture (the tacit knowledge) from the quantitative or qualitative data of universities using WSR. The culture leads us to think or to decide some thing in many cases. For example, most of Chinese presidents emphasized to SCI, so the university had many papers citied SCI such as Nanjing University which was rank higher than usual university. On other side, uniranks.edu.cn laid stress on prizes, patents and the profits of the campus-run workshop etc, so the rank of Nanjing University isn t so high in that ranking. Different organizations have different cultures even in China as above. Therefore, it isn t strange for us that there aren t common evaluation-indexes between both two countries.. Private University President evaluation. JAPAN Good reputation Reforms, changes. Database of paper Emphasized factor Economic conditions. CA Social Advanced. CHINA Poor reputation Tradition, academy SCI Academic Developing. Table 5.1 the culture comparison It has a trend that to establish the private universities in China recently years, but the reputation is poor. The student quality in the private universities is also bad because of. -42-.
(37) Chapter 5. Conclusions and future directions. they have many students who were failed in the national entrance examination. As shown in Chapter 3, Japanese president emphasized the reforms and changes of the university; Chinese presidents emphasized the traditional universities and the papers citied in SCI. Although the total paper in Japan hadn t large difference between CA and SCI, some Japanese researches assumed the database of SCI is unfair because of the difference between CA and SCI is too small contrast to US or Europe. Even the paper citied in SCI of Chinese is about half of CA, some Chinese researchers assume that the SCI is a better evaluation index for evaluating university. We assume that it is a serious problem, because not only this point-view probably brushes away the works of native language, but also the persuasiveness of SCI is weaker than CA. As shown in Chapter 1 and Chapter 4, most of Japanese universities pay much attention to social factor, but the social survey hadn t done in full scale by some organizations in China. At last, we assume that the economic gap between Japan and China also is appearing on the education system.. 5.2 Future directions If we pay attention to the growth rate of paper citied in CA, than the total number of paper of China will rank the second, which weak to USA only after ten years. The government of China published the goal which increases the percentage of education budget to GNP as 4.0%. The university merger and the changing of university name are popular in China recently by the policy of government. In Japan, some university may merge by the reason of the problem of management and the problem of the decrease of students. In this thesis, we made a framework model only in order to evaluating the university better. However, we only do the horizontal comparison because of the collected data are only one year. For catch the changes of universities, it needs to collect several years data. We assume that the framework model covered the comprehensive evaluation of university even the evaluation index was deferent.. -43-.
(38) Supplement. Supplement 1 Comparison of financial resources in both Japan and China (Best 100 universities) Rank. University name. Japanese Yen. RMB. 1. Tokyo University. 10171000.00. 778081.50. 2. Kyoto University. 8891900.00. 680230.35. 3. Tohoku University. 5240700.00. 400913.55. 4. Osaka University. 5030000.00. 384795.00. 5. Nagoya University. 4084200.00. 312441.30. 6. Tsinghua University. 3930326.80. 300670.00. 7. Hokkaido University. 3742000.00. 286263.00. 8. Tokyo Institute of Tech.. 3577737.00. 273696.88. 9. Zhejiang University. 3556405.23. 272065.00. 10. Kyusyu University. 3169100.00. 242436.15. 11. Shanghai Jiaotong University. 3011071.90. 230347.00. 12. Sichuan University. 2421402.61. 185237.30. 13. Tianjin University. 2253816.99. 172417.00. 14. Tongji University. 2054928.10. 157202.00. 15. Northeastern University. 2027803.92. 155127.00. 16. Peking University. 1734823.53. 132714.00. 17. University of Tsukuba. 1712590.00. 131013.14. 18. Beijing Univ. of A&A. 1706379.08. 130538.00. 19. Hiroshima University. 1667102.00. 127533.30. 20. Harbin Institute of Tech.. 1579725.49. 120849.00. 21. Univ. of S&T of China. 1575686.27. 120540.00. 22. Fudan University. 1558196.08. 119202.00. 23. Northwest Polytechnic University. 1548732.03. 118478.00. 24. Huazhong University of S&T. 1485098.04. 113610.00. 25. Shanghai University. 1464784.31. 112056.00. 26. Dalian University of Tech.. 1441568.63. 110280.00. 27. Renmin University of China. 1405528.10. 107522.90. 28. University of Electronic S&T. 1357647.06. 103860.00. 29. Southeast University. 1350875.82. 103342.00. 30. Beijing Institute of Tech.. 1341241.83. 102605.00. 31. Keio University. 1279528.00. 97883.89. 32. Univ. of Petroleum of China. 1258261.44. 96257.00. 33. Chiba University. 1255200.00. 96022.80. -49-.
(39) Supplement. Rank. University name. Japanese Yen. RMB. 34. Kumamoto University. 1201800.00. 91937.70. 35. Nanjing Univ. of S&T. 1195686.27. 91470.00. 36. Xi’an Jiaotong University. 1120901.96. 85749.00. 37. Northern Jiaotong University. 1092418.30. 83570.00. 38. Kobe University. 1090241.00. 83403.44. 39. Nanjing University. 1057529.41. 80901.00. 40. Univ. of S&T of Beijing. 1041542.48. 79678.00. 41. Okayama University. 1015941.00. 77719.49. 42. China Univ. of Mining & T. 1004535.95. 76847.00. 43. Huadong Univ. of S&T. 996705.88. 76248.00. 44. Xinan Jiaotong University. 945359.48. 72320.00. 45. Tokyo medical and dental Univ.. 910300.00. 69637.95. 46. 831477.12. 63608.00. 47. Xidian University Beijing Univ. Telecommunications. 778954.25. 59590.00. 48. Chongqing University. 766954.25. 58672.00. 49. Nanjing Univ. of A&A. 766941.18. 58671.00. 50. Huanan Univ. of S&T. 754928.10. 57752.00. 51. Beijing Polytechnic University. 745320.26. 57017.00. 52. Niigata University. 724100.00. 55393.65. 53. Waseda University. 715500.00. 54735.75. 54. Fuzhou University. 635796.00. 52983.00. 55. Jilin Polytechnic University. 667346.41. 51052.00. 56. Tokushima University. 664500.00. 50834.25. 57. Zhongnan Polytechnic University. 658771.24. 50396.00. 58. China Univ. of Agriculture. 657751.63. 50318.00. 59. Gunma University. 640374.00. 48988.61. 60. Wuhan University. 602248.37. 46072.00. 61. Hunan University. 571777.78. 43741.00. 62. Wuhan Univ. of Irrigation and Electronics. 571202.61. 43697.00. 63. Hefei Polytechnic University. 567294.12. 43398.00. 64. Shinsyu University. 553418.00. 42336.48. 65. Tokyo Metropolitan University. 549930.00. 42069.65. 66. Wuhan Polytechnic University. 548496.73. 41960.00. 67. Tokyo Agricultural University. 538300.00. 41179.95. 68. Univ. of Petroleum of Daqing. 530078.43. 40551.00. 69. Nagasaki University. 528600.00. 40437.90. 70. Jilin University. 519516.34. 39743.00. 71. Osaka municipal University. 506000.00. 38709.00. 72. China Univ. of Geosciences. 491163.40. 37574.00. of. Posts. and. -50-.
(40) Supplement. Rank. University name. Japanese Yen. RMB. 73. Beijing Normal University. 483307.19. 36973.00. 74. Gifu University. 481600.00. 36842.40. 75. Hehai University. 479281.05. 36665.00. 76. China Textile University. 469882.35. 35946.00. 77. Kagoshima University. 468300.00. 35824.95. 78. Osaka Prefecture University. 467000.00. 35725.50. 79. Nankai University. 451516.34. 34541.00. 80. Kanazawa University. 447800.00. 34256.70. 81. Shandong University. 439346.41. 33610.00. 82. Mie University. 431820.00. 33034.23. 83. Harbin Univ. of S&T. 428810.46. 32804.00. 84. Harbin Univ. of Engineering. 427843.14. 32730.00. 85. Tokai University. 425900.00. 32581.35. 86. Shanghai Univ. of S&T. 422901.96. 32352.00. 87. Suzhou University. 422339.87. 32309.00. 88. Huabei Electric Power University. 419725.49. 32109.00. 89. Tokyo Medical University. 409417.00. 31320.40. 90. Yokohama National University. 405800.00. 31043.70. 91. Yamagata University. 397255.00. 30390.01. 92. Xinan Petroleum University. 396156.86. 30306.00. 93. Shizuoka University. 392210.00. 30004.07. 94. Yokohama municipal University Hangzhou University. 368200.00 333780.00. 28167.30 27815.00. 96. Tottori University. 359501.00. 27501.83. 97. Nihon University Zhejiang Univ. of Agriculture. 351300.00 318120.00. 26874.45 26510.00. Beijing Univ. of Chemical Industry. 314724.00. 26227.00. Xi’an Univ. of S&T. 313944.00. 26162.00. 95. 98 99 100. Remark: The university’s name has underline which shows Chinese Universities. The monetary unit was shown in thousands Japanese Yen and thousands RMB of China.. -51-.
(41) Supplement. Supplement 2 Comparison of financial resources per teacher in both Japan and China (Best 100 universities) Rank. University name. Financial Resources (RMB) Number of Teachers. Financial Resources/teachers. 1. Kyoto University. 680230.35. 2729. 249.26. 2. Tokyo Institute of Tech.. 273696.88. 1103. 248.14. 3. Tokyo University. 778081.50. 4068. 191.27. 4. Nagoya University. 312441.30. 1687. 185.21. 5. Tohoku University. 400913.55. 2520. 159.09. 6. Osaka University. 384795.00. 2447. 157.25. 7. Hokkaido University. 286263.00. 2076. 137.89. 8. Beijing Univ. of A&A. 130538.00. 1085. 120.31. 9. Zhejiang University. 272065.00. 2350. 115.77. 10. Kyusyu University. 242436.15. 2241. 108.18. 11. Northern Jiaotong Univ.. 83570.00. 797. 104.86. 12. Dalian University of Tech.. 110280.00. 1053. 104.73. 13. Shanghai Jiaotong University. 230347.00. 2254. 102.19. 14. Kumamoto University. 91937.70. 912. 100.81. 15. Tsinghua University. 300670.00. 3000. 100.22. 16. University of Electronic S&T. 103860.00. 1077. 96.43. 17. Tongji University. 157202.00. 1714. 91.72. 18. Beijing Univ. of Posts & Tele.. 59590.00. 679. 87.76. 19. Northwest Polytechnic Univ.. 118478.00. 1351. 87.70. 20. University of Tsukuba. 131013.14. 1563. 83.82. 21. Beijing Institute of Tech.. 102605.00. 1235. 83.08. 22. Northeastern University. 155127.00. 1870. 82.96. 23. Renmin University of China. 107522.90. 1309. 82.14. 24. Chiba University. 96022.80. 1215. 79.03. 25. Univ. of S&T of China. 120540.00. 1650. 73.05. 26. Hiroshima University. 127533.30. 1749. 72.92. 27. Tianjin University. 172417.00. 2400. 71.84. 28. East China Univ. of S&T. 76248.00. 1081. 70.53. 29. Gunma University. 48988.61. 703. 69.69. 30. Fudan University. 119202.00. 1736. 68.66. 31. Sichuan University. 185237.30. 2800. 66.16. 1273. 65.52. 1486. 64.78. 32. Kobe University. 83403.44. 33. Univ. of Petroleum of China. 96257.00. -52-.
(42) Supplement. Rank. University name. 34. Nanjing Institute of Tech.. 35. Financial Resources (RMB) Number of Teachers 91470.00. 1434. Financial Resources/teachers 63.79. Keio University. 97883.89. 1550. 63.15. 36. Xidian University. 63608.00. 1017. 62.54. 37. Univ. of S&T of Beijing. 79678.00. 1277. 62.39. 38. Okayama University. 77719.49. 1265. 61.44. Peking University. 132714.00. 2170. 61.16. 40. Harbin Institute of Tech.. 120849.00. 1977. 61.13. 41. Tokushima University. 50834.25. 845. 60.16. 42. Xi’an Jiaotong University. 85749.00. 1594. 53.79. 43. Osaka prefecture University. 35725.50. 691. 51.70. 44. Southeast University. 103342.00. 2000. 51.67. 45. Southwest Jiaotong Univ.. 72320.00. 1400. 51.66. 46. China Univ. of Mining & T. 76847.00. 1500. 51.23. 47. Shanghai University. 112056.00. 2202. 50.89. 48. Gifu University. 36842.40. 738. 49.92. 49. Niigata University. 55393.65. 1112. 49.81. 50. Shinsyu University. 42336.48. 915. 46.27. 51. Osaka municipal University. 38709.00. 841. 46.03. 52. Nagasaki University. 40437.90. 887. 45.59. 53. Beijing Polytechnic University. 57017.00. 1262. 45.18. 54. Nanjing Univ. of A&A. 58671.00. 1387. 42.30. 55. Huazhong Institute of Tech.. 113610.00. 2686. 42.30. 56. China Univ. of Agriculture. 50318.00. 1200. 41.93. 57. Shizuoka University. 30004.07. 717. 41.85. 58. Nanjing University. 80901.00. 1974. 40.98. 59. Waseda University. 54735.75. 1353. 40.46. 60. Huanan Institute of Tech.. 57752.00. 1440. 40.11. 61. Jinlin Polytechnic University. 51052.00. 1300. 39.27. 62. Zhongnan Polytechnic University. 50396.00. 1302. 38.71. 63. Beijing Univ. of Chemical Science. 26227.00. 678. 38.68. 64. Yamagata University. 30390.01. 793. 38.32. 65. 39. Hunan University. 43741.00. 1200. 36.45. 66. Tokyo Medical University. 31320.40. 886. 35.35. 67. Kagoshima University. 35824.95. 1027. 34.88. 68. Chongqing University. 58672.00. 1700. 34.51. 69. Kanazawa University. 34256.70. 1013. 33.82. 70. Science University of Tokyo. 24671.25. 761. 32.42. 71. Huazhong Univ. of Agriculture. 24602.00. 800. 30.75. Heihai University. 36665.00. 1211. 30.28. 72. -53-.
(43) Supplement. Rank. Financial Resources (RMB) Number of Teachers. University name. Financial Resources/teachers. 73. Ehime University. 25612.20. 850. 30.13. 74. China Univ. of Geosciences. 37574.00. 1261. 29.80. 709. 29.79. 76. Juntendo University Wuhan Univ. of Irrigation Electric Power. 21121.65 43697.00. 1470. 29.73. 77. Hefei Industry University. 43398.00. 1500. 28.93. 78. Shenyang Polytechnic University. 20947.00. 752. 27.86. 79. Jinlin University. 39743.00. 1523. 26.10. 80. Nanjing Univ. of Agriculture. 20449.00. 817. 25.03. 81. Shandong University. 33610.00. 1422. 23.64. 82. Nankai University. 34541.00. 1462. 23.63. 83. Ryukyu University. 19354.50. 833. 23.23. 84. Qingdao Ocean University. 23171.00. 1000. 23.17. 85. Yamaguti University. 19591.65. 848. 23.10. 86. Kunming University. 20880.00. 932. 22.40. 87. Wuhan University. 46072.00. 2114. 21.79. 88. Tokyo Woman’s Medical University. 17281.35. 803. 21.52. 89. Tokai University. 32581.35. 1514. 21.52. 90. Nanjing Normal University. 23447.00. 1100. 21.32. 91. Syowa University. 25596.90. 1226. 20.88. 92. Litsumeikan University. 14253.48. 708. 20.13. 93. Nihon Medical University. 17625.60. 886. 19.89. 94. Teikyo University. 20647.35. 1059. 19.50. 95. China Pharmaceutical Univ.. 14558.00. 747. 19.49. 96. 75. and. Beijing Normal University. 36973.00. 2072. 17.84. 97. Taiyuan Univ. of S&T. 23067.00. 1547. 14.91. 98. Zhongshan University. 26062.00. 1836. 14.19. 99. Huadong Normal University. 18957.00. 1400. 13.54. Xiamen University. 18314.00. 1397. 13.11. 100. Remark: The university’s name has underline which shows Chinese Universities. The monetary unit was shown in thousands RMB of China. We only chose the universities which have more than 600 teachers.. -54-.
(44) Supplement. Supplement 3 The output data of Principal component analysis by SPSS in Wuli layer of Japan 3-1.. Descriptive statistics quantity. . Mean. Financial resources. 2670839.25. 2866633.11. SSCI. Standard deviation. Analysis samples 20. 399.22. 571.71. 20. Mathematics. 43.15. 28.80. 20. Nature. 25.25. 38.60. 20. 1143.35. 1018.18. 20. 78.98. 127.47. 20. 3026880.55. 3273273.51. 20. CA Evaluation of company Outside founds Number of teachers. 1577.85. 880.85. 20. Number of students. 13242.70. 8361.51. 20. Number of presidents. 2798.10. 4105.64. 20. Number of directors. 800.25. 1017.97. 20. 1761.15. 1801.18. 20. Number of administrators. 3-2.. Correlation Matrix. Financial resources Financial resources SSCI Mathematics Nature CA Evaluation of company Outside founds Number of teachers Number of students Number of presidents Number of directors Number of administrators. SSCI. Mathematics Nature. CA. Evaluation of company. 1.000 0.782 0.536 0.929 0.971 0.005 0.902 0.921 -0.041 -0.038 0.456. 0.782 1.000 0.401 0.868 0.760 0.105 0.848 0.780 0.067 0.066 0.504. 0.536 0.401 1.000 0.515 0.500 -0.068 0.402 0.471 -0.171 -0.070 0.220. 0.929 0.868 0.515 1.000 0.907 0.041 0.941 0.892 0.043 0.028 0.544. 0.971 0.760 0.500 0.907 1.000 -0.037 0.905 0.934 -0.060 -0.071 0.401. 0.005 0.105 -0.068 0.041 -0.037 1.000 0.167 0.144 0.888 0.973 0.804. 0.308. 0.325. 0.101. 0.343. 0.276. 0.936. -55-.
(45) Supplement. Outside founds. Financial resources SSCI Mathematics Nature CA Evaluation of company Outside founds Number of teachers Number of students Number of presidents Number of directors Number of administrators. 3-3.. Number of teachers. 0.902 0.848 0.402 0.941 0.905 0.167 1.000 0.899 0.147 0.174 0.645 0.467. Number of students. 0.921 0.780 0.471 0.892 0.934 0.144 0.899 1.000 0.146 0.117 0.563 0.426. Number of presidents. -0.041 0.067 -0.171 0.043 -0.060 0.888 0.147 0.146 1.000 0.922 0.712 0.828. Number of directors. -0.038 0.066 -0.070 0.028 -0.071 0.973 0.174 0.117 0.922 1.000 0.824 0.924. Number of administrators. 0.456 0.504 0.220 0.544 0.401 0.804 0.645 0.563 0.712 0.824 1.000 0.938. 0.308 0.325 0.101 0.343 0.276 0.936 0.467 0.426 0.828 0.924 0.938 1.000. Eigen value and ratio of contribution. Component Eigen value. Initial eigen value ratio of cumulative ratio of contribution % contribution %. picked out components ratio of cumulative ratio Eigen value contribution % of contribution %. 1. 6.511. 54.262. 54.262. 6.511. 54.262. 54.262. 2. 3.995. 33.292. 87.554. 3.995. 33.292. 87.554. 3. 0.720. 6.003. 93.557 . . . . . 4. 0.314. 2.616. 96.173 . 5. 0.177. 1.476. 97.650 . . . 6. 0.123. 1.022. 98.671 . . . 7. 0.070. 0.586. 99.257 . . . 8. 0.051. 0.421. 99.679 . . . 9. 0.023. 0.192. 99.870 . . . 10. 0.011. 0.093. 99.964 . . . . . . . 11. 0.004. 0.031. 99.995 . 12. 0.001. 0.005. 100.000 . Remark: we picked out the component with more than 1.0 of Eigen value.. -56-.
(46) Supplement. 3-4.. The plots of components. The plots of components 7. Eigen value. 6 5 4 3 2 1 0 1. 2. 3. 4. 5. 6. 7. 8. 9. Number of components 3-5.. Component matrix . Component. . 1. 2. Financial resources. 0.867. -0.438. SSCI. 0.820. -0.297. Mathematics. 0.472. -0.364. Nature. 0.896. -0.375. CA. 0.844. -0.466. Evaluation of company. 0.436. 0.878. Outside founds. 0.933. -0.241. Number of teachers. 0.909. -0.280. Number of students. 0.385. 0.856. Number of presidents. 0.419. 0.901. Number of directors. 0.811. 0.528. Number of administrators. 0.693. 0.702. -57-. 10. 11. 12.
(47) Supplement. 3-6.. Scores matrix of principal component . Component. . 1. 2. Financial resources. 0.133. SSCI. 0.126. -0.074. Mathematics. 0.073. -0.091. Nature. 0.138. -0.094. CA. 0.130. -0.117. Evaluation of company. 0.067. 0.220. Outside founds. 0.143. -0.060. Number of teachers. 0.140. -0.070. Number of students. 0.059. 0.214. Number of presidents. 0.064. 0.226. Number of directors. 0.125. 0.132. Number of administrators. 0.106. 0.176. -0.110. Supplement 4 The output data of Principal component analysis by SPSS in Shili layer of Japan (efficiency of human production). 4-1. Descriptive statistics quantity . Mean. Standard deviation. Analysis samples. SSCI/teachers. 0.19. 0.22. 21. Math/teachers. 0.03. 0.03. 21. Nature/teachers CA/teachers. 0.01. 0.01. 21. Students/teachers Financial resources/teachers Outside funds/teachers Evaluation of companies. 0.62. 0.31. 21. 10.26. 7.06. 21. 1324.83. 930.24. 21. 1566.17. 945.74. 21. 75.40. 125.32. 21. 4-2. Correlation Matrix -58-.
(48) Supplement. SSCI/teachers SSCI/teac hers Math/teachers. Math per teachers. Nature per teachers. CA per teachers. Students per teachers. 1.000 -0.090. -0.090 1.000. 0.574 0.028. 0.278 0.046. -0.298 -0.202. 0.574. 0.028. 1.000. 0.738. -0.520. Nature/teachers CA/teachers. 0.278. 0.046. 0.738. 1.000. -0.637. Students/teachers Financial resources/teachers Outside funds/teachers Evaluation of companies. -0.298. -0.202. -0.520. -0.637. 1.000. 0.389. 0.032. 0.831. 0.909. -0.646. 0.522. -0.218. 0.726. 0.690. -0.257. 0.126. -0.189. 0.026. -0.214. 0.562. Financial Outside Evaluation of resources/teachers funds/teachers companies. . SSCI/teachers. 0.389. 0.522. 0.126. Math/teachers. 0.032. -0.218. -0.189. Nature/teachers. 0.831. 0.726. 0.026. 0.909 -0.646. 0.690 -0.257. -0.214 0.562. 1.000. 0.738. -0.071. 0.738 -0.071. 1.000 0.274. 0.274 1.000. CA/teachers Students/teachers Financial resources/teachers Outside funds/teachers Evaluation of companies. 4-3. Eigen value and ratio of contribution Initial eigen value. picked out components cumulative ratio of ratio of cumulative ratio Component Eigen value ratio of contribution % contribution % Eigen value contribution % of contribution % 1. 4.014. 50.169. 50.169. 4.014. 50.169. 50.169. 2. 1.741. 21.764. 71.933. 1.741. 21.764. 71.933. 3. 0.871. 10.891. 82.824 . . . 4. 0.740. 9.250. 92.074 . . . 5. 0.244. 3.044. 95.118 . . . 6. 0.204. 2.549. 97.667 . . . 7. 0.126. 1.577. 99.244 . . . 0.756. 100.000 . . . 8. 0.060. Remark: we picked out the component with more than 1.0 of Eigen value.. -59-.
(49) Supplement. 4-4. The plots of components. The plots of component 5. Eigen value. 4. 3. 2. 1. 0 1. 2. 3. 4. 5. 6. 7. Number of components. 4-5. Component matrix . Component. . 1. 2. SSCI/teachers Math/teachers. 0.581. 0.326. 0.010. -0.557. Nature/teachers. 0.906. 0.122. CA/teachers. 0.901. -0.148. Students/teachers Financial resources/teachers Outside funds/teachers Evaluation of companies. -60-. -0.697. 0.581. 0.946. -0.030. 0.806. 0.460. -0.112. 0.858. 8.
図

+7
関連したドキュメント
M AASS , A generalized conditional gradient method for nonlinear operator equations with sparsity constraints, Inverse Problems, 23 (2007), pp.. M AASS , A generalized
In summary, based on the performance of the APBBi methods and Lin’s method on the four types of randomly generated NMF problems using the aforementioned stopping criteria, we
In this paper, we extend the results of [14, 20] to general minimization-based noise level- free parameter choice rules and general spectral filter-based regularization operators..
As an approximation of a fourth order differential operator, the condition number of the discrete problem grows at the rate of h −4 ; cf. Thus a good preconditioner is essential
In the steady or streamline flow of a liquid, the total quantity of liquid flowing into any imaginary volume element of the pipe must be equal to the quantity of liquid leaving
The purpose of the Graduate School of Humanities program in Japanese Humanities is to help students acquire expertise in the field of humanities, including sufficient
Daoxuan 道 璿 was the eighth-century monk (who should not be confused with the Daoxuan 道宣 (596–667), founder of the vinaya school of Nanshan) who is mentioned earlier in
N 9 July 2017, the United Nations Educational, Scientific and Cultural Organization (UNE- SCO) inscribed “Sacred Island of Okinoshima and Associated Sites in the Munakata
