BEHAVIOR OF PESTICIDE IN TROPICAL
RIVERS WITH HIGH CONCENTRATED
SUSPENDED SEDIMENT
September 2014
ii
Behavior of pesticide in tropical rivers with high
concentrated suspended sediment
A dissertation submitted in partial fulfillment of the requirements for the
degree of
Doctor of Philosophy in Engineering
Special Doctoral Course on Integrated River Basin Management Interdisciplinary Graduate School of Medicine and Engineering
University Of Yamanashi, Japan
September 2014
iii ABSTRACT
Many developing countries, including the tropical ones, are undergoing rapid transformation of land use from forests to agriculture lands. However, the transformation of land use practices has led to soil erosion, introduction and intensive use of pesticide applications, and increased concentrations of suspended matter in river water. Although research has been conducted to understand pesticide behavior on passing from farmland to aquatic systems, less attention has been drawn to pesticide behavior in tropical river basins. It is very important to understand suspended sediments and farmers’ perceptions in order to study pesticide behavior patterns in tropical river basins. In addition, humic acid (HA) is one of the main components in organic matter in soil particulates, and it has a positive effect on the photodegradation of organic matter in water. The role of HA-bound suspended matter (HABSM) in pesticide photodegradation is still unknown, but is an important process that can be used to estimate the downstream toxicity of pesticides. This important element is not integrated in the existing models that are used to predict the aquatic toxicity of pesticides. Therefore, this study aimed at elucidating the effects of land use patterns, suspended sediment behavior, farmers’ perceptions, and HABSM on pesticide behavior.
The results of the studies conducted in small-scale (the Polwatta River) and large-scale (the Gin River) river basins revealed that major land use systems in the upper catchments are forests. Lower catchments have higher percentages of agriculture; other percentage of land use is replaced by forest cover and other landuse types. These transformations of land use patterns trigger increase in the suspended sediment in river water in the lower catchment area; low concentrations of suspended sediment and turbidity were recorded in highly forested upper catchments. Suspended sediment behavior under different land use patterns and assessment of the load from tropical rivers study was conducted to understand sediment behavior and loading in the Upper Kotmale Basin (UKB); intensive agricultural practices are followed in the most upper catena of the Mahaweli River basin. The major land use pattern was agriculture, and forests occurred at a very low percentage. Based on the study, it is estimated that, the suspended sediment (SS) load is 14,000 ton·yr-1, and that the patterns of nutrient loading and suspended sediment loading are
iv similar. Therefore, it can be assumed that pesticides, which are applied to farmlands, are also draining into river water.
To understand pesticide loading in farmlands,evaluation of farmers’ perceptions and land use patterns of pesticide loading from the upper catena of the tropical river study was conducted using Rapid Rural Appraisal (RRA), which utilized questionnaire surveys and personal interviews to collect data from the farmers in the UKB. The results recorded 46 commercial brands of pesticide and 25 active ingredients from the basins. Cluster analysis showed four utilized insecticides (diazinon, deltamethrin, sulfur, and chlorpyrifos), four fungicides (mancozeb, propineb, metiram, and chlorothalonil), and two weedicides (paraquate and metribuzin); the analysis was based on the usage of the active ingredient per acre. Selection of vegetable crops and cultivation seasons greatly impacted pesticide loading based on farmers’ perceptions. Toxic concentrations of chlorpyrifos and deltamethrin were observed in water, and the chlorpyrifos concentration exceeded the acute toxicity level for aquatic life (even with 1% of the pesticide load [scenario 4]). These chemicals drain into rivers from the pesticides remaining after the total pesticide usage in the basin. Therefore, farmers’ perceptions on pesticide applications are highly correlated to pesticide loading and toxicity levels in river waters. Photodegradation of chlorpyrifos with humic acid-bound suspended matter study was conducted to elucidate the effect of HABSM on the photodegradation of chlorpyrifos using artificial soil particulates covered in HA. Different experiments were carried out to understand the liquid phase with and without HABSM, including adsorption experiments. The results indicate that adsorption takes place within a short period. After adsorption, photodegradation was initiated, and the reduction percentages of 2.0 mg·L-1 ICC under adsorption with SM, adsorption with HABSM and photodegradation with HABSM were 19.3%, 17.7%, and 61.7%, respectively. This result suggests that HABSM is potentially a good catalyst for pesticide photodegradation under sunlight.
The present study examines the deterioration of the aquatic environment via land use transformation from forest to agriculture, farmers’ perceptions of the cropping calendar,
v and agrochemical selection and usage. The study also assessed the importance of HABSM for the photodegradation of pesticides in tropical rivers with highly concentrated suspended sediment. This study has helped gain some fundamental knowledge regarding the catalyst activity of suspended particulate matter on pesticide photodegradation. It is important to understand pesticide behavior in tropical rivers under highly concentrated suspended sediments and to estimate the downstream toxicity.
vi ACKNOWLEDGEMENTS
Behavior of pesticide in tropical rivers with high concentrated sediment is the theme of this thesis. It has been a long hard road and free education system in Sri Lanka was a strong foundation to achieve this great success story in my life. Therefore, I would like to dedicate my Ph D thesis, who sacrifices their life to protect free education system in Sri Lanka.
First, I would like to sincerely thank my supervisors Professor Futaba Kazama for continuous encouragements, guidance with theoretical background, working conditions, laboratory training and all kind of supports and advice provided over the past three years. It changes the thinking pattern and I have been able to develop and follow with my own ideas. Also, I would like to thanks to Global Center of Excellence (GCOE) program, International Research Center for River Basin Environment (ICRE), University of Yamanashi and Japanese Government to providing financial support to throughout of Ph D study period in Japan. A special thanks to Prof. K. Hirayama, Assoc. Prof. K. Nishida and Prof. Y. Sakomoto, listen and afford constructive advices as members of my advisory committee. I would sincerely acknowledge suggestions, critical comments and cooperation provided by ICRE leader Prof. Y. Sakomoto, sub-leaders, members, staff, and colleagues to accomplish this study.
I wish to acknowledge several members of Sri Lankan departments and institutes who supported to this study providing data, information, reports, and literatures. Such institutes include Meteorological Department, Irrigation Department, Pesticide Registrar Office, and National Aquatic Resource & Research Agency. Also I would like to thanks Mrs. Y. Yunayama and Mr. R.W. Fernando for her help with all things technical and Mr. J. Rademaker, Dr. Kevin Herric and Mrs. K. Fomichova to proof reading of my thesis. I also would like to thanks Mr. W.M.D. Weeakkodi, Mr. L.H.C.J. Kumara, Mr. I.G.T. Bandara, Mr. K. Kamal, Mr. & Mrs. Ekanayake, Mr. N. Ekanayake, Mr. A.G. Piyasiri, Mr. S. Sasitharan, Mr. Azmy, Mr. Sureshkumar, Mr. N. Wickramaarchchi, Mrs. S. Weerasekara, Mr. P. Jinadasa, Mr. G.V.H. Gotabaya, Mr. S. Jayanatha, Mrs. M. Kato, Mrs. W. Sano, Mrs. S. Maruyama, Mrs. M. Ishihara, Mr. T. Kamei, NARA-ESD
vii laboratory members and Kazama laboratory members for numerous help to succeed this study.
Finally, I am highly indebted to my wife Manuka Nishadi, my son Inura Apsara, my parent and for their support, love, encouragement and patience during these three years of research and writing
viii TABLE OF CONTENTS
ABSTRACT ... III ACKNOWLEDGEMENTS ... VI TABLE OF CONTENTS ... VIII LIST OF FIGURES ... XI LIST OF TABLES ... XIII LIST OF ABBREVIATIONS ... XIV
CHAPTER 1: GENERAL INTRODUCTION ... 1
1.1. PESTICIDE ... 1
1.2 PESTICIDE CONSUMPTION ... 2
1.2.1 Pesticide usage in the world and tropical zone ... 2
1.2.2 Pesticide usage in Sri Lanka ... 5
1.3 ORGANOPHOSPHORUS PESTICIDES ... 6
1.4 FATE OF PESTICIDES IN THE ENVIRONMENT ... 7
1.5 CHLORPYRIFOS ... 8 1.6. TRANSPORTATION PROCESSORS ... 10 1.6.1. Adsorption ... 10 1.6.2 Desorption ... 11 1.6.3 Bio-concentration ... 11 1.6.4 Volatilization ... 12 1.6.5 Leaching ... 13 1.6.6 Runoff ... 13
1.7 TRANSFORMATION AND CHLORPYRIFOS DEGRADATION ... 13
1.7. 1 Biotic degradation ... 14
1.7.2 Abiotic degradation ... 14
1.7.2.1 Hydrolysis ... 14
1.7.2.2 Photolysis ... 17
1.8. ROLE OF SUSPENDED PARTICLES AND HS ... 17
1.9 RESEARCH GAP AND OBJECTIVES ... 19
1.10 DISSERTATION OUTLINE ... 21
CHAPTER 2: SUSPENDED SEDIMENT BEHAVIOR UNDER DIFFERENT LAND USE PATTERNS AND ASSESSMENT OF THE LOAD FROM TROPICAL RIVERS ... 23
2.1 INTRODUCTION ... 23
2.2 METHODOLOGY ... 25
2.2.1 Study areas, sampling locations and surface water sampling ... 25
2.2.1.1 Polwatta river basin... 25
2.2.1.2 Gin River basin ... 26
2.2.1.3 Upper Kotmale Basin (UKB)... 27
2.2.2 Analysis of water samples ... 29
ix
2.3 RESULTS ... 31
2.3.1 Land use systems in the river basins ... 31
2.3.1.1 Polwatta River basin ... 31
2.3.1.2 Gin River basin ... 33
2.3.1.3 Upper Kotmale Basin ... 34
2.3.2 Turbidity and suspended sediment concentrations ... 37
2.3.2.1 Polwatta River ... 37
2.3.2.2 Gin River basin ... 38
2.3.2.3 UKB ... 40
2.3.3 Suspended sediment loading from UKB ... 41
2.4 DISCUSSION ... 42
2.5 SUMMARY ... 45
CHAPTER 3: EVALUATION OF FARMERS’ PERCEPTIONS AND LAND USE PATTERNS OF PESTICIDE LOADING FROM THE UPPER CATENA OF THE TROPICAL RIVER: A CASE STUDY IN THE UPPER KOTMALE BASIN (UKB) IN SRI LANKA ... 47
3.1 INTRODUCTION ... 47
3.2 METHODOLOGY ... 49
3.2.1 Study area ... 49
3.2.2 Data collections and analysis ... 50
3.2.2.1 Rapid Rural Appraisal ... 50
3.2.2.2 Questionnaire survey... 51
3.2.2.3 Data analysis ... 51
3.3 RESULTS ... 53
3.3.1 Characteristics of the respondents and farm lands ... 53
3.3.2 Farmers’ perceptions toward the selection of crops and pesticides ... 55
3.4 DISCUSSION ... 69
3.5 SUMMARY ... 72
CHAPTER 4: PHOTODEGRADATION OF CHLORPYRIFOS WITH HUMIC ACID-BOUND SUSPENDED MATTER ... 73
4.1 INTRODUCTION ... 73
4.2 METHODOLOGY ... 75
4.2.1 Materials ... 75
4.2.2 Experimental procedure ... 76
4.2.2.1 Photodegradation conduct with liquid humic acid... 77
4.2.2.2 Adsorption ... 78
4.2.2.3 Simultaneous experiments on photodegradation and adsorption ... 78
4.2.3 Extraction ... 79
4.2.4 Analysis of pesticide and data ... 79
4.3 RESULTS ... 80
4.3.1 Photodegradation of chlorpyrifos in the presence of liquid humic acid ... 80
4.3.2 Adsorption and photodegradation of chlorpyrifos with humic acid-bound suspended matter ... 82
x
4.4 DISCUSSION ... 85
4.5 SUMMARY ... 86
CHAPTER 5: GENERAL CONCLUSIONS AND RECOMMENDATIONS ... 87
5.1 GENERALCONCLUSIONS ... 87
5.2 RECOMMENDATIONS ... 90
REFERENCES ... 91
ANNEXURE 1: QUESTIONNAIRE SURVEY FORMAT PART-I ... 110
ANNEXURE 2: QUESTIONNAIRE SURVEY FORMAT PART-II ... 111
Section-1 ... 111
Section-2 ... 113
xi LIST OF FIGURES
Figure 1.1 Insecticide, fungicide, and weedicide consumption in Sri Lanka
5
Figure 1.2 Insecticide usage in Sri Lanka by category 6
Figure 1.3 Pesticide cycle 7
Figure 1.4 Chlorpyrifos structure 8
Figure 1.5 Chlorpyrifos metabolite pathways under different scenarios 16
Figure 1.6 Research framework 20
Figure 1.7 Cross section of pesticide transportation in a typical river basin with suspended sediment
21
Figure 2.1 Sampling locations of the Polwatta River basin 25
Figure 2.2 Sampling locations of the Gin River basin 27
Figure 2.3 Rainfall variation in the UKB basin 28
Figure 2.4 Sampling locations of UKB 29
Figure 2.5 Land use in the Polwatta River basin 32
Figure 2.6 Land use systems in the Gin River basin 33
Figure 2.7 Land use patterns of the Upper Kotmale basin 35
Figure 2.8 Mean turbidity in the Polwatta River 37
Figure 2.9 Mean suspended sediment concentration in the Polwatta River
38
Figure 2.10 Mean turbidity variation in the Gin River basin 39
Figure 2.11 Mean variation of suspended sediment concentration in the Gin River basin
39 Figure 2.12 Mean turbidity variation from different subbasins in UKB 40 Figure 2.13 Mean suspended sediment variation from different
subbasins in UKB
41 Figure 2.14 Results of cluster analysis for suspended sediment in UKB 41
xii Figure 2.15 Mean monthly loads (calculated) from Talawakelle to
Kotmale Oya
42 Figure 3.1 Pesticide (insecticide, fungicide, and weedicide) import to
Sri Lanka (2009-2012)
48 Figure 3.2 General characteristic of farming communities such as: (a)
age distribution of the farming community, (b) farm land size distribution, and (c) farming experience
53-54
Figure 3.3: Cluster analysis for differentiation of active ingredients based on usage: (a) insecticide, (b) fungicide, and (c) weedicide
56-57
Figure 3.4 Pesticide usage based on vegetables, land use, and the season in the basin: (a) insecticide, (b) fungicide, and (c) weedicide
57-58
Figure 3.5 Total pesticide usage in the basin organized by different active ingredients used based on different vegetable land use pattern
59
Figure 4.1 Schematic diagram of the experimental procedure 77
Figure 4.2 Remaining percentage of chlorpyrifos after photodegradation: 0.5 mg/L (a), 1.0 mg/L (b), and 2.0 mg/L (c) of chlorpyrifos with different LHA concentrations and different irradiation times.
80-81
Figure 4.3 Remaining concentration of 1.0 mg/L chlorpyrifos during four-hour adsorption with 0.3 g of DEAEC (SM) with ICC equal to 1.0 mg/L
82
Figure 4.4 Reduction of chlorpyrifos in different phases under 1.0 mg/L ICC in four hour period
83 Figure 4.5 Remaining percentage of 2.0 mg/L chlorpyrifos after
two-hour photodegradation and adsorption under different conditions.
xiii LIST OF TABLES
Table 1.1 List of tropical countries 3
Table 1.2 Mean pesticide usage in agricultural lands by country 4
Table 1.3 Characteristics of chlorpyrifos 9
Table 1.4 Bio-concentration factor (BCF) of chlorpyrifos in several fish species and Asellus aquaticus
12 Table 2.1 Land use types and their percentages in the Polwatta River
basin
32
Table 2.2 Land use percentage in the Gin River basin 34
Table 2.3 Land use types and their percentages in Nanu Oya, Agra Oya, and Dambagasthalawa Oya in UKB
36 Table 2.4 Mean turbidity and TSS in various rivers and streams in Sri
Lanka
45 Table3.1 Selected farmers from each subbasin of UKB for the
questionnaire survey
51
Table3.2 Summary of pesticide usage in UKB 55
Table3.3 Pesticide toxicity limits for different species 61-62
Table3.4 Pesticide content in the streams estimated using four different scenarios
63-65 Table3.5 Pesticide toxicity for different aquatic species based on
estimated remaining pesticide concentrations
xiv LIST OF ABBREVIATIONS
Addi. - Additional
A. DS. Agra Oya downstream
A. US. Agra Oya upstream
AI Active ingredient
Antig. Barb. Antigua Barbuda
M’ Chilli Capsicum annuum
BCF Bio concentration factor
°C Celsius
C Carbon
CEC Cation exchange capacity
cm Centimeter
CPF Chlorpyrifos
D. DS, Dambagasthalawa Oya Downstream
DEAEC Diethylaminoethyl cellulose
DLUS Dominant landuse system
DO Dissolve oxygen
DOM Dissolve organic matter
D. US Dambagasthalawa Oya Upstream
EC50 Concentration of a substance in an environmental medium expect
to produce a certain effect in 50% of test organisms in a given population under a define set of condition
FAO Food and Agriculture Organization
FPD flame photometric detector
Fren. Polyni. French Polynesia
GC Gas chromatography
GIS Geographical information system
Ha Hectare
HA Humic acid
HABSM Humic acid bound suspended matter
xv
HS Humic substances
ICC Initial chlorpyrifos concentrations
Kd Soil-water partition coefficient
Kdes Desorption coefficient
K. DS Kotmale Oya Downstream
kg Kilograms
KL Kiloliters
Kow Octanol/water partition coefficient
Koc Soil sorption coefficient
KPa Killo pascal
K. US Kotmale Oya Upstream
L Liters
LHA Liquid humic acid
LC Lower catchment
M Mean
m Meter
MC Middle catchment
MCM Million cubic meters
mm Millimeters
mPa Mega Pascal
MT Metric tones
NARA National Aquatic Resource Research and Development Agency
N. DS Nanu Oya Downstream
NOEC No observed effect concentration
NRESA Natural Resources, Energy and Science Authority of Sri Lanka
NTU Neplometric turbidity unit
N. US, Nanu Oya Upstream
OP Organophosphate
RRA Rapid Rural Appraisal
SD standard deviation
xvi
SL Sri Lanka
SM Suspended matter
SPE Solid phase extraction
sq. km Square kilometers
SSC Suspended sediment concentration
TCP 3,5,6-trichloropyridinol
TDS Total dissolves solids
TiO2 Titanium dioxide
TOC Total organic carbon
TPA Total pesticide amount
TSS Total suspended sediment
UC Upper catchment
UKB Upper Kotmale Basin
UMC Upper Mahaweli Catchment
USA United State of America
UV Ultra violet
Veg. Vegetables
WHO World Health Organization
WWii – World war -2
µg micro grams
Unit prefixes
m milli (10-3)
μ micro (10-6)
1
Chapter 1:
GENERAL INTRODUCTION
1.1. PESTICIDE
The “green revolution” immensely increased global pesticide usage after World War II. The application of large quantities of pesticides and fertilizers tremendously increased food production in order to meet the demand of rapid global population growth. However, the large quantities of pesticides applied to farmlands ultimately led to the pollution of adjacent environments and streams. As environmental problems gradually arose, many researchers focused on pesticide pollution and its impact on both humans and the environment (Friend and Franson, 1999; Tilman et al., 2002).
The term pesticide refers to any chemical that is intended to prevent, destroy, repel, or mitigate any pest. Different types of pesticides are available, and herbicides are used for the control of weeds and other unwanted vegetation. Furthermore, insects are controlled by a wide variety of insecticides, and the growth of mildew and molds is prevented by the use of different types of fungicides. Also, disinfectants are used to prevent bacterial outbreaks. Organophosphorus (OP) insecticides were primarily used when environmentally persistent organochlorine pesticides (e.g., DDT and dieldrin) were banned. This compound is used to control mice and rats that compete with humans for food. In addition to being potential nuisances, rodents also have a propensity for spreading diseases and acting as vectors for pathogens (NCPA, 1991; Helfrich et al., 2007; EPA, 2009; Gilden et al., 2010). Organophosphates have increasingly been used since the 1970s, and are generally short-lived, which makes them less likely to accumulate in plant or animal tissues. Moreover, these compounds are considered anticholinesterase insecticides, which cause the inhibition of nervous tissues and other neurophysiological abnormalities (Friend and Franson, 1999; Khalil et al., 2004).
2
1.2 PESTICIDE CONSUMPTION
1.2.1 Pesticide usage in the world and tropical zone
Many farmers intend to use pesticides to increase their crop yield, and synthetic pesticide productions have increased. Currently, one of the major environmental concerns is the contamination of water bodies from the discharge of agricultural lands and industrial plants. When pesticides are applied to farmland, portions of the pesticide are adsorbed and degraded by sunlight. However, the remaining pesticide may infiltrate streams or rivers via runoff or other mechanisms. While water flows from upstream to downstream, these pesticides undergo many changes due to hydrolysis, photodegradation, adsorption, microbial degradation, etc. Therefore, the fate of pesticides downstream depends on these processes (Walia et al., 1988; Guardino et al., 1998; Kale et al., 1999; Pandey and Singh, 2004; Randhawa et al., 2007; Wang et al., 2007).
Several hundred pesticides are currently used worldwide (Sadasivam and Thayumanawan, 2003; Pimental, 2005). Globally, 4.6 million ton of chemical pesticides are sprayed annually into the environment. Furthermore, mass applications of pesticides are used in the world, with approximately 500 active ingredients that are highly poisonous to the environment. Although, only 1% of sprayed pesticides are effective, 99% are applied and released into non-target soils, water bodies, and the atmosphere; and these substances are eventually absorbed by almost every organism (Zhang et al., 2011). Worldwide pesticide production is increasing, and Agrow (2007) reported that pesticide consumption is expected to increase by 0.8% (total sales were approximately US $32.9 billion in 2006).
Most developing countries lie in tropical areas between the Tropic of Cancer (23°27′N) and the Tropic of Capricorn (23°27′). Table 1.1 lists the countries that are in tropical zones. The following are shared characteristics of the regions: 1) rain occurs throughout a year, 2) the sun rises in a perpendicular motion and sunlight occurs throughout the year at constant level, 3) hot and humid conditions
3 favor the growth of numerous weeds, insects, fungi, and other pathogens that are harmful to economically important agricultural and plantation crops (Riehl, 1979; Racke et al., 1997).
Table 1.1: List of tropical countries
Tropical America Tropical Africa Tropical Asia/Pacific
Bolivia Angola Australia (Northern)
Brazil Cameroon Bangladesh (Southern)
Colombia Central African Republic Cambodia
Costa Rica Congo China (Guangzhou)
Cuba Ethiopia India (Southern)
Dominican Republic Ghana Indonesia
Ecuador Ivory Coast Malaysia
Guatemala Kenya Myanmar
Honduras Mali Maldives
Jamaica Mozambique Oman
Mexico (Southern) Nigeria Papua New Guinea
Nicaragua Somalia Philippines
Panama Sudan Saudi Arabia
Paraguay (Northern) Tanzania Sri Lanka
Peru Zaire Taiwan (Southern)
Puerto Rico Zambia Thailand
Venezuela Zimbabwe Vietnam
Yemen
Source: Racke et al., 1997
In addition, tropical temperature regimes are much warmer (year-round average) and exhibit much less seasonal variation than temperate zones. The mean monthly temperature variation of the average three warmest and three coldest months is 5°C or less (Cobley and Steele, 1984). Therefore, instead of viewing the tropics as a uniformly hot zone, the temperature constancy, rather than the absolute temperature, is the predominant distinguishing characteristic (Racke et al., 1997).
4 Table 1.2: Mean pesticide usage in agricultural lands by country
O Country A . I ./ h a / y r No Country A . I ./ h a / y r No Country A . I ./ h a / y r
1 Bahamas 372.292 39 Moldova 11.114 77 Guyana 1.348
2 Mauritius 246.177 40 Austria 10.346 78 Armenia 0.916
3 Japan 151.000 41 Poland 9.791 79 Kyrgyzstan 0.789
4 Korea 127.127 42 Argentina 9.320 80 Togo 0.566
5 Taiwan 99.462 43 Turkey 8.630 81 Iraq 0.560
6 Suriname 98.910 44 Slovakia 8.487 82 Burundi 0.550
7 Cyprus 98.696 45 Fren. Polyni. 8.385 83 Burkina Faso 0.503
8 Costa Rica 66.864 46 Mexico 8.242 84 Ethiopia 0.500
9 Italy 54.469 47 Honduras 8.220 85 Australia 0.468
10 Netherlands 47.506 48 Ukraine 8.146 86 Paraguay 0.468
11 Portugal 41.411 49 Cameroon 8.094 87 Pakistan 0.452
12 Israel 38.005 50 Finland 7.582 88 Tajikistan 0.429
13 Thailand 33.619 51 Greece 7.517 89 Kazakhstan 0.404
14 Malaysia 31.957 52 Uruguay 7.382 90 New
Cale doni a
0.355
15 Belgium 30.671 53 Norway 7.268 91 Azerbaijan 0.304
16 Guatemala 28.751 54 Ireland 7.161 92 Nepal 0.293
17 Slovenia 27.613 55 Sweden 7.114 93 Brazil 0.289
18 Malta 25.512 56 Gambia 6.623 94 Montenegro 0.277
19 Ecuador 24.402 57 Lithuania 6.453 95 Yemen 0.223
20 France 23.640 58 Romania 5.732 96 Tunisia 0.214
21 Bangladesh 21.086 59 Peru 5.159 97 Syrian 0.212
22 Colombia 20.295 60 USA 5.084 98 Bhutan 0.207
23 Germany 19.550 61 Estonia 5.000 99 Oman 0.196
24 Belize 19.459 62 Bolivia 4.775 100 Lesotho 0.174
25 Jordan 18.007 63 Latvia 4.606 101 Malawi 0.171
26 El Salvador 17.995 64 Ghana 4.390 102 Mozambique 0.139
27 Panama 17.799 65 Canada 3.751 103 Kenya 0.058
28 Hungary 15.940 66 Sri Lanka 3.506 104 Madagascar 0.041
29 Dominican Rep ubli c
15.872 67 New Zealand 3.308 105 Guinea 0.031
30 Bahrain 14.957 68 Iran 2.896 106 Senegal 0.030
31 Nicaragua 14.544 69 Serbia and
Mon tene gro
1.981 107 Saudi Arabia 0.024
32 Denmark 13.797 70 Rwanda 1.963 108 Mauritania 0.022
33 Antig. Barb. 13.684 71 Vietnam 1.870 109 Iceland 0.020
34 Spain 13.060 72 Myanmar 1.835 110 Mali 0.006
35 Czech Rep ubli c
12.717 73 Macedonia 1.566 111 Niger 0.003
36 UK 12.277 74 India 1.493 112 China N/A
37 Chile 11.861 75 Algeria 1.482 113 Russia N/A
38 Switzerland 11.691 76 Morocco 1.384
Source: FAO data base (http://faostat3.fao.org/faostat-gateway/go/to/download/R/RP/E) (Except China, Russia, etc.)
5 During the early 70s and 80s, the use of pesticides in developing tropical countries was negligible. However, in recent years, with the advent of modern agricultural technology in the developing countries, continuous increases in pesticide application have been recorded for economically important crops. Consequently, intensive agriculture (e.g., irrigated rice and other crops) has given rise to many environmental problems (Sethunathan, 1989). Table 1.2 lists the present mean pesticide usage for agricultural lands (active ingredient·ha-1·yr-1) in
different countries.
1.2.2 Pesticide usage in Sri Lanka
The 1980 Pesticide Control Act No. 33 was established to control and manage pesticide usage in Sri Lanka. Its regulations fully complement the international code of conduct regarding the distribution and use of pesticides. Figure 1.1 illustrates insecticide, fungicide, and weedicide use in Sri Lanka.
Source: FAO pesticide database
Figure 1.1: Insecticide, fungicide, and weedicide consumption in Sri Lanka 0 500 1000 1500 2000 2500 Quan tit y of A ct iv e In gr edi en t (t on s) Years
6 Based on the pesticide categories, the highest imported pesticides are fungicide > weedicide > insecticide. The consumption of different insecticide categories in Sri Lanka (Figure 1.2) indicates that organophosphates are the most highly used category compared to other insecticides.
Source: FAO pesticide database
Figure 1.2: Insecticide usage in Sri Lanka by category
1.3 ORGANOPHOSPHORUS PESTICIDES
Globally, many farmers are reliant on pesticides to increase crop production without the side effects of toxic chemicals that could negatively affect farmers, consumers, and the environment. The insecticidal properties of OP compounds were first discovered by Gerhard Schrader in the 1930s, and the compounds were developed for pesticide use in the 1940s. They were first used as an agricultural insecticide, but were later considered potential chemical warfare agents. OPs have replaced persistent organochlorine pesticides due to their lower toxicity and lower persistence in mammalian systems; these characteristics have led to their increased use since the 1970s (Taylor, 1996; Kamath and Rajini, 2007; Kazemi et
al., 2012). However, the toxicity of OP pesticides is higher than agrochemicals
that are used for pest management. The most commonly used agrochemicals are 0 100 200 300 400 500 600 Qua nt ity o f A ct iv e In gr edi en t (t on s) Years
Chlorinated hydrocarbons Organophophates
Carbamates Others
7 chlorpyrifos, dimethoate, malathion, methyl parathion, phosphamidon, phorate, fenitrothion, monocrotophos, etc.
1.4 FATE OF PESTICIDES IN THE ENVIRONMENT
When pesticides are applied to farmland, some portions are adsorbed into plants, and the remainder is degraded; thus, the chemicals leach into ground water or the runoff enters the nearest stream, river, reservoir, or lake. Figure 1.3 illustrates the major paths of the pesticide cycle and the circulation of pesticides in the air, water, and soil.
Figure1.3: Pesticide cycle (Racke et al., 1997)
The processes affecting pesticide fate can generally be grouped into two categories: transformation and transportation. Transportation processes are more of a concern because they often result in the movement of a pesticide away from the site of application. The transportation of pesticides is mainly via volatilization, spray drift, leaching, run off, sedimentation, and adsorption (Branham et al.,
8 1993; Branham, 1994, Gardner et al., 2000). Transformation results in the alteration of the chemical structure of the pesticide. This is generally a desirable process since most organic pesticides used today are rendered less toxic or non-toxic by these processes. Also, transformation occurs mainly through biological degradation (especially microbial degradation), plant uptake, photodecomposition, and chemical degradation (mainly by oxidation, reduction, and hydrolysis). Biological mechanisms in soil and living organisms utilize oxidation, reduction, hydrolysis, and conjugation to degrade chemicals (Branham
et al., 1993; Gordon and Crumpton, 1998; Dunnivant and Anders, 2006; Kerle et al., 2007). Many byproducts are produced along chlorpyrifos metabolite
pathways, and the main metabolite is TCP (Figure 1.5). The processes that are potentially associated with runoff are biological degradation (especially microbial degradation), physical (mainly adsorption), chemical degradation (mainly via oxidation, reduction, and hydrolysis), and photodecomposition (Racke, 1993).
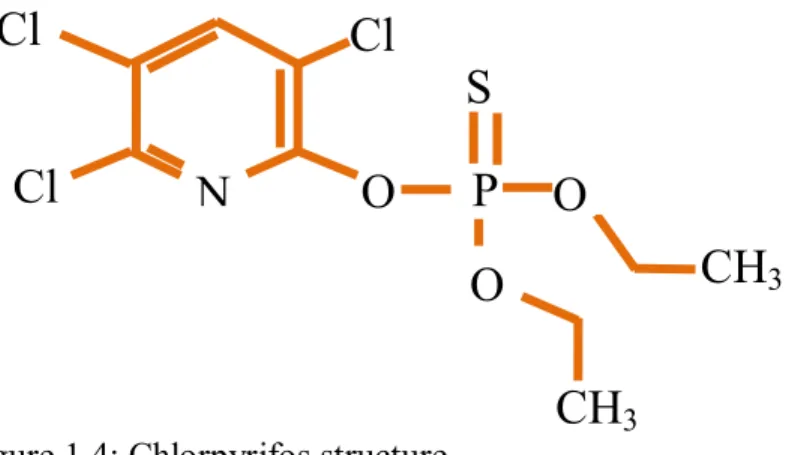
1.5 CHLORPYRIFOS
Chlorpyrifos A one of the broad spectrum chlorinated organophosphate insecticide is chlorpyrifos [O,O-diethyl-O-(3,5,6-trichloro-2-pyrpyridinyl) phosphorothioate] which is broadly consume across the world (Figure 1.4).
Figure 1.4: Chlorpyrifos structure
Chlorpyrifos is manufactured by DowElanco, formerly the Dow Chemical Company, and common brand names are Dursban (for household products) and
CH
3CH
3O
P O
S
O
Cl
Cl
Cl
N
9 Lorsban (for agricultural products). Chlorpyrifos is directly toxic to the nervous system, and it is transformed to chlorpyrifos-oxon or 3,5,6-trichloro-2-pyridinol (TCP) in different pathways. Chlorpyrifos adversely affects more organisms than the pests that it is designed to kill, and the effects on non-target organisms include both acute and chronic hazards (Caroline, 1994; Cox, 1994; Cox, 1995a; Cox, 1995b). Additionally, it has very low solubility in water (2 mg·L-1) with log
Kow and log Koc values of 4.82 and 3.73, respectively; however, the substance is
readily soluble in most organic solvents (USDHHS, 1997; Hindumathy and Gayathri, 2013). Table 1.3 lists some characteristics of chlorpyrifos.
Table 1.3: Characteristics of chlorpyrifos
Character Status
Pesticide type Insecticide
Substance group Organophosphate
CAS RN 2921-88-2
IUPAC name O,O-diethyl O-3,5,6-trichloro-2-pyridyl
phosphorothioate
Physical state White to brown colored crystals
Molecular weight 350.89
Solubility: in water (mg·L-1) 2.0 Solubility: in methanol (mg·L-1) 290,000
Vapor pressure(25 °C) 1.8710-5 Torr
Henry’s law constant 6.210-6 atm - m3·mol-1
Koc 8151
Source: Pesticide Properties Database (PPDB)
Many studies suggest that chlorpyrifos is transformed inside animals to chlorpyrifos-oxon, which is approximately 3000 times as potent against the nervous system than chlorpyrifos. Chlorpyrifos and chlorpyrifos-oxon kill insects and other animals (including humans) because of toxicity to the nervous system (Caroline, 1994; USDHHS, 1997); however, farmers use high levels of
10 chlorpyrifos to control pests and minimize crop loss. Continuous and excessive use of CPF has already led to widespread environmental contamination in many countries. This insecticide has been detected in marine sediments, streams, sumps, sloughs, rivers, urban storm drains, freshwater lakes, groundwater, fog, rain, and air (Gebremariam et al., 2012).
1.6. TRANSPORTATION PROCESSORS
1.6.1. Adsorption
In soil and water, adsorption parameters are shown at different magnitudes depending on the substances present in the soil and water. Chlorpyrifos has exhibited a strong affinity for soils and aquatic sediments based on the results of several batch experiments. Moreover, its adsorption affinity strongly correlates to the organic carbon content of the soil and sediment (Xing and Pignatello, 1997; Halimah et al., 2004; Gebremariam et al., 2011; Gebremariam et al., 2012). The
parameter is a factor related to the partitioning of a contaminant between the
solid and aqueous phases, and it is an empirical unit of measurement that attempts to account for various chemical and physical retardation mechanisms that are influenced by a myriad of variables. The metric is the most common measure
used in transport codes to describe the extent to which contaminants are adsorbed into soils (USEPA, 2004b).
Recent studies show different values in soil and sediment. Furthermore, the
value showed little correlation with soil pH, cation exchange capacity (CEC), and clay fraction, which are factors that are often reported to control pesticide adsorption. A similar lack of correlation between CPF adsorption and soil pH, CEC, clay content, and specific surface area has also been reported in several studies (Gebremariam et al., 2012). For instance, Muhamad et al. (2005) showed that the adsorption value of chlorpyrifos in clay was 52.6 L/kg. Thus, the associated adsorption coefficient ( adjusted for soil organic C content)
was calculated as 2783 L/kg for the clay soil. The adsorption into glass may have had a significant effect that resulted in a low apparent desorption value. Similarly,
11 Gebremariam et al. (2011) recorded adsorption partition coefficients ( ) that varied from 35.2 to 123.3 L/kg, which were strongly correlated with organic carbon in the soils and sediments (R2 = 0.91, p < 0.005). The adsorption of chlorpyrifos into suspended sediment is essential to the prediction of the fate of chlorpyrifos in aquatic environments, especially rivers. Therefore, the adsorption process is required to understand pesticide behavior in aquatic environments.
1.6.2 Desorption
The fate and environmental impact of soil- and sediment-bound pesticides, to a large extent, are dependent upon the rate at which the pesticide returns to the aqueous phase. Consecutive desorption and serial dilution are two approaches that are generally followed when a batch equilibrium technique is used to determine desorption parameters of a pesticide from contaminated sediments or soils (Gebremariam et al., 2011). Muhamad et al. (2005) reported that ranged from 0.14 L/kg to 0.05 L/kg. Lower values were indicative of lower
desorption since the molecules are strongly adsorbed onto the particles. The study also reveals that was very low, which suggests a strong binding of chlorpyrifos to clay soil. Therefore, chlorpyrifos has very limited mobility in clay soil.
1.6.3 Bio-concentration
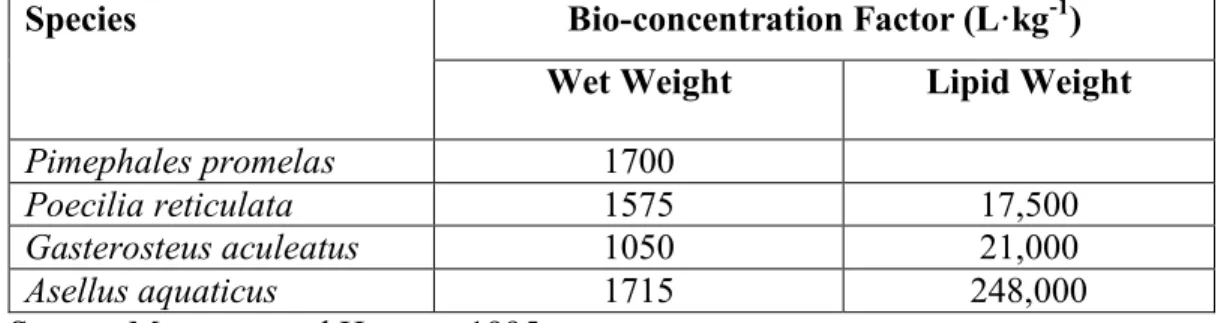
Persistent hydrophobic chemicals may accumulate in aquatic organisms through different mechanisms, including the direct uptake from water by gills or skin (bio-concentration), the uptake of suspended particles (ingestion), and the consumption of contaminated food (biomagnification). Even without detectable acute or chronic effects using standard ecotoxicity tests, bioaccumulation should be regarded as a hazard in itself (Oost et al., 2003). Lal and Lal (1987) reported that the bio-concentration factor (BCF) was inversely proportional to insecticide solubility. Table 1.4 illustrates several BCF values of chlorpyrifos in selected aquatic species (Montanes and Hatturn, 1995), and shows that BCF levels are very high level depending on the lipid weight. Studies determined that the uptake and elimination rates of chlorpyrifos for the guppy (Poecilia reticulata) were
12 7000 ± 2000 L·kg−1·d−1 (uptake) and 0.40 ± 0.11 d−1 (elimination) based on lipid weight (Deneer, 1993). Veith et al. (1979) also reported that the measured log BCF value for chlorpyrifos of 2.67 was determined using data from a 35-day flowing water study focused on mosquito fish.
Table 1.4: Bio-concentration factor (BCF) of chlorpyrifos in several fish species and Asellus aquaticus
Species Bio-concentration Factor (L·kg-1)
Wet Weight Lipid Weight
Pimephales promelas 1700
Poecilia reticulata 1575 17,500
Gasterosteus aculeatus 1050 21,000
Asellus aquaticus 1715 248,000
Source: Montanes and Hatturn, 1995
1.6.4 Volatilization
Pesticides enter the atmosphere either by application drift, post-application vapor loss, or wind erosion of pesticide treated soil. The pesticides and their photodegradation products may be transported long distances before the removal processes of atmospheric deposition (wet and dry) return them to the earth’s surface (Tiryaki and Temur, 2010). The vapor pressure and Henry’s law constant indicate significant volatility characteristics of chlorpyrifos. Volatilization is just as important as chemical and microbiological degradation regarding the dissipation of pesticides from soil and plants (Eisenreich et al., 1981; Wolters, 2003). Pesticides volatilize into the air as vapors from different sources such as plants, water, and soils; therefore, it decreases the available amount of a pesticide for pest control (Doull, 1989; Wolters, 2003; Holland and Sinclair, 2004). In addition, Zamora et al. (2003) recorded that chlorpyrifos residues detected in the rain were due to volatilization from fumigation. It is sufficiently clear that the volatilization effect contributes to the transportation of chlorpyrifos via air to other locations.
13
1.6.5 Leaching
Muhamad et al. (2010) reported that, after applying double the recommended dosage during a dry period, the leaching of chlorpyrifos in plantations was only limited to the top layer of soil (depth < 20 cm) in a depth profile series. In addition, no chlorpyrifos was detected in soil layers after seven days. However, Ismail et al. (2004) reported that chlorpyrifos was detected below 50 cm depth in a soil profile during the rainy season. Moreover, groundwater contamination with a maximum chlorpyrifos concentration of 7.089 μg/L was recorded in agricultural fields in Sri Lanka (Menike et al., 2012).
1.6.6 Runoff
Pesticides are either mixed in the water or bound to eroding soil. The runoff-soil interaction zone (the top 0.5–1 cm of soil) is susceptible to surface runoff, and several factors may affect the amount of pesticide present within this zone. These include the type of pesticide application, soil type, physiochemical properties, formulation type of the pesticide, and field half-life of the pesticide (Tiryaki and Temur, 2010). Discharge, TSS, and pesticide concentrations in water samples increased during the rainfall events (Moore et al., 2002), and DOM can interact with pesticides to enhance their transport (Li et al., 2005). During the rainy period, Moore et al. (2002) reported maximum TSS and chlorpyrifos concentrations of 236 mg/L and 0.03 µg/L, respectively. Tiryaki and Temur (2010) reported that, pesticides may move with runoff as compounds dissolved in the water or attached to soil particles. Furthermore, Menike et al. (2012) discovered a maximum chlorpyrifos concentration of 3.71 μg/L in surface water with contamination from an agricultural field.
1.7 TRANSFORMATION AND CHLORPYRIFOS DEGRADATION
The degradation of pesticides is the breaking up of parent material into different residuals via various processes. Pesticides are mainly degraded by biotic and abiotic degradation processes that are further discussed below. After degradation, toxic pesticide compounds breakdown into non-toxic or toxic compounds, and
14 Figure 1.5 illustrates the degradation of chlorpyrifos into various metabolites via different pathways. These processes can occur in plants, animals, soil, air, or water through both abiotic and biotic degradation (USDHHS, 1997; Hui et al., 2010; Hindumathy and Gayathri, 2013). Many of the factors controlling pesticide degradation generally apply; however, it is important not to overlook the unique properties of specific compounds (Sims and Cupples, 1999). Chlorpyrifos dissipates very rapidly from the water column, while dissipation from sediments in streams, rivers, lakes, or ponds is similar to that observed in soils (Racke, 1993).
1.7. 1 Biotic degradation
Many pollutants in the environment are degraded along different pathways. Biotic degradation is one pathway, and it is known to play a vital role in determining the overall fates of organic pollutants. This process not only helps raze the original pollutant form, but also alters its physicochemical properties; thus, affecting its transport and distribution behavior throughout various parts of the environment (Matsumura, 1989). Gilani et al. (2010) studied the effect of soil microorganisms on chlorpyrifos degradation in soil, and the calculated persistence was 100 ppm– 1000 ppm in the soil. The growth of Bacillus sp. was sensitive to chlorpyrifos treatment (the number of colonies decreased), whereas the number of Klebsiella sp. colonies were enhanced under the same experimental conditions. The results suggest that chlorpyrifos remained stable in the soil, and no significant changes were observed in the active ingredient of the chemical that was recovered.
1.7.2 Abiotic degradation 1.7.2.1 Hydrolysis
Wu and Laird (2002) reported that the rate of chlorpyrifos hydrolysis to TCP was affected by both water chemistry and by the presence and nature of suspended colloids in aqueous systems. On the contrary, sorption of chlorpyrifos on colloidal materials reduced the rate of chlorpyrifos degradation, and apparently blocked the
15 hydrolysis of chlorpyrifos to TCP. The results suggest that suspended sediment may act as a buffer to maintain sorption of chlorpyrifos at low levels in the aqueous phase. This is achieved by retarding degradation and by slowly releasing adsorbed chlorpyrifos into the aqueous phase until an equilibrium state is reached as chlorpyrifos degrades (Site, 2001; Wu and Laird, 2002).
16 Figure 1.5: Chlorpyrifos metabolite pathways under different scenarios (Racke, 1993)
OH Cl N Cl Cl O - Cl N Cl Cl P S OC2H5 OC2H5 OH Cl N Cl Cl O - Cl N Cl Cl P S OC2H5 OC2H5 O - Cl N Cl Cl P S OC2H5 OC2H5 Chlorpyrifos TCP
Desethyl Chlorpyrifos Chlorpyrifos oxon
CO2
TMP
Organic acid
Conjugates
17
1.7.2.2 Photolysis
Photolysis is a chemical reaction in which a chemical compound is broken down by photons (Lee, 2005; Halsall, 2007) from a light source (UV or visible light). Many researchers reported the photolysis of different toxic chemicals based on experiments with artificial light. The degradation of a substance via photolysis depends on the total energy absorbed in specific wavelengths (Moesta and Murabayashi, 1993). Kralj et al. (2007) reported that UV photolysis (Suntest apparatus with Hg and Xe lamps) was efficiently used for OP degradation during the last few decades, and the study also revealed diverse kinetics, mechanisms, and the formation of by-products. In some cases, even more toxic oxons were formed. Direct photolysis of chlorpyrifos follows a pseudo-first-order reaction (Schwarzenbach et al., 2003)
Muhamad (2010) found that direct photodegradation has been shown to be an inefficient system for the degradation of chlorpyrifos. Therefore, catalytic photodegradation becomes necessary. The catalytic photodegradation of TiO2
follows a pseudo-first-order reaction. The photocatalytic activity increases with increased catalyst concentrations, and then reaches an optimum value. At a concentration greater than the optimum, the activity was decreased (Muhamad, 2010; Sivagami et al., 2013). The UV-radiation used in this work was more efficient than sun or visible light as a source of radiation. In natural water samples, the rate of catalytic photodegradation of chlorpyrifos was lower than that in distilled water in the following order: distilled water > ground water > lake water > river water > drinking water (Muhamad, 2010).
1.8. ROLE OF SUSPENDED PARTICLES AND HS
Wastewater and natural water (e.g., rivers and streams) contain dissolved and suspended matter. Ludwig et al. (1996) stated that dissolved organic carbon fluxes are mainly related to drainage intensity, basin slope, and the amount of carbon stored in the soil of river basins. Particulate organic carbons are based on sediment fluxes, which principally depend upon drainage intensity, rainfall intensity, and
18 basin slope. Tamooh et al. (2012) reported that the total suspended matter ranged from 0.6 mg/L to 7058 mg/L in tropical rivers. Moreover, 60% of estimated C flux and 34% of the sediment are transported by tropical rivers to the global oceans (Ludwig et al., 1996; Schlunz and Schneider, 2000; Tamooh et al., 2012). The fate of many pollutants in the aquatic environment is determined by the fate of the particulate matter with which they are associated (Mcdowell-Boyer et al., 1986). Moreover, the transport of mobilized colloids highly depends on the size and stability of dispersed colloids in the soil solution. Several experimental investigations have suggested that colloids may influence the transport of contaminants (Jones and Bryan, 1998; Kjaergaard, 2003).
Humic substances are comprised of three types of substances: fulvic acid, humic acid, and humin. Major potential sources of HS in aquatic systems are the soil horizon (rich in organic material), detritus accumulation in the aquatic ecosystem, floodplains and wetland interfaces, and aquatic primary producers (Steinberg, 2003). Furthermore, HS composition may be varied because of microbiological, chemical, and photochemical transformations of plant and animal residues (Rose and Waite, 2003). The fraction of HS that is soluble at high pH, but insoluble under acidic conditions, is dominated by humic acids (HA) (Claret et al., 2003; Rodrigues et al., 2009); and humic acid also represents the dominant portion of dissolved organic matter in freshwater (Rahman et al., 2010).
Many researchers found that liquid humic acid influences photodegradation of pesticides in aqueous media (Korte et al., 1987; Kamiya and Kamiyama, 1998: Steinberg, 2003; Loffredo and Senesi, 2006). For instance, Chen et al. (2010) examined the effect of humic acid (0–25 mg/L) as a possible photosensitizer of the photocatalytic mineralization of dimethoate. After 60 min of irradiation, the mineralization efficiency was shown to increase from 63.73% to 78.88% as the HA concentration increased from 0 to 5 mg/L. Further increases in HA led to a decrease in the photocatalytic efficiency, and the same results were recorded by several researchers, including Kamiya and Kamiyama (1998). This result was
19 attributed to reduced light transmittance stemming from excessive HA in the reactive solution and the competitive adsorption of HA for the active sites on the surface of the catalyst. Despite these results, the effect of humic acid-bound suspended matter on the photodegradation of pesticides has garnered little attention.
1.9 RESEARCH GAP AND OBJECTIVES
Rapid land use transformations from forests to agriculture lands have occurred in many developing countries, including tropical areas. The transformation of land use practices has led to soil erosion, introduction, and intensive use of pesticide applications, which increase the suspended matter concentration in river water. Many studies were conducted to understand the agriculture impact to the environment, because of increased agriculture activities to meet food and water demands for growing populations in developing countries. Also, numerous studies were conducted on water pollution from pesticides in developing countries. Humic acid (HA) is one of the main organic matter components in soil particulates, and it has a positive effect on the degradation of organic matter in water. The effect of HA bound to suspended matter (HABSM) on pesticide photodegradation is still unclear. When estimating the pesticide toxicity occurring downstream of rivers, HABSM is not considered under present methodologies. Therefore, this study focused on understanding the effects of land use patterns, suspended sediment, farmers’ perceptions, and HABSM on pesticide behavior under sunlight in tropical rivers. Hence, objectives are as follows:
Specific Objectives
1. To determine suspended sediment behavior in tropical rivers under different land use patterns.
2. To quantify pesticide loading based on farmers’ perceptions and land use patterns in river basins, and to elucidate the possible toxicity effects on downstream aquatic life.
20 3. To understand the effect of suspended sediment and humic acid on
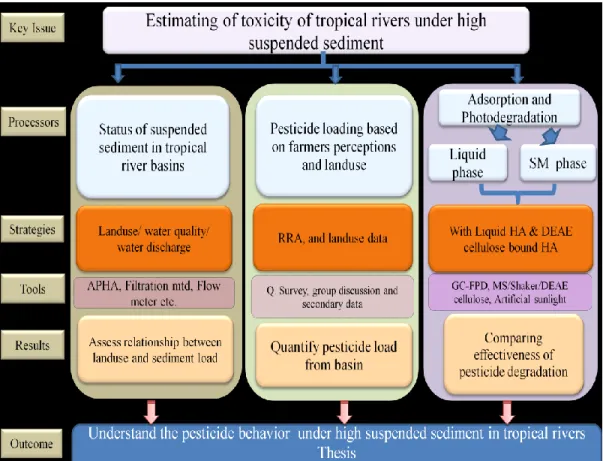
pesticide behavior (adsorption and photodegradation) in natural water. To achieve these objectives, a research framework was designed, and it is illustrated in Figure 1.6. The amount of sunlight penetrating the light-penetrating layer of the water table (Figure 1.7) depends on the suspended sediment concentrations in the river, and assumes that photodegradation is possible in that layer.
21 Figure 1.7: Cross section of pesticide transportation in a typical river basin with
suspended sediment
1.10 DISSERTATION OUTLINE
This thesis consists of five chapters. The brief outline of each chapter is given below:
Chapter 1: General introduction
This chapter provides a brief introduction including related literature reviews of tropical river basins, pesticide usage, research gap, research framework, and thesis objectives.
Chapter 2: Suspended sediment behavior under different land use patterns and assessment of the load from a tropical river
This chapter discusses the behavior of suspended sediment in three different rivers in a tropical area under diverse land use patterns. The suspended sediment load assessment of the Upper Kotmale basin is discussed in detail, and the details are interconnected with the pesticide photodegradation discussed in Chapter 4.
Light penetrating layer River
22
Chapter 3: Evaluation of farmers’ perceptions and land use patterns of pesticide loading from the upper catena of a tropical river
This chapter explains the pesticide load of an intensive agricultural field on a tropical river basin and the extent to which farmer-driven perceptions impact pesticide application. Land use was also examined, and varied crop types were utilized to determine the impact pesticide loading on agricultural fields. Moreover, the impact of downstream pesticide concentrations on different aquatic species was determined.
Chapter 4: Photodegradation of chlorpyrifos with humic acid-bound suspended
matter
This chapter discusses pesticide degradation under different scenarios such as photodegradation, adsorption, and the simultaneous effect of both processes in the liquid phase and humic acid-bound suspended matter. It describes the experimental results and the significance of photodegradation under humic acid-bound suspended matter when assessing the downstream toxicity in tropical rivers with highly concentrated suspended sediment.
Chapter 5: General conclusions and recommendations
This chapter presents the synopsis of results from this work followed by possible future research recommendations.
23
Chapter 2:
SUSPENDED SEDIMENT BEHAVIOR UNDER
DIFFERENT
LAND
USE
PATTERNS
AND
ASSESSMENT OF THE LOAD FROM TROPICAL
RIVERS
2.1 INTRODUCTION
Various anthropogenic activities influence the land use in river basins where the replacement of forests with impervious surfaces during urbanization significantly impacts watershed hydrology and riparian functions. One such concern is the decrease in water quality, which is generally associated with an increase in particulate matter in streams (Webb and Walling, 1992; Mulliss et al., 1996). The composition and concentration of particulate matter in the aquatic environment is affected by the source and pathway of sediment input (Eisma, 1993; Webster et al., 1990). Sediment discharge is increased when the product of water discharge and suspended sediment concentration (SSC) increases. Additionally, the mobility of coarse materials tends to increase with the larger flow velocities that are associated with larger discharges (Gray et al., 2000). The eroded soil is washed away with runoff and sediment in the beds of the reservoirs, which subsequently causes massive reductions in reservoir capacity. Moreover, reservoir spilling can occur after only a few inches of rainfall. Therefore, suspended sediment has long been recognized as an important contaminant affecting water resources (Osterkamp et
al., 1998), and analytical methods that measure the SSC also measure all of the
sediments in the entire water-sediment mixture sample (Gray et al., 2000).
Water quality can be affected when watersheds are modified by alterations in vegetation, industrialization, urbanization, or the conversion of forests and grasslands to agricultural lands (Turner and Rabalais, 1991; Vitousek and Farrington, 1997; Carpenter et al., 1998). Both point and non-point sources of nutrients contribute to the impairment of water quality. In flowing systems, nutrients may be rapidly transported downstream and the effects of nutrient inputs
24 may be uncoupled from the nutrient source, which further complicates nutrient source control (Turner and Rabalais, 1991).
Riverine habitats of Sri Lanka are rapidly being altered through many anthropogenic undertakings such as intensive agricultural activities, heavy agrochemical usage, damming, discharge of various waste materials and industrial effluents, and deforestation (Amarathunga et al., 2010a; Amarathunga et al., 2013). Very few studies have been conducted on Gin River, and no proper studies have determined water quality behavior in the basin. In addition, no studies have been carried out in Polwatta River; however, a few studies conducted in the Kotmale reservoir and Kotmale Oya basin (Piyasiri, 1995; De Alwis and Azmy, 1996; Abeysinghe et al., 2005; Bandara, 2013; Piyasiri, 1995) reported that the Kotmale reservoir is highly sensitive to eutrophication and the blooming effect resulting from nutrient loading from the Upper Mahaweli Catchment (UMC). Recently, several studies were conducted on water pollution and aquatic ecology in the UMC, and various factors were identified as contributing factors in the deterioration of water quality in rivers and reservoirs in Sri Lanka (Sureshkumar et
al., 2007; Weerasekera et al., 2010; Amarathunga et al., 2010b; Azmy et al.,
2010). The fertile and flat soils of the river floodplains tend to be highly modified by agricultural land use, urbanization, and industrialization (Smits et al., 2000), High suspended solids and turbidity can have an adverse impact on in-stream biological communities, and sediment deposition leads to the formation of appreciable bottom deposits (Christensen et al., 2000). However, there are no detailed studies focused on suspended sediment and the water quality of these basins.
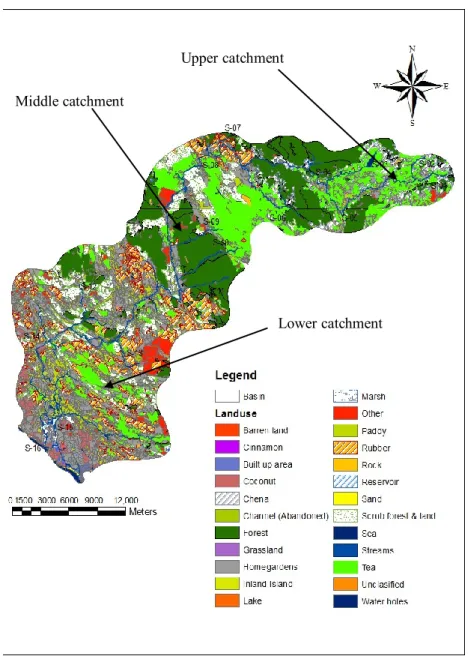
The Upper Kotmale basin is the most upper catchment of the Mahaweli River, and it represents the most vulnerable upper catena for tea and vegetable cultivations. When compared to land use patterns of the upper catchments, forests were found to be the most dominant land use pattern. However, agricultural crops are dominant in the Upper Kotmale basin. There have been very few studies focused
25 on land use impacts on water quality and the behavior of suspended sediment in river basins; thus, it is very important to understand the effects of suspended sediment from different land use systems in different river basins. Therefore, the objectives of this chapter were focused on the comparison of suspended sediment behavior in tropical rivers based on land use patterns and the assessment of the suspended sediment load.
2.2 METHODOLOGY
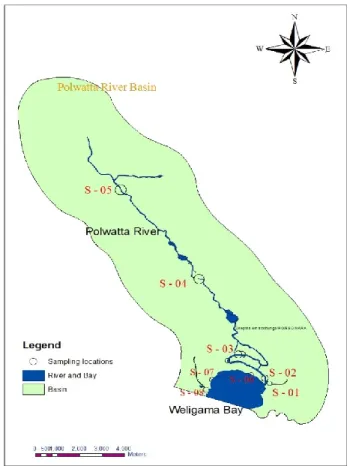
2.2.1 Study areas, sampling locations and surface water sampling 2.2.1.1 Polwatta river basin
The main river basin of the Weligama area is the Polwatta River, which discharges its water into Weligama Bay at a point called Polwatumodera.
26 The source of the Polwatta River is above Nakiyadeniya, which is known as Udugan Oya. The river has a catchment area of 235.7 km2, and it traverses nearly 32.19 km before flowing into the sea at Weligama Bay (Arumugam, 1969; NARA, 1993). The upper reach of the basin is being cultivated with rubber and tea. In the lower reaches, the river flows through large stretches of rice farmland and coconut plantations. At the mouth of the Polwatta River, fresh water flows from the top of the underlying ocean water, thus forming a salt wedge. Upward mixing of saline water into the outflowing river water has been reported (NARA, 1993). Random sampling techniques were used to collect samples from four sampling locations along the river 2, S-3, S-4, and S-5) and one sampling location from the bay (S-7) (Figure 2.1).
2.2.1.2 Gin River basin
The Gin River is a 113 km long river in southwest Sri Lanka, and its basin source is near the Deniyaya and Sabaragamuwa mountain ranges. The source of the river is at an elevation of approximately 4000 ft, and the river falls into the sea at Gintota, which is near Galle. The Gin river basin has a 932 km2 catchment area, and the region is subject to monsoonal weather conditions. The mean annual rainfall is over 2500 mm, and the average annual flow into the sea is approximately 2000 MCM (Arumugam, 1969). Major forest reserves lie upstream of this basin, including the Sinharaja, Kanneliya, Nakiyadeniya, Dediyagala, Dellawa, and Beraliya forests. Agriculture (mainly tea, paddy rubber, and oil palm plantations) and tourism are the major economies in this basin.
The Gin basin is one of the largest basins in Sri Lanka. Therefore, the basin is divided into three catchments: 1) upper catchment (second- and third-order feeding tributaries in the most upper part of the basin) in high elevated areas, 2) middle catchment (main river in elevated areas and second-order streams in the lower elevated areas), and 3) lower catchment (main river in the lower part of the basin). Surface water sampling at 16 locations was conducted over two years (10 months)
27 and included upstream, middle stream, and downstream locations in the Gin river basin (Figure 2.2).
Figure 2.2: Sampling locations of the Gin River basin
2.2.1.3 Upper Kotmale Basin (UKB)
The Upper Kotmale basin is located in the Nuwara Eliya District and within the Kotmale Oya subcatchment. The Kotmale subcatchment drains an area of 571 km2, which is approximately 18.8% of the total UMC area. Kotmale Oya is 70 km
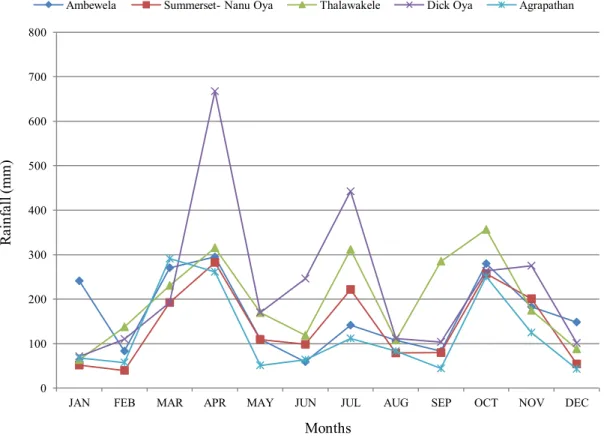
28 in length, which makes it one of the major tributaries of the Mahaweli River at the headwater. The average annual rainfall ranges from 2000 mm to above 4500 mm, and the elevation ranges from 600 m to 2524 m at Pidurutalagala. Figure 2.3 shows the rainfall variation in the UKB basin. The major part of its catchment contains vast areas of agricultural land including several tea estates. Agrochemicals used in these cultivated areas were leached into the reservoir from numerous non-point sources (De Alwis and Azmy, 1996). Figure 2.4 shows the UKB with Agra Oya, Dambagasthalawa Oya, and Nanu Oya, which are tributaries of Kotmale Oya that drain the western slope of the highest region of the hill country at an elevation between 2000 m and 2500 m
Figure 2.3: Rainfall variation in the UKB basin (Source: Meteorological department-2008) 0 100 200 300 400 500 600 700 800
JAN FEB MAR APR MAY JUN JUL AUG SEP OCT NOV DEC
R ai nf al l (m m ) Months
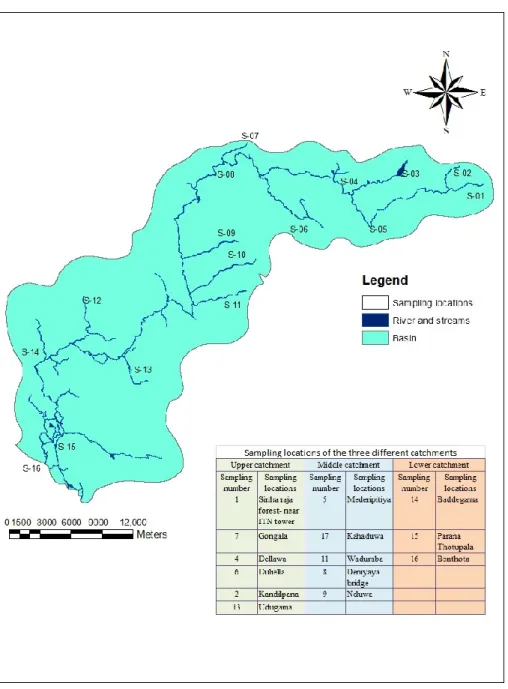
29 Figure 2.4: Sampling locations of UKB
Samples were collected on a monthly basis for over eight months at the following sampling locations (Figure 2.4): Dayagama (S-1) and Waverley (S-2) for Agra Oya; Blackpoll (S-6) and Palmerstone Division in Palmerstone Estate for Nanu Oya (S-7); Ambewela (S-5) and Waltream estate (S-4) for Dabagastlawa Oya; Lindula (S-3) and Talawakelle (S-8) for Kotmale Oya.
2.2.2 Analysis of water samples
In-situ analyses were conducted for the determination of pH (Orion 260A), dissolved oxygen (Orion 830A), turbidity (Hatch 2100P), and water temperature (thermometer). The flow rate was measured using a portable flow meter (FP101) in three different places at each sampling location at 50 cm–100 cm depths in streams that lacked gaug ing stations. The water depth was also measured using a measuring pole. Discharge data were collected from Ambewela, Calidonia, and
30 Talawakelle stream gauging stations in UKB. Two samples were collected and three replicated samples were used for laboratory and in situ analysis of each sampling location, and the mean value was used for data analysis. SSC was determined using a filtration method (Guy, 1969), and the gross weight of the sample (water-sediment mixture) was determined. The total sample volume was then filtered through a Whatman grade 934AH, 24-mm-diameter filter that had been inserted into a crucible and dried at 110 °C ± 2 °C before being cooled and weighed. The filtered sample was then dried until all visible water evaporated, and was subsequently heated for 1 hour at 110 °C ± 2 °C. The crucible was cooled in desiccators at room temperature before it was weighed. The weight of the remaining material in the crucible (mg) was then divided by the volume of the water-sediment mixture passed through the filter (L) to determine the concentration of the sample (mg·L-1). In addition, ammonia nitrogen, nitrate nitrogen, nitrite nitrogen, and orthophosphate contents were analyzed in accordance with the Standard Methods for Examination of Water and Waste Water (APHA, 1998).
2.2.3 Data analysis and computation of suspended sediment load
Data collected over two years (ten months) regarding Gin River turbidity and SSC were used for analyses. Additionally, samples collected over four months (main seasons throughout the year) were used for nutrient and SSC load calculations based on rainy and dry periods for Polwatta River and UKB (one year). The discharge is calculated using the following formula (equation 2.1)
--- (2.1),
where Q is discharge (m3·s-1), A is the cross-sectional area of the portion of the channel occupied by the flow, and is the average flow velocity (m·s-1). The
pollution load was calculated using equation 2.2 where L is load (kg·day-1), F is unit conversion factor, C is the pollutant concentration (mg·L-1), and D is discharge (m3·s-1) (Buchanan and Somers, 1969).