Adhesion Phenomena of Small Particles and Fine Wires
10
0
0
全文
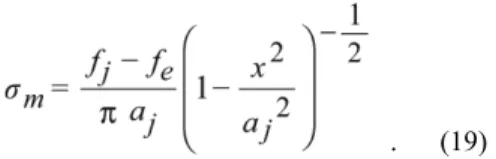
(2) Adhesion Phenomena of Small Particles and Fine Wires and the contact radius, which is the minimum in this stage is obtained by ,. (2). k is given by . ,. (3). Let us find the stress distribution ıy(r) in the y-direction along the contact interface, where r is the radius distance as shown in Fig. 1. It is now assumed that the contact radius aj is produced when F = Fj is applied to the two spheres under the condition of ǻȖ > 0. The Hertz solution ah is obtained when F = Fe is applied to them, i.e., the ah is obtained after ǻȖ = 0 is substituted for equation (1). In this stage, the aj is equal to the ah and Fe is greater than Fj. The relationship between the radius ah and the effective force Fe is expressed by. where k1 and k2 are elastic constants expressed by. ,. (4). respectively. Here, Ei and Ȟi are Young’s modulus and Poisson’s ratio of solid i, respectively (i = 1 or 2). When ǻȖ = 0, equation (1) agrees with Herts solution of elastic contact for spheres 7). The contact-radius aj for F = 0 is expressed by .. .. (5). (8). The stress distribution ıh(r) of the Hertz solution for ǻȖ = 0 along the radius direction r is expressed by. The force to separate two solids is given by ,. (7). (6). ,. ,. (9). where the ıh(r) is the stress component perpendicular to the contact interface (x axis). When the force F is reduced from Fe to Fj, keeping the contact area at aj = ah, Boussinesq’s stress ım(r), which means the stress distribution lost by the stress reduction, is given by. (10) . The stress distribution in the y direction along r axis is, therefore, obtained by .. (11). It is understood from eq. (11) that a tensile stress occurs in the periphery of the contact area when ǻȖ > 0 8). This is the traction which is the cause of stress induced diffusion, as stated later. 2.2 Adhesion theory between wire (cylinders). When ǻȖ > 0, the adhesional contact is produced between wires as well as spheres. The formulation of adhesional elastic contact for wires was stated elsewhere 9). The important equations will be shown in the present paper. It is. Fig. 1 Schematic illustration of two spheres (particles) or wires contacted. The radius of R2 = means sphere/ plane contact or wire/plane contact.. 12.
(3) Transactions of JWRI, Vol.43 (2014), No. 2 The separating force at that stage is given by. assumed that two wires are contacted in parallel with each other. The wire-contact in parallel is not realistic but when the radius R2 of one wire is infinite, it becomes realistic. Then, R = R1. When the force f per unit wire is applied to the top of wire in Fig. 1, half the contact width aj is expressed by. .. On the other hand, the stress distribution in the y direc tion along x axis is given by eq. (18) at the contact interface for Hertz contact under the condition of f = fe;. (12) ,. . (17). where the variables are shown in Fig. 1. The unit (dimension) of f is [N/m]. The Hertz solution ah for wires when .. ǻȖ = 0 and f = fe is given by .. (18). When the load is removed from f = fe to f =fj, Boussinesq’s stress distribution ım is obtained by. (13). This equation is obtained after ǻȖ = 0 is substituted into eq. (12). When ah = aj, the relationship between f and fe is obtained by .. (14). Boussinesq’s stress given by eq. (19) is the tensile stress distribution for the interface with a sharp notch 4). The stress distribution at the adhesion interface under f = fj is, therefore, given by. from equations (13) and (14). Half the contact width for f = 0 is given by ,. (15) .. and also the minimum half of the contact width is given by. .. (19). (20). Figure 2 shows the stress distributions at the contact interface. The adhesional elastic contact has a tensile stress the edge place absolutely as long as there remains a sharp notch (neck). The equations (1) to (20) are very useful to understand the elastic adhesion of small solids. The stress distribution which has tensile and compressive stress areas drives the vacancy diffusion along the adhesive interface.. (16). 3. Elastic adhesion Let us discuss the elastic adhesion of small solids for example a gold ball and wire, the material constants are shown in Table 1. At first, the plastic deformation is ignored. Figure 3 shows the elastic contact radius aj of spheres depending on the applied force F. The sign of F is taken to be positive when it is compressive. Fig. 3 (a) is for the sphere radius of R = 50μm and Fig. 3 (b) is for R = 0.5μm. As seen in Fig. 3, the contact radius of a sphere/ plane is larger than that of a sphere/sphere. As the radius R becomes small, the adhesion can be produced even if F is less than zero. The small particles cannot only easily adhere to each other but also to planes. The smaller they are, the more easily they adhere.. Fig. 2 Stress distribution at elastic adhesional contact interface betwwen wires.. 13.
(4) Adhesion Phenomena of Small Particles and Fine Wires. Table 1 Materials constant of pure gold.. Fig. 4 Half the contact width of elastic adhesional contact for gold wires.. (a). (a). (b) Fig. 5 Dependence of elastic contact radius aj and contact ratio aj/R on sphere radius R for gold particle. (a) Sphere/sphere when spheres (particles) have the same radius (R = R1 = R2, F = 0), and (b) Sphere/plane (R2 = , F = 0).. (b) Fig. 3 Adhesional elastic contact, depending on compresive force F and radius R for gold sphere. (a) R = 50 μm and (b) R = 0.5 μm.. 14.
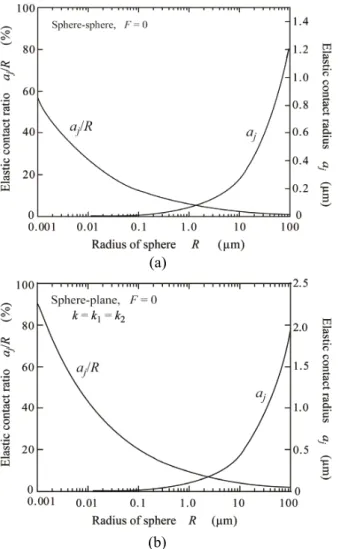
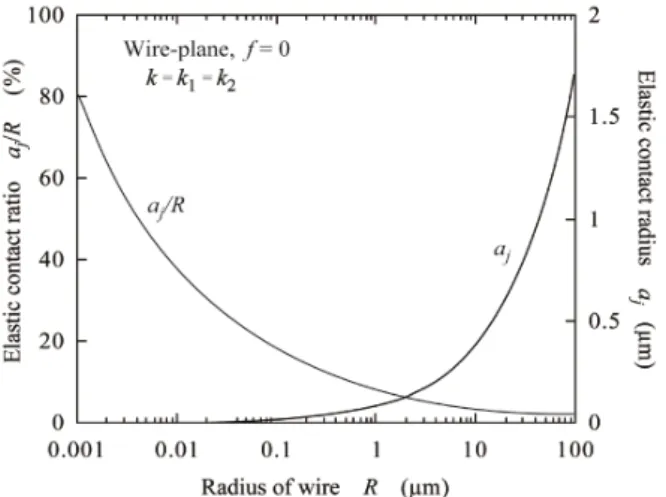
(5) Transactions of JWRI, Vol.43 (2014), No. 2 Figure 4 shows half the elastic contact width aj of ne wires with radius of 50μm. It is actually dif cult to adhere a wire to a wire in parallel to each other. Even if wire/wire contact can be made, the contact area is small as shown in Fig. 4. It is not so dif cult to adhere a wire to a plane under room temperatures. The room temperature bonding of ne wires to metal substrates was actually carried out in the previous study 4). As the radius R decreases, the contact area decreases. This is a natural phenomenon but the adhesion (contact) ratio aj/R increases. Figures 5 and 6 show the dependences of the adhesion (eleastic contact) radius (width) aj and the adhesion (elastic contact) ratio aj/R on R for small particles and fine wires, respectively. These calculated results were obtained under applied force free. Fig. 5 (a) is for adhesion between small Au-particles and Fig. 5 (b) is between Au-sphere and Au-plane. Fig. 6 is the case when ne Au-wire is contacted with a at Au substrate. As seen in Figs. 5 and 6, the adhesion ratio increases to be greater than 50% as the solids (particles or wire) become smaller, where R is the initial radius of solids. Pressureless adhesional bonding is possible when the solid reaches the nano level.. Figure 7 shows the stress distribution (calculated results) along the adhesional contact interface (in the x direction as shown in Fig. 1) when a ne Au-wire with R = 50μm is contacted to a at Au plane under f = 500 N/ m and T = 300 K, where T is the absolute temperature. The stress ı is a component in the y direction. The dotted curve is for elastic deformation and the solid curve is for elasto-plastic deformation. Half the elastic contact width aj is 1.42μm and half the elasto-plastic contact width aep is 1.67μm. The stress distribution is solved as the plane strain problem. The von Mises yield condition is expressed by ,. 4. InÀuence of plastic deformation on contact phenomena As solids become small, down to the sub micron level, a number of mobile dislocations decrease in the crystalline solids and nano solids have no mobile dislocations because they go out through the solid-surface. So, plastic deformation due to dislocation slip can be ignored in sub micron and nano solids. However, as the radius R of particles or wires increases up to a few tens of microns, the plastic deformation in uences the adhesional contact, i.e., the elasto-plastic contact can occur with increasing the applied force F or f.. (21). Fig. 7 Distribution of normal stress on contact interface between wire and plane for gold.. Fig. 6 Dependence of aj and aj/R on radius R for gold wire (R = R1, R2 = and f = 0).. Fig. 8 Contact width depending on applied compressive force (calculated results) for gold wire.. 15.
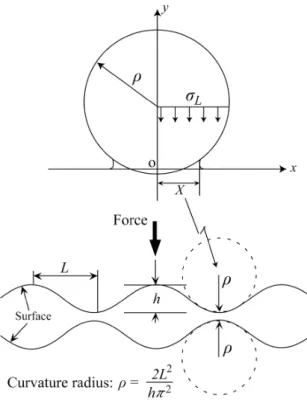
(6) Adhesion Phenomena of Small Particles and Fine Wires where ıy is the yield stress for plastic deformation under a uniaxial stress condition. The plastic deformation occurs at the area where ı is greater than ıyield = 294.7 MPa, increasing the contacted area. As seen in Fig. 7, the tensile stress occurs at the edge area bonded even if a compressive force f = 500N/m is applied to the wire. The summation of tensile and compressive stress is equal to the compressive force f. The applied pressure P is defined by P = f/2R. It is an average pressure and P = 5MPa in Fig. 5. Plastic deformation can influence the contact behavior even under a low pressure such P = 5 MPa. Figure 8 shows half the contact width a (calculated results4)) depending on the applied force f. The applied pressure is calibrated in the horizontal axis at the upper side of Fig. 8. The solid curves are for elastic contact and dotted curves for elasto-plastic contact. When P > 1MPa, the plastic deformation begins to contribute to the contact because the moble dislocation can exist in the solids. Fig. 10 Influence of surface roughness on intimate contact at room temperature (300K).. 5. Contact behaviors with fine surface roughness In general, the surface of solid has a surface roughness. In this session, the surface roughness contact is argued shortly. The two dimensional surface roughness is approximated to a sinusoidal curve illustrated in Figure 9. L is half the wave length and h is the surface roughness height. The curvature radius ȡ at the top of the surface roughness is given by 2L2/(h 2). Half the local contact width X was assumed to be obtained by the elastic contact. between fine wires with radius of ȡ. Figure 10 shows the percentage contact area X/L depending on the local pressure PL. When a fine wire adheres to the substrate, the contact interface is loaded by the stress greater than 300 MPa as shown in Fig. 7. It is, therefore, suggested that the contact area has no voids when the surface roughness has h less than 50 nm, even if the small solid has such a fine surface roughness. Furthermore, as h decreases to be less than 10 nm, the full contact can established under low pressure condition and even under pressureless condition 10). As the solid (sphere) becomes smaller than sub-micron, the surface roughness does not affect the elastic contact so largely because of adhesion force. Howerver, the surface roughness of the pad (substrate) has a very large influence on contact behavior. When L and h increase, it is natural that the influence becomes striking10). 6. Experimental procedure It is necessary to activate the surface of solid to produce the effect of Dupré energy of adhesion. In the present study, the adhesion tests were carried out under ultra high vacuum condition of < 1x10⁻⁸ Pa. Figure 11 illustrates the adhesional bonding apparatus used in the present study. A gold wire with a diameter of 100 μm and a purity of 99.99 mass % and a gold foil with a thickness of 130 μm were used as the bonding specimens. After the bonding specimens were degreased by acetone and ethanol, they were placed one by one in the introduction chamber and moved into the Ar ion irradia-. Fig. 9 Model of surface roughness for adhesional contacting.. 16.
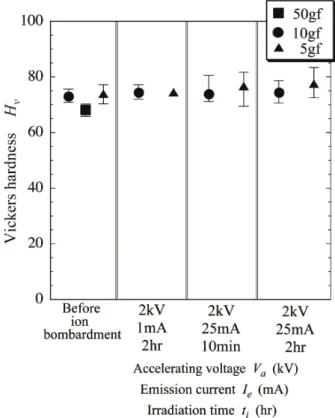
(7) Transactions of JWRI, Vol.43 (2014), No. 2 time is less than 10min, the maximum surface roughness does not become so large. However, it is seen in Fig. 12 (c) for Ie = 25mA, Va = 2kV and ti = 2hr that the surface is roughed by Ar ion irradiation (Rmax = 0.47 μm). Figure 13 shows the Vickers hardness Hv of gold foils before and after Ar ion irradiation. It is expected that Ar ion irradiation increases vacancy concentration. Because vacancies are point defects, Ar ion irradiation increases the surface hardness. The Vickers hardness after irradiation Fig. 11 Apparatus of room temperature bonding. The system consists of three chambers. Introduction chamber is to prepare the bonding specimens. Irradiation chamber is to activate the specimen's surface by Ar ion irradiation. Main chamber is to bond the specimens (wire and foil). tion chamber using the transfer rod. Before bonding tests, the influence of Ar ion irradiation on the bonding surface of the gold foils. The irradiation time ti and the emission current Ie were changed to investigate the surface roughness which would be changed by Ar ion irradiation. In that stage, the acceleration voltage Va of Ar ion irradiation was 2kV. The atmospheric pressure of the Ar ion irradiation chamber was kept to be 1x10⁻⁶ Pa during irradiation. After irradiation, the Au foil was moved to the specimen introduction chamber by the transfer rod as illustrated in Fig. 11. After that, a high purity nitrogen gas was introduced into the introduction chamber and the foil was held at a room temperature for twenty minutes. After the foil was moved out of the chamber, the surface roughness was measured by a stylus type surface roughness tester made by Kosaka laboratory Ltd. The moving speed of the stylus pin was 0.1 mm/s. The weight was 5gf and 10gf for the specimen ion-irradiated, and 50gf for the specimen before Ar ion irradiation. The bonding tests were carried out under room temperatures (25 27 C) and an atmospheric pressure of <1 x 10⁻⁸ Pa in the main chamber after Ar ion cleaning the bonding surfaces 4). The bonding pressure P (=f/2R) was changed from 2 to 20 MPa. The bonding time tB was defined as the time when the pressure P was applied to the specimen (tB = 60s). The bond-strength was measured by a pull tester.. Fig. 12 Surface pro les of gold foils. (a) before Ar ion irradiation, (b) after irradiation ( Ie = 1 mA, Va = 2 kV, ti = 2 hr, (c) Ie = 25 mA, Va = 2 kV, ti = 10 min, and (d) Ie = 25 mA, Va = 2 kV, ti = 2 hr.. 7. Experimental results and discussion Figure 12 shows surface profiles of gold foils after Ar ion irradiation which are compared with the surface profile before Ar ion irradiation. The maximum surface roughness Rmax was 0.21 μm, before Ar ion irradiation. After Ar ion was irradiated on to gold foils, the surface was rough but when the emission current is less 1mA or the irradiation. Fig. 13 Vickers hardness of surface of gold foil.. 17.
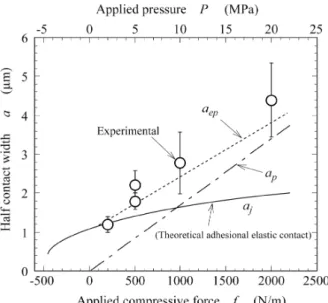
(8) Adhesion Phenomena of Small Particles and Fine Wires A compressive stress exist at the central area but a tensile stress remains at the peripheral area, i.e., vacancy concentration differs between the central area and peripheral area. Vacancy diffusion occurs to reduce the difference of elastic stress (residual stress) 5). It was also found that the bonded area did not increase by holding the specimens after adhesion 11). Because of room temperature (low temperature), the vacancy diffusion flow is controlled predominantly by the interface self-diffusion. The maximum tensile stress ımax is produced at the peripheral area by elastic deformation. The time tr required for the interface self-diffusion to reduce ımax by the same quantity must be proportional to the increase of bond-strength. The relationship between time tr and the interface (boundary) self-diffusion Db is expressed by. seems to be a little greater than that of no irradiation. An increase of vacancy concentration around surfaces is very important when discussing the change in the bond strength after bonding. With respect to Vickers hardness, Ar ion irradiation did not affect surface hardness more than expected. Figure 14 shows comparisons between calculated and experimental results for Au-wire/Au-foil (Au pad). The applied pressure P is given by P = f/2R, where f is the applied compressive force and R is wire radius (R = 50μm). Au small solids with a diameter of 100 μm have the yield stress condition ıyield = 294.7 MPa, although the smaller solids with sub micron diameters have higher yield stress or become a perfect elastic solid because they have few glissile (mobile) dislocations in the bulk. In Fig. 14, because of ıyield, plastic deformation contributes the adhesion. The experimental points agree with the dotted line of elasto-pastic adhesional contact aep, where aep is half the elasto-plastic adhesional contact width, ap is half the plastic contact width and a is half the contact width. However, the experimental points agree with half the elastic adhesional contact aj at P < 3 MPa. Initial adhesion of small solids will be governed by elastic deformation if the bonding pressure is zero. When R is less than 1μm, Figs. 5 and 6 will predict that the elastic adhesion occurs. Figure 15 shows experimental results of change in the bond-strength Fp (pull strength) with holding time after adhesional bonding under room temperature (298K) and P = 5MPa. As seen in Fig. 15, the bond-strength increases with the holding time. As the holding temperature increases, the bond-strength increases rapidly 5). This is due to stress induced vacancy diffusion. At first, the central area bonded has a higher density than the peripheral area.. ,. (22). where E is Young’s modulus, T is the absolute temperature and Const is a symbol which means constant. The interface self-diffusion is given by. ,. (23). where Dbo is the frequency factor, Qb is the activation energy of interface self-diffusion, and R is the gas constant. If the increase of bond-strength after bonding is due to the recovery of residual strain by the interface self-diffusion, the time required to increase the same quantity of the bond-strength is given by. ,. (24). where k is a constant. The time tr required to obtain Fp. Fig. 15 Experimental results of change in bond (pull)strength with the holding time t after bonding.. Fig. 14 Comparison between calculated and experimental results for Au wire / Au foil (plane).. 18.
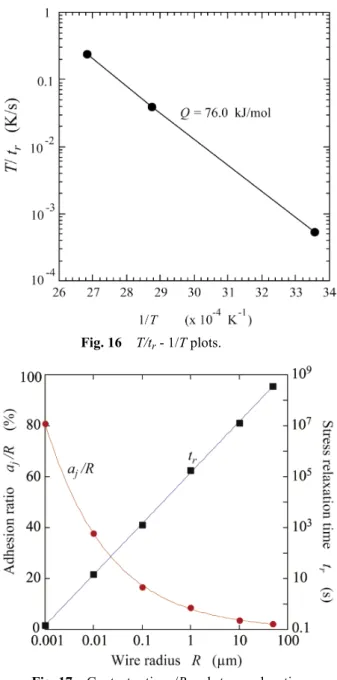
(9) Transactions of JWRI, Vol.43 (2014), No. 2. Fig. 16. after stress induced diffusion. The stress induced diffusion can quickly occur by reducing the radius R of small solids. It is rather difficult to form one nano wire (or particle) contact bonding and measure the bond strength. In the present study, it has not been carried out. However, we can easily deduce that the stress relaxation time tr required to remove the maximum tensile stress ımax decreases down to several seconds as the radius R decreases to nano level. Also, the bond-ratio aj/R goes up to 80% 4,5,10). Figure 17 shows the stress relaxation time tr and the ratio aj/R, depending on the radius R. For nano level small solids, pressureless room temperature bonding can be produced. This can be residual stress free in a short time. The initial adhesional contact area of small particles and fine wires will be predicted by equations (1) and (12), respectively. However, residual stress occurs around the contact interface. This residual stress changes vacancy concentration. As a result, the stress induced diffusion occurs along the contact (bonded) interface and the bonded area can be residual stress free.. T/tr - 1/T plots.. 8. Summary The theory of adhesional contact joining for small solids (particles and wires) was introduced and the contact behaviors were discussed. Elastic contact phenomena can be predicted well but as the actual adhesion of small solids can be influenced by plastic deformation and diffusion, it is difficult to understand the actual adhesion behavior. Also, surface activating processes such as a Ar ion irradiation changes the surface situation of solids. Materials constant may be changed. The surface roughness is largely changed by strong Ar ion irradiation. It is important to activate the bonding surface, i.e., to remove oxide surface film but too much ion irradiation gives a damage to the surface. As solids (particles) becomes small to nano level, the bonding ratio goes up to 80% and the relaxation time required to remove the residual stress becomes several seconds. The adhesional bonding behavior of small solids were reviewed based on the experimental results carried out under the conditions of low bonding pressures and an ultrahigh vacuum. A lot of unknown problems have remained about adhesion such as tribology. The further researches are expected to solves a lot of these problems.. Fig. 17 Contact ratio aj/R and stress relaxation time tr, depending on wire radius R. = 45mN per milli-meter length (45N/m) is measured in Fig. 15 and then it is substituted to eq. (24) to obtain the activation energy Q, assuming that E is constant. Figure 16 shows a T/tr-1/T plot to obtain Q value, where T is a holding temperature in Kelvin. The value is 76 kJ/mol which is less than that of Qb = 87kJ/mol. Qb consists of the formation energy of vacancy and the migration energy of vacancy. If the Ar ion irradiation increases the vacancy concentration (standard level), Q can be less than 87 kJ/ mol. As the volume self-diffusion Qv is 170-174 kJ/mol, the volume diffusion can be ignored. After the adhesional bonding, the bond-strength can increase by stress induced self-diffusion. Even if the adhesional contact is produced by elastic contact, the reversible bonding (separation and bonding) cannot be produced. References 1) S. Matsusaka, Y. Takahashi, and K. Inoue, "Room Temperature Adhering Process of Au Fine Wire," Proc. Mate, Vol.5, JWS, Yokohama, Feb. 4-5 (1999), pp. 11-14. 2) S. Matsusaka, Y. Takahashi and K. Inoue, "Study on the. 19.
(10) Adhesion Phenomena of Small Particles and Fine Wires 8) K. Takahashi et al., "In uence of the Stiffness of The Measurement System on the Elastic Adhesional Contact," J. Adhesion Sci. Technol., Vol. 9 (1995), pp. 1451-1464. 9) Y. Takahashi, "Adherence of Fine Wires ----Solution by Energy Minimum Principle and Nano Adhesioal Bonding," Trans. JWRI, Vol. 30 No. 2 (2001) pp.23-31. 10) S. Matsusaka and Y. Takahashi, "In uence of Surface Roughness on Room Temperature Adhesional Bonding," Novel Materials Processing (MAPEES ‘04), edited by S. Miyake Elsevier, (2005) pp. 415-418. 11) Y. Takahashi, K. Uesugi and S. Matsusaka, "Room Temperature Micro Adhesional Bonding,"Trans. JWRI, Vol. 32, No. 1 (2003) pp. 59-62. 12) Y. Takahashi, "Adhesion of Small solids and Fine Wires for Micro and Nano Interconnects," Nanofair 2014, Proc. of 10th International Nanotechnology Symposium, organized by Fraunhofer, IWS, Dresden July, 1-3 (2014) p. 54.. Time Dependence of Bond Strength in Room Temperature Bonding," Quatary J. JWS, Vol. 17, No. 4 (1999), pp. 583-588. 3) Y. Takahashi, T. Nakamura, and K. Nishiguchi, "Dissolution Process of Surface Oxide Film during Diffusion Bonding of Metals," J. Mater. Sci., Vol. 27 (1992), pp. 485-495. 4) Y. Takahashi and S. Matsusaka, "Adhesional Bonding of Fine Gold Wires to Metal Substrates, " J. Adhesion Sci. Technol., Vol. 17, No. 3 (2003), pp. 435-451. 5) Y. Takahashi and K. Uesugi, "Stress Induced Diffusion along Adhesional Contact Interface," Acta Materialia Vol. 51 (2003), pp. 2219-2234. 6) Y. Takahashi, T. Doki and S. Matsusaka, "Room Temperature Micro-bonding of Fine Wires to Foils, " Solid State Phenomena, Vol. 127 (2007), pp. 277-282. 7) K. L. Johnson, K. Kendall and A.D. Roberts, "Surface Energy and the Contact of Elastic Solids," Royal Soc. London, A324 (1971), pp. 301-313.. 20.
(11)
図
+4
関連したドキュメント
The only thing left to observe that (−) ∨ is a functor from the ordinary category of cartesian (respectively, cocartesian) fibrations to the ordinary category of cocartesian
The inclusion of the cell shedding mechanism leads to modification of the boundary conditions employed in the model of Ward and King (199910) and it will be
We show that a discrete fixed point theorem of Eilenberg is equivalent to the restriction of the contraction principle to the class of non-Archimedean bounded metric spaces.. We
Now it makes sense to ask if the curve x(s) has a tangent at the limit point x 0 ; this is exactly the formulation of the gradient conjecture in the Riemannian case.. By the
Keywords: continuous time random walk, Brownian motion, collision time, skew Young tableaux, tandem queue.. AMS 2000 Subject Classification: Primary:
By the algorithm in [1] for drawing framed link descriptions of branched covers of Seifert surfaces, a half circle should be drawn in each 1–handle, and then these eight half
Answering a question of de la Harpe and Bridson in the Kourovka Notebook, we build the explicit embeddings of the additive group of rational numbers Q in a finitely generated group
Then it follows immediately from a suitable version of “Hensel’s Lemma” [cf., e.g., the argument of [4], Lemma 2.1] that S may be obtained, as the notation suggests, as the m A
