The Dark Matter search at KamLAND
A. Kozlov1, D. Chernyak1, Y. Takemoto1,4, K. Fushimi2,
K. Imagawa3, K. Yasuda3, H. Ejiri4, R. Hazama5, H. Ikeda6,
K. Inoue6, S. Yoshida7, R. A. Etezov8, Yu. M. Gavrilyuk8,
V. V. Kazalov8, V. V. Kuzminov8 and S. I. Panasenko9
1
Kavli Institute for the Physics and Mathematics of the Universe (WPI), The University of Tokyo, Kashiwa, Chiba 277-8583, Japan
2 Graduate School of Science and Technology, Tokushima University, Tokushima 770-8506,
Japan
3 I.S.C. Lab., Ibaraki, Osaka 567-0085, Japan 4
Research Center for Nuclear Physics, Osaka University, Ibaraki, Osaka 567-0042, Japan
5 Graduate School and Faculty of Human Environment, Osaka Sangyo University, Daito,
Osaka 574-8530, Japan
6
Research Center for Neutrino Science, Tohoku University, Sendai, Miyagi 980-8578, Japan
7 Department of Physics, Osaka University, Toyonaka, Osaka 560-0043, Japan 8
Institute for Nuclear Research, Russian Academy of Sciences, Moscow, 117312 Russia
9 Karazin Kharkiv National University, Kharkiv, 61022 Ukraine
E-mail: alexandre.kozlov@ipmu.jp, kamlandzen@gmail.com
Abstract. Recent data from the DAMA/LIBRA phase-2 confirmed detection of a signal with independent Dark Matter (DM) annual modulation signature at a 12.9 σ CL. Our attempts to verify the DAMA/LIBRA DM observation claim led to construction of underground clean rooms at the KamLAND site and specialized laboratory for production of NaI(Tl) detectors. Current status of these facilities, methods used to grow ultra-low background NaI(Tl) crystals, and radio-purity of the latest NaI(Tl) DM detector prototype are discussed.
1. Introduction
Despite of being unobserved by a direct measurement DM manifests itself in multiple observations of galactic rotation curves, gravitational lensing, formation and collisions of galaxies [1]. One of the views on DM is that it consists of unknown particles that weakly interact with ordinary matter. However, mass of the hypothetical DM particles, strength of the DM coupling to the ordinary matter, and the DM density near the Sun are unknown. A direct search for the particle DM is based on assumption that the Solar system motion with velocity of a 232 km/s relative to the DM halo results in collisions between DM and atoms in the detector. These collisions cause weak signals due to the energy loss or de-excitation of recoiled atoms in the range (0-100) keV that is dominated by a strong background from natural and artificial radioactivity sources. However, there is one rather specific experimental effect associated with the Earth motion around the Sun that serves as a model-independent signature for the DM signal. Depending on the season, the Earth motion either increases or decreases velocity of the detector
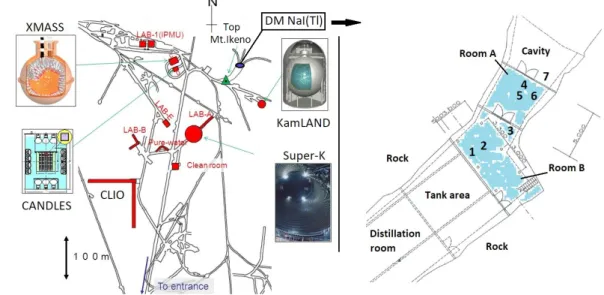
Figure 1. (Left) Location of the Dark Matter NaI(Tl) laboratory at the KamLAND area of the Kamioka mine. (Right) Positions of detector systems installed (or to be installed) at the clean rooms A, B and nearby mine cavity: 1) the NaI(Tl) detector test setup, 2) the HPGe detector, 3) the CIPIC radon detector, 4) the thermal neutron detector, 5) the fast neutron detector, 6) the NaI(Tl) DM detector, 7) the NaI(Tl) radon monitor.
that uses a 250 kg segmented NaI(Tl) detector located at the Gran Sasso underground laboratory [2]. Recently, the DAMA/LIBRA collaboration released a new phase-2 result that confirmed existence of the modulated signal consistent with the DM hypothesis (at 12.9 σ level) in the (1-6) keV range [3]. The key questions for the particle physics community are how to test this observation and establish its unquestionable connection to the DM scattering off atoms.
We intend to repeat the DAMA/LIBRA experiment using a large NaI(Tl) detector and test its findings. For that purpose, we prepared a facility for production of NaI(Tl) crystals, developed technology of the NaI purification, and constructed underground laboratory for the DM research at the Kamioka mine (see Fig. 1). We assume that the DAMA/LIBRA observation can be explained either by presence of the real DM signal or by not yet identified periodic background. The later option requires some clarification. In locations shielded by a thick rock layer background sources (excluding noise or dependence on various environmental parameters) that may have a seasonal modulation in intensity or energy distribution are limited to: a) cosmic-ray muons, b) neutrons from spontaneous fission and (α,n) reactions, and c) the radon decay. Measurements of seasonal variations in the muon flux performed at the LVD liquid scintillator detector located at the Gran Sasso laboratory allowed to exclude muons as a source of the modulated signal in the DAMA/LIBRA experiment [4]. For that reason, we investigate only neutrons and radon as potential sources of the periodic background. For example, if the water content in rocks changes periodically (with a time lag) following dry and wet seasons, or after melting of snow it affects the neutron energy spectrum and number of neutrons captured inside the rock. The radon activity in the underground air may have a seasonal component as well that leads also to variations in the number of neutrons produced in the (α,n) reactions. Effect from these factors may be more complex if underground water contains dissolved radon gas or 226Ra.
2. The research infrastructure at the Kamioka mine
Development of ultra-low background NaI(Tl) DM detectors required research infrastructure that was not readily available at KamLAND. Creation of the underground facility for the DM search began in the middle of year 2012 by joint efforts of Kavli IPMU (Tokyo University) and RCNS (Tohoku University). A heavy air pollution and disruption caused by a fire accident at KamLAND in November 2012 delayed this work for 2 years. High-class clean rooms (A, B) created at the KamLAND area of the Kamioka mine [5] as a result of this work are shown at the Fig. 1 (on the right). The rooms are located at the end of the tunnel constructed for the KamLAND liquid scintillator distillation system in the year 2006. Air in the each clean room is being circulated through HEPA and ULPA filters (made by Airtech Japan, Ltd.) 24 hours per
day at a rate of 70 m3 per minute. Air quality in the room A reached level of ∼150 particles
per m3 (a 0.3 µm in size and larger), and ∼1500 particles per m3 in the room B. Both clean
rooms are connected to the centralized KamLAND system that supplies a dried, filtered,
radon-less air taken outside of the Kamioka mine [5]. A total influx of the radon-less air to the
clean rooms is about 10 m3 per hour that keeps a slight overpressure inside the rooms and
prevents penetration of a humid, radon-rich air from the mine cavity. Due to a low rate of heat dissipation in the surrounding rocks each room is equipped with an independent climate control system that maintains temperature at ∼18.0±0.5 deg Celsius. Monitoring and recording of the environmental parameters (temperature, humidity, and air pressure) is done by using digital sensors Bosch BME280 installed inside the clean rooms and in the surrounding mine cavity. The rooms are connected to a source of boiled-off nitrogen gas that supplies nitrogen to the entire KamLAND area. The AC power is supplied by a 17 kWatt AVR unit via online UPS modules of the double conversion type (SMART-UPS RT2400VA). Locations of detectors in the rooms A and B are shown at the Fig. 1.
2.1. The high purity germanium detector
Pre-selection of radio-pure materials and detector components is critically important part of
any low background experiment. For that purpose, we purchased a 260 cm3 coaxial high-purity
Germanium (HPGe) detector mounted into the ultra-low background ”U”-type cryostat (7905-30U-ULB) manufactured by Canberra U.S.A.. The detector is a p-type with a 30 keV detection threshold, the energy resolution (FWHM) is a 0.83 keV at 122 keV and a 1.74 keV at 1.33 MeV, and the Peak/Compton ratio is 91:1. Upon our request, the cryostat endcap was made of a 5N5 pure Aluminum that contains less than a 0.35 ppb of U and Th, and a longer cooling line (433 mm) was installed to accommodate a thick passive shielding. The HPGe detector is used together with the Canberra analog DAQ system composed of the multi-channel analyzer MP2-1U, spectroscopy amplifier 2026, high voltage power supply 3106D, and CAEN NIM 8301 crate. Our choice of the traditional analog system instead of a digital DAQ was based on a private information from other HPGe users that noise from digital DAQs becomes a dominant background below a 100 keV. Existence of the digital noise problem was later confirmed by a direct comparison of our detector system with identical Canberra HPGe detectors used at the
Kamioka mine. For example, background at a position of the 46.5 keV γ-ray from the 210Pb
decay was ∼5 times higher if digital DAQ was used.
The HPGe detector was installed inside of a 2 m×2 m×2 m clean tent made of a 0.5 mm-thick anti-static film. The tent is continuously flushed with the radon-less air that passes through a
passive ULPA filter. Together with a HEPA filter (a 5 m3 per min) installed inside of the
tent it keeps air quality at a level of ∼30 particles per m3 (a 0.3 µm in size). We designed
our own passive shielding to achieve the lowest possible background and a large inner volume. The outer shielding is made of lead: a 30 cm-thick bottom part, a 25 cm-thick walls and the
were stored underground for the last 12-15 years that led to, e.g., a low 60Co background rate
(1.6±0.3 event/day). Due to a long exposure of shielding materials to 222Rn and dust we took
several steps to minimize the surface contamination. Dimensions of the most low background lead bricks (2 inch×4 inch×8 inch) allowed us to use a milling machine for removal of a thin layer from the surface during brick’s size adjustment. In addition, all lead bricks were cleaned
for a 20-30 min in three subsequent baths with a weak HNO3 acid followed by a double pure
water baths, and ethanol cleaning. The copper was cleaned by acid-etching in accordance with the procedure described at [6]. Since the time of installation a pure nitrogen gas is supplied to
the copper shielding at a rate of a 5.5 L/min to avoid the222Rn background.
2.2. The neutron detectors
Neutrons penetrate through relatively large buffers and are considered to be one of the most dangerous sources of background for the DM search. We intend to use two detectors to monitor the fast and thermal neutron flux at the location of the NaI(Tl) DM detector, and to be able to conclude whether or not neutrons can be a source of the periodic background. Both (scintillator)
detectors use the nuclear reaction6Li + n → α + t + 4.78 MeV for capture of thermal neutrons.
Thermal neutron flux measurements are performed using detector based on a 0.32 mm-thick (0.5 m × 0.5 m) EJ-426HD2-PE2 scintillator sheet produced by Eljen Technology, U.S.A..
The EJ-426HD2-PE2 scintillator is a homogeneous mixture of 6LiF and ZnS(Ag) components
(mass ratio is 1:2) dispersed in a colorless binder and laminated from both sides by 0.25 mm-thick transparent polyester sheets. To achieve high neutron detection efficiency the Lithium
enriched in6Li to a 95% level was used. Signals from three 5-inch Hamamatsu Photonics R1250
photomultipliers used for detection of the light emitted by the ZnS(Ag) scintillator are fed directly to the 14-bit 100 MS/s CAEN waveform digitizer N6724F. The scintillator is placed onto the bottom of an air tight aluminum box (0.6 m×0.6 m×0.25 m) while R1250 photo-tubes are standing vertically on top of it. To maximize light collection inner surface of the box is covered with Tyvek paper sheets (a 97.9% light reflection coefficient [7]). The pulse-shape discrimination (PSD) technique is used to distinguish between neutron signals and α-particles
from the natural radioactivity. In addition, products of the 222Rn decay are removed from the
inner detector volume by continuous flow of a pure nitrogen gas at a rate of a 3 L/min. More details about the detector design and operation can be found at [8].
The fast neutron detector is based on organic liquid scintillator (LS) loaded with nat. Lithium
which contains about 7.6% of 6Li. The Li-loaded scintillator was originally developed for
directional detection of anti-neutrinos from the Earth ([9]) but it has several useful features for detection of fast neutrons as well. The LS is a mixture of pseudocumene and Surfactant TritonX-100 (volume ratio 82:18) with a small admixture of 2,5-Diphenyloxazole (PPO, a
5 g/L) and LiBr·H2O (a 37 g/L). The LS is contained in an air tight transparent acrylic tank
(30 cm×30 cm×30 cm) with a 1 cm-thick walls sealed with a nitrogen at a pressure above atmospheric. The scintillation light is detected by four 5-inch Hamamatsu Photonics R1250 photomultipliers directly connected to the 12-bit 250 MS/s CAEN DT5720 waveform digitizer. Fast neutrons produce a characteristic signature consisting of correlated in-time prompt and delayed signals (τ ∼89µsec). The PSD method can be also applied to both prompt and delayed signals to improve the signal-to-background ratio.
2.3. The radon detectors
To measure the222Rn activity in the air of clean-room and in the mine cavity we use two different
radon detectors. Inside the clean room we use Cylindrical Ion-Pulse Ionization Chamber (CIPIC)
[10] that allows to register α-particles from the decay of222Rn in the air and has a high energy
resolution (a 1.6-1.8% at FWHM). The NaI(Tl) detector is used to monitor intensity of a 609 keV
Figure 2. A schematic view of the CIPIC control system.
The CIPIC signals are a 10-20 msec long and can be affected by the acoustic noise and vibrations. We developed an effective suspension system of the CIPIC and a multi-layer sound-proof housing that solved the problem. Currently, we use one CIPIC installed in the room B to do daily measurements of the radon activity in the room A. The air samples are taken using the control system shown at the Fig 2. The air pushed by a dry pump (Pfeiffer Vacuum MVP-015-2) passes through a solenoid valve (Burkert FCS) and a 2 µm filter before entering the CIPIC. The solenoid valves and the dry vacuum pump are controlled using the digital I/O device (NI USB-6501) through the 8-ch. SPDT relay (NI ER-8). The digital pressure gauge is read-out by a 12-bit DAQ device Measurement Computing USB-201 with LabVIEW libraries. Air sampling is done remotely using the LabVIEW control software. For the data taking we use the LA-n10-12USB digitizer (Rudnev-Shelyaev) at a 3 MS/s sampling rate.
Measurement of the radon activity in the air of mine cavity is complicated by a high humidity
(∼94%) and high radon activity (a 1-2 kBq per m3) that make use of CIPIC or other α-particle
detectors rather problematic. The NaI(Tl) detector is not affected by a high humidity and its γ-ray detection efficiency was calculated using the GEANT4 package. The detector is made of a 2 cm×2 cm NaI(Tl) crystal and Hamamatsu Photonics H3178 photomultiplier directly connected to the 14-bit 500 MS/s CAEN DT5730 waveform digitizer. The detector is placed inside of a lead shielding that has holes for a free air exchange. Lead blocks the 609 keV γ-rays
originated from external sources that makes possible to measure the214Bi activity in a 9.7 L air
sample inside of the lead shielding.
It is important that the cavity around clean rooms is practically isolated from the main mine corridor or other mine areas and, therefore, is not influenced by the air flow through the mine tunnels. Isolation of the cavity allows to investigate interesting phenomena associated with flow of the radon gas from the rock without any disturbance. Until now, no other measurements of
the222Rn activity were done in sealed mine cavities of the Kamioka mine.
2.4. The NaI(Tl) detector test setup
We measure radio-purity of NaI(Tl) crystals at the test setup installed in the room B that includes a passive (Pb + Cu) shielding. The outer lead layer has a 30 thick bottom, a 15 cm-thick top and walls. A 5 cm-cm-thick inner copper shielding is made of a 4N pure, specially melted fresh electro-formed copper. The copper shielding is being continuously flushed with a boiled off nitrogen at a rate of a 3 L/min. During measurements, the NaI(Tl) crystal is attached to a single ultra-low background photomultiplier with a metal body (Hamamatsu R11065-20 or R13444X) that is connected to the data acquisition system shown at the Fig. 3. The DAQ consists of VME
Figure 3. (Left) The DAQ system for the NaI(Tl) crystal test setup. (Right) Low energy (0.6 keV and 3.8 keV) NaI(Tl) events and a typical photomultiplier noise pulse rejected by the TFA (right).
NIM modules used to reject noise pulses from the photomultiplier. One MoGURA digital board has 12 channels and system can be scaled up by adding more boards to the VME crate. The MoGURA has 4 gain channels called P, H, M, L that allow to detect signals in a wide range between a 0.1 mV and 10 V. It makes possible to detect signals from a 1 keV (the DM signal range) to several MeV that corresponds to the energy of α-particles emitted by unstable nuclei from the Uranium and Thorium decay chains. The MoGURA FADC sampling rate is a 1 GS/s in the P gain channel and a 250 MS/s in the other gain channels. A high sampling rate in the P channel is important for rejection of noise pulses from photomultipliers that compose more than 99.9 % of the data flow and are predominantly caused by a fast light emission in the photomultiplier. The noise problem was studied and discussed to some extend in [8]. However, use of the MoGURA alone with a low 1 keV energy threshold needed for the DM search results in a very high event rate and large data volume. To solve the problem, we added Timing Filter Amplifier (TFA) into the DAQ (see Fig. 3) that allows to reject events based on their charge. Low energy physics events composed of several photoelectrons gradually emitted by the NaI(Tl) scintillator can be selected by the TFA among single photomultiplier noise pulses (see Fig. 3). However, we observed also ”trains” of photomultiplier pulses that pass through the TFA and need to be removed during the off-line data analysis.
3. The facility for the NaI(Tl) crystal production
A full technological cycle required for production of the ultra-low background crystals is performed at the I.S.C. laboratory located in Osaka, Japan. Manufacturing of highly radio-pure crystals became possible after we developed a strict protocol focused on protection of the
detector materials from the 222Rn that is always present in the air at a level of a 10-15 Bq/m3.
To prevent accumulation of radon daughters purification of the NaI powder is done in a clean-room environment using a glove box flushed with a pure nitrogen gas. We use re-crystallization
from an ultra-pure water (a 18 MΩ cm−1) solution as a main purification process. A similar
technique was used by the COSINE collaboration [11]. The NaI(Tl) crystals are grown in
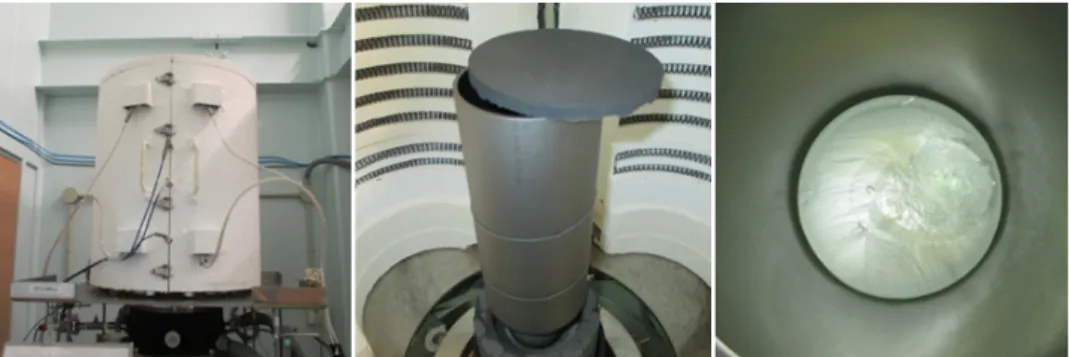
graphite crucibles with a specially shaped bottom part placed into a high temperature vacuum oven, shown at the Fig. 4. Prior to use the graphite material is purified inside of another vacuum oven at several thousands deg Celsius. The inner surface of the crucible is coated with a thin
Figure 4. From left to right: a high-temperature oven for NaI(Tl) crystals growth; the graphite crucible; detached NaI(Tl) crystal inside of the graphite crucible after cooling down.
graphite film. Advantage of the graphite crucible over commonly used platinum type is that separation of the NaI(Tl) crystal from the crucible occurs during cooling down period due to a factor of 10 difference in the thermal expansion coefficients between these two materials.
After an extended cooling down and annealing periods the outer layer of the ingot is removed by a lathe. At the same time, small samples of the NaI(Tl) material are taken along the crystal to measure the absolute concentration and distribution of Thallium in the ingot. All work is done in special rooms with a ultra-dry air (dew point is about -60 deg Celsius). After use of the lathe, surface of the ingot is smoothed by a diamond paper (see Fig. 5). Walls and bottom of the crystals are left with a relatively rough surface while optical window is fine polished. While crystal approaches to final dimensions its scintillating properties are tested for a first time by
attaching a photomultiplier and using the 60Co,137Cs calibration sources.
All materials used in NaI(Tl) detector modules were pre-selected at the HPGe detector. For encapsulation we use cylindrical containers made of a 3-4 mm-thick black acrylic. Acrylic makes possible energy calibrations using low energy γ-rays that cannot penetrate through copper containers commonly used in DM detectors. As a light reflector around the crystal we use a 1-2 mm-thick PTFE sheets. The optical window is made of a 4-5 mm-thick synthetic silica glued by epoxy to the acrylic container.
4. The radio-purity of NaI(Tl) DM detector prototypes
This fall we manufactured two NaI(Tl) 3-inch×3-inch cylindrical crystals: ingot #71 was finished in September, and ingot #73 in December of year 2018. The NaI used in the ingot #71 (#73)
Energy (keV) 0 20 40 60 80 100 120 140 160 180 200 kg) • d • Events / (keV 1 10 210Pb I 126 Energy (keV) 2 10 3 10 kg) • d • Events / (10keV 2 − 10 1 − 10 1 10 2 10 particles α
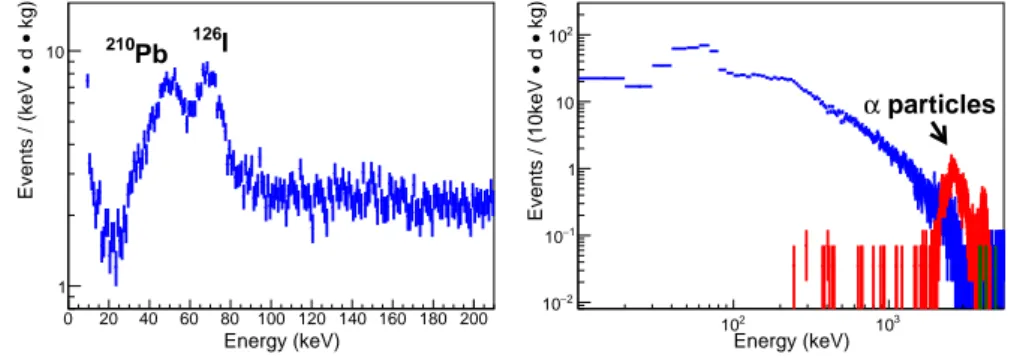
Figure 6. The measured background energy spectrum for the ingot #71
was purified by the re-crystallization procedure repeated 2-times (3-times), respectively . The background energy spectrum for the ingot #71 taken during 22.1 days in November 2018 is shown at the Fig. 6. The photomultiplier noise that still needs to be rejected by the off-line analysis is dominant below a 10 keV. In the 20-100 keV range background was caused mainly
by decay of 210Pb (T1/2= 22.2 y) and125I (T1/2= 59.4 d). The later isotope accumulated in the
crystal due the fast neutron activation on the surface. The concentration of238U calculated from
the activity of daughter products that form time-correlated pairs was a 8.9±0.3 ppt (214Bi-214Po,
τ ∼ 164 µs) and a 9.7±0.8 ppt (222Rn-218Po, τ ∼ 3.1 min). The concentration of 232Th was
a 1.7±0.2 ppt (220Rn-216Po, τ ∼ 145 msec) and a 1.4±0.2 ppt (224Ra-220Rn, τ ∼ 55 sec). For
both Uranium and Thorium we reached radio-purity levels achieved for the NaI(Tl) crystals by the DAMA/LIBRA collaboration: a 0.5-10 ppt depending on the crystal [2]. The final activity
evaluation of two ingots (including 210Pb and40K) will be completed in spring of 2019.
Acknowledgments
This work was supported by the Grant-in-Aid 16K05371 from the Japanese Ministry of Education, Culture, Sports, Science and Technology; the World Premier International Research Center Initiative (WPI Initiative), MEXT, Japan.
References
[1] Bertone G, Hooper D and Silk J 2005 Particle dark matter: evidence, candidates and constraints Physics Reports 405 279
[2] Bernabei R et al 2008 The DAMA/LIBRA apparatus Nucl. Instrum. Meth. A 592 297
[3] Bernabei R et al 2018 First model independent results from DAMA/LIBRA-phase2 Preprint 1805.10486 [4] Vigorito C et al 2017 Underground flux of atmospheric muons and its variations with 25 years of data of the
LVD experiment PoS (ICRC2017) 291
[5] Nakahata M 2005 Japanese and Eastern Facilities AIP Conference Proceedings 785 12
[6] Zuzel G and Wojcik M 2012 Removal of the long-lived222Rn daughters from copper and stainless steel surfaces Nucl. Instrum. Methods A 676 140
[7] Janecek M and Moses W 2008 Optical Reflectance Measurements for Commonly Used Reflectors IEEE Transactions on Nuclear Science 55 4
[8] Kozlov A and Chernyak D 2018 A large area detector for thermal neutron flux measurements at the KamLAND site Nucl. Instrum. Methods A 903 162
[9] Tanaka H and Watanabe H 2014 6Li-loaded directionally sensitive anti-neutrino detector for possible
geo-neutrinographic imaging applications, Scientific Reports 4, Article number: 4708
[10] Gavrilyuk Yu M et al 2015 High-resolution ion pulse ionization chamber with air filling for the222Rn decays
detection Nucl. Instrum. Methods A 801 27
[11] Shin K, Gileva O, Kim Y, Lee S H and Par H 2018 Reduction of the radioactivity in sodium iodide (NaI) powder by recrystallization method J. of R. and Nucl. Chem. 317 1329