Transequatorial CTD sections in the western
Pacific ocean in 1981 to 1983
著者
MASUMITSU Sunao
journal or
publication title
鹿児島大学水産学部紀要=Memoirs of Faculty of
Fisheries Kagoshima University
volume
34
number
1
page range
7-19
別言語のタイトル
1981年より1983年までに観測した西部太平洋におけ
るCTD断面
URL
http://hdl.handle.net/10232/13315
Mem. Fac. Fish., Kagoshima Univ. Vol. 34, No. 1, pp. 7-19 (1985)
Transequatorial CTD sections in the western Pacific ocean
in 1981 to 1983
Sunao Masumitsu*
Abstract
CTD data down to about 1500m were collected along five transequatorial lines in the western
Pacific ocean between December 1981 and November 1983. We described that the general features in the watertemperature, salinity and geostrophic currentspeed sections. The thermal field observed along near 160°E in December 1982 revealed that the depth of thermocline was
abnormally shallow, which was associated with the 1982/83 El Nino onset in the eastern Pacific ocean.
Introduction
The T&R/V Kagoshima Maru of the Faculty of Fisheries, Kagoshima University made
five transequatorial CTD sections in the western Pacific ocean between Papua New Guinea
and Fiji Islands in December 1981 to November 1983 , as shown in Fig. 1 . The CTD
sections along the meridian of near 180°E, 160°E and 142°E were obtained in the study
cruise conducted by the Kagoshima University Research Center for the South Pacific
(19821), 19832), 19833), 19844)). The other XBT-CTD and CTD sections along near 154°E
and a diagonal line from 147°E to 166°E were obtained in the training cruise for students of the Faculty of Fisheries, Kagoshima University. These CTD date are collected to investigate that the variation of the oceanographic condition near the equator related to the
marine biological production in the area.
As a first step of the purpose of this study, we presented that the water temperature,
salinity and geostrophic speed sections. In 1982 to 1983, the El Nino event was onset in the
eastern Pacific ocean. We had a great chance to investigate the thermal field of the surface
water in the western equatorial Pacific ocean in the El Nino event.
Data and Analysis
CTD casts were taken from the Kagoshima Maru on each whole degree of latitude, or one
and half degree of latitude along each section.
Deepest common depth for these stations was 1500m. The CTD system used to these * Kagoshima Maru, Faculty of Fisheries, Kagoshima University, 50-20 Shimoarata4, Kagoshima,
KOE 150 E 160 E I I 1 r 170 E , , I . , , , I , , . . 180 E [ i i i i I i i i i . A1 T X • A X X 10N- A A .-•• ©x ? © X A CAROLINE Is ^ Xx 013 0 ^y © X A © 11X 0 *k © 1 0 <£ '•'• 7\ © "-P % •• o - 7\ © C3h % '•. no y^^ A13 ® s + h ^v© 8 +•f i
—-^ PAPUA ^N^
\ NEW GUINEA 8 8, + 8 + 20 D n • si • s 10S-" ssia. f\ si ^} / \ D1961 DEC. wtfh CTD •/
P
B
1981 DEC. with XBT B C ° 1982 DEC. wrth CTDV
oV^
/
*
1983 MAY. with XBT ^Vj +1983 MAY. wiHiCTO ^ ©1963 JUNE with CTD A 1983 N(W. withCTO °, FIJIIs 20S-N %*Fig. 1. Map showing the oceanogrphic stations.
observations was the instrument of the Neil Brown Instrument System Inc with dissolved oxygen senser. The signals of water temperature, salinity and dissolved oxygen were obtained every one second, and the data of them recorded on the magnetic tape through a
mini computer NOVA—01. The vertical distributions of them at each stations were drafted
by means of a lineprinter and a X—Y plotter.
Results and Discussion
(1) Water temperature sections
Water temperature section in the upper 1400m along near 180°E from the equator to 15°S near Fiji Islands, in December 1981 is shown in Fig. 2 . The surface mixed warm water having a temperature of 28—29 °C, and having a thickness of 100mis found from the equator to 7°S. The thickness of surface water decreases with the latitude toward the south and it disappears at 14°S. The thermocline, which core temperature of 20°C is found at about 200m depth through the section. The temperature change with depth around the thermocline is
large at the region north of 4°S, and it is small south of 6°S, which value is 12. 2°C/100m at
around 2°S and 4°C/100m at 15°S. A weak spreading of the thermocline can be recognized
near the equator, but there is no equatorial upwelling at the surface, which indicates that the
Equatorial undercurrent is weak.
Water temperature section along near 160°E from 7°S to 7°N in December 1982 is shown in
Fig. 3 . The surface mixed warm water whose temperature is 28—29°C is found on the very
MASUMITSU .' CTD section in the western Pacific ocean STATION No. 15 14 12 10 1400 ' TEMPERATURES) 6 5 4 2 0
Fig. 2 . Water temperature section along near 180°E, in December 1981.
STATION No. TEMPERATURES)
1 2 3 4 5 6 7 8 9 10 11 12 13
6S 4S 2S 0 2N 4N 6N
10 Mem. Fac. Fish., Kagoshima Univ. Vol. 34, No. 1 (1985)
latitude toward the south. There is no equatorial upwelling at the surface, though the
spreading of isotherms in the thermocline is existed near the equator.
In the time of observation, the El Nino event is presented in the eastern Pacific, which is called the 1982/83 El Nino. We can recognized the characteristic oceanographic condition
associated with the El Nino event in this section. The 20°C isotherm, the core of
thermocline at 7°N is existed at the depth shallower than 100m. The shallow thermocline in
depth represents the low mean sea level, because the density structure in the tropical ocean
can be approximated by a two-layer system. According to the relationship between the
monthly mean sea level at Truck Is in the western Pacific (7. 5°N) and the depth of 20°C
isotherm (Chaen&Wyrtki, 19815)), when the depthof 20°C isotherm is shallowerthan 100m,the mean sea level at Truck Is is about —20 cm lower than the long term mean sea level. This abnormal lower mean sea level in the western tropical Pacific is caused by the El Nino event
(Wyrtki, 19776)).
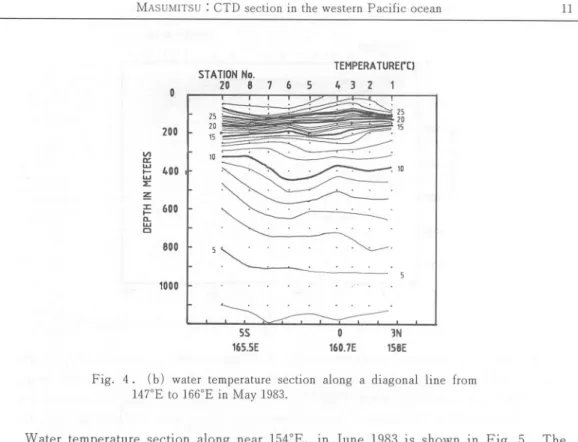
Water temperature section along a diagonal line from 147°E to 166°E, in May 1983 is
shown Fig. 4 (a) and (b) respectively. Thermal field in Fig. 4 (a) was obtained by XBT
STATION No.
11 10 9 8 7 6 5
TEMPERATURErO
4 3 2 1
Fig. 4. (a) water temperature section along a diagonal line from
147°E to 166°E in May 1983.
observation. The 20°C isotherm is existed at a depth of about 100m at 4°N. The depth of the
thermocline is still shallower than that of the normal condition, which shows that the
appearance of the 1982/83 El Nino is continued. The El Nino event of 1982-83 started in
July 1982 during the southern hemispheric winter, and it ended in October 1983 (Wyrtki,
19857)). In Fig. 4 (b), the thermocline spreading is not symmetrical with regard to the equator, which shows that the existence of the Equatorial undercurrent is not obscure,MASUMITSU : CTD section in the western Pacific
1000
temperature™
STATION No.
20 8 7 6 5 4 3 2 1
Fig. 4. (b) water temperature section along a diagonal line from
147°E to 166°E in May 1983.
1]
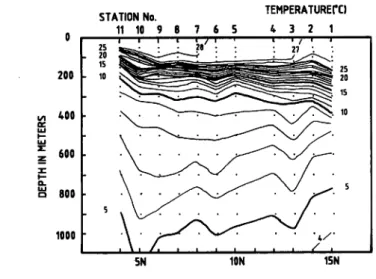
Water temperature section along near 154°E, in June 1983 is shown in Fig. 5 . The thermocline, the 20°C isotherm is found at the depth of about 150m, which may be the depth of the thermocline in the normal condition, though the El Nino is still presented in the eastern Pacific ocean. The spreading of isotherms in the thermocline is found at the equator and it is symmetrical with regard to the equator, which indicates that the existance of the
Equatorial undercurrent.
TEMPERATURErC) STATION No.
1 2 3 4 5 6 7 B 9 10 11 12 13 14 15
STATION No.
13 12 11 10 9 8 7 6 5
TEMPERATURE TO
4 3 2 1
0 5N 10N 15N
Fig. 6 . Water temperature section along in near 142°E, in November 1983.
Water temperature section along near 142°E, in November 1983 is shown in Fig. 6 . The
surface mixed warm water whose temperature is more than 29°C is found through the section and its thickness is less than 100m. The 20°C isotherm is situated at about 150m from 1°S to 10°N, which depth is the same of that in the section along near 154°E (Fig. 5 ). The
spreading of the thermocline is clearly found at the equator.
The meridional distribution of the 20°C isotherm depth along four sections is shown in Fig. 7 , to overlook the 20°C isotherm depth with latitude during the 1982/83 El Nino
onset, stated in each temperature section.
135E • • ' * I 0 100 ZOO 300m ION - 10S-20S- 140E 150E I '' • • I • • • • 1
160E 170E 180E
I i i i i I i i i i I i i i i I i i i i I r i l l I i i l i I l DEC. 19«! 0 100 200 300m I 1 1 1 Ss>« G FIJI Is.
Fig. 7 . The 20°C isotherm depth with latitude along four sections. 10N
10S
MASUMITSU '. CTD section in the western Pacific ocean
(2) Salinity sections
The salinity section along near 180°E, in December 1981 is shown in Fig. 8 .
200 400
| 600
LU z: Z. 800 1000 1200 SALINITY(%o) 6 5 4 2 0 1400 -15S 177 40E 10S 179E 5S 179E 0 177EFig. 8 . Salinity section along near 180°E, in December 1981.
STATION No. SALINITY!**)
1 2 3 4 5 6 7 8 9 10 11 12 13
6S 4S 2S 0 2N 4N 6N
Fig. 9 . Salinity section along near 160°E, in December 1982.
13
14 Mem. Fac. Fish., Kagoshima Univ. Vol. 34, No. 1 (1985)
surface salinity water less than 35 is found at upper 100m south of 7°S. The south Pacific subsurface saline water penetrates from the south to the equator. The Antarctic intermediate water characterized by the salinity minimum less than 34. 4 is found at adepth of 700m from south to ITS. The nearly isohaline water having salinity of 34. 5—34. 6 occupied the entire layer under 500m depth, north of 11°S.
The salinity section along near 160°E, in December 1982 is shown in Fig. 9 . The south Pacific subsurface water, a tonguelike distribution of the salinity more than 35 comes from the south to 4°N at a depth of about 170m. It is can be seen in Fig. 9 that the this saline water passes over the equator without the disturbance at the equator. This shows that there are no equatorial upwelling and the Equatorial undercurrent.
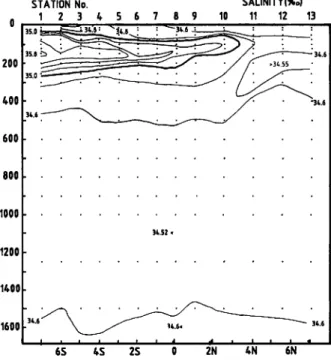
The salinity section along a diagonal line, in May 1983 is shown in Fig. 10. The south
SALINITY(%o) STATION No.
20 8 7 6 5 4 3 2 1
Fig. 10. Salinity section along a diagonal line, in May 1983.
Pacific subsurface water whose salinity is more than 35 penetrates to 2°N from the south. The weak surface disturbance at the equator is recognized based on the isohaline spreading
near the equator.
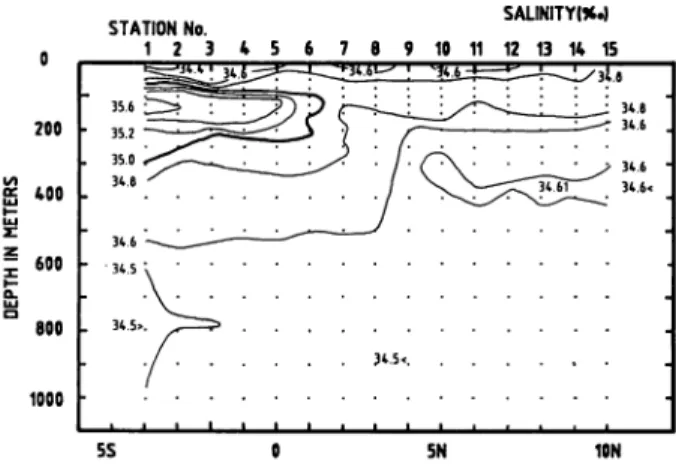
The salinity section along near 154°E, in June 1983 is shown in Fig. 11. The south Pacific subsurface water whose salinity is more than 35 comes from the south to 1°N at a depth of
170m. North of 2°N, a thin saline water having a salinity of 34. 8—35 is found at around
100m.
The salinity section along near 142°E, in November 1983 is shown in Fig. 12. In this
section, the north Pacific subsurface saline water having a salinity of 35 is found from the
north to 10°N at a depth of 180m. The region between 4°N and 10°N, the subsurface layer has low salinity, which correspond to the region of the north Equatorial countercurrent. The north Pacific intermediate water having a salinity less than 34.4 is found at the depth of 300
Masumitsu : CTD section in the western Pacific ocean
STATION No. SALmy{%']
1 2 3 4 5 6 7 8 9 10 11 12 13 14 15
1000 h
5S 0 5N
Fig. 11. Salinity section along near 154°E, in June 1983.
200 g 400 UJ •-LU z: z 600 x i -O. UJ Q 800 1000 1200 STATION No. 13 12 11 10 9 8 7 6 5 4 3 SALINITY (*o) 2 1 * 0 5N 10N 15N
Fig. 12. Salinity section along near 142°E, in November 1983.
15
(3) Geostrophic speed sections
The geostrophic speed section referred to lOOOdb surface along near 180°E, in December 1981 is shown in Fig. 13. The eastward current existed from the surface to the depth of 300m
near the equator corresponds to the Equatorial undercurrent. The another eastward current
existed in the region between 6°S and 10°S corresponds to the south Equatorial countercurrent. The westward south Equatorial current is divided into two parts, the one is existed in the region between 3°30'S and 7°S, the other is existed in the region south of 10°S. The surface speed of the south Equatorial current reaches to 40 cm/sec or more in the
16 Mem. Fac. Fish., Kagoshima Univ. Vol. 34, No. 1 (1985)
STATION No. 15 14 12
CURRENT(cm/sec)
6 5 4 2 0
Fig. 13. Geostrophic speed section along near 180°E, in December 1981.
0 200 OE UJ I -z: 600 z z • -2j 800 1000 STAT.0NN.. CURRENWsec, 1 2 3 4 5 6 7 8 9 10 11 12 13
Li1 j
1
*= :
r llllrlll rr/1 I / T70 r~° •'. J
E W E ! UoJjIfW
I E w E o 0 0 o o o 5S 5NFig. 14. Geostrophic speed section along near 160°E, in December 1982.
The geostrophic speed section referred to lOOOdb surface along near 160°E, in December
1982 is shown in Fig. 14. No eastward current is presented around the center of the equator.
North of the equator, the eastward current can be found, which has two cores near the
surface. One core having the maximum speed of 60 cm/sec can be recognized to the northEquatorial countercurrent. Both side of the equator, north and south of 3° latitude, the
spreading of the eastward current can be recognized at the depth of 200—300m, which may
be the eastward flowing deep countercurrent. Wyrtki and Kilonsky (19828)) described that
the eastward flowing deep countercurrents are shown at 4°N and 4°S with a core near 250mand with a speed of more than 10 cm/sec. The northern deep countercurrent is connected
with both the countercurrent and the undercurrent, based on their data of the Hawaii to
Masumitsu .' CTD section in the western Pacific ocean 17
The geostrophic speed section referred to lOOOdb surface along a diagonal line, in May
1983 is shown in Fig.15. The sectional structure ofgeostrophic speed around the equator is
almost same as that along near 160°E (Fig. 14). There is no eastward Equatorial
undercurrent at the equater. However, two deep countercurrents with a speed of more than
20 cm/sec are clearly found at a depth of 200m both side of the equator.
200 t o £ 400 UJ z: z £ 600 800 1000 CURRENT(cm/sec) STATION No. 20 8 7 6 5 4 3 2 1 5S 0 4N
Fig.15. Geostrophic speed section along a diagonal line, in May 1983.
0 0 0 0
1 I I I . . .
STATION No. CURRENT(cm/$ec)
0 12 3 4 5 6 7 8 9 10 11 12 13 14 15
5S 0 5N ION
Fig. 16. Geostrophic speed section along near 154°E, in June 1983.
The geostrophic speed section referred to lOOOdb surface along near 154°E, inJune 1983 is
shown in Fig. 16. The Equatorial undercurrent is clearly found, and the region of the
eastward current spreads to the north under the depth of 200m, which shows the northern
18 Mem. Fac. Fish. , Kagoshima Univ. Vol. 34, No. 1 (1985)
undercurrent. The north Equatorial countercurrent is not clearly apparent in the region
around 5°N.
The geostrophic speed section referred to lOOOdb surface along near 142°E, in November
1983 is shown in Fig. 17. The distribution of east-west current speed shows the Equatorial
undercurrent and the northern deep countercurrent is clearly found. The north Equatorial
countercurrent consists of two narrow and shallow parts at 6°N and 10°N.CURRENT Icm/scc)
STATION No.
13 12 11 10 9 6 7 6 5 4 3
Fig. 17. Geostrophic speed section along near 142°E, in November 1983.
Concluding remarks
During the 1982/83 El Nino onset in eastern Pacific ocean, the thermocline, the 20°C
isotherm at around 7°N, where is the countercurrent trough in dynamic height, is situated at
the depth shallower than 100m in December 1982. This shows the sea level is abnormally
low, which is associated with the El Nino onset in the eastern Pacific ocean as a
well-known fact. The other three water temperature sections in May, June and November
1983 shows the 20°C isotherm depth at around 7°N are 120-140m. These depth value are
correspond to the long-Term mean sea level or less lower than that at Truck Is (7. 5°N)
(Chaen&Wyrtki, 1981. Fig. 3.). we can recognized that, stated above, the thermal field
in the upper layer in the western Pacific ocean is clearly associated with the El Nino event.
In salinity distributions, we cannot describe the characteristic features associated with
the El Nino event.
In geostrophic speed sections, it is noticed that, in the case of the Equatorial
undercurrent not present, the north Equatorial countercurrent and the deep countercurrent
are clearly existed. In the next time, we will study the related conditions among the these
three eastward flowing currents.MASUMITSU : CTD section in the western Pacific ocean 19
Acknowledgment
The author wish to express his hearty thanks to the former Capt. S. UEDA and the
present Capt . S. HIGASHIKAWA of the T&R/V Kagoshima maru and crew for theiroceanographic works on board and Prof. M. CHAEN for his discussion in this study.
REFERENCES
1) Chaen,M. , Ueda,S., Nishi.T., Arima,S. , Masumitsu,S. & Higashi.M (1982): "A survey ofan oceanographic section along Gilbert, Ellice and Fiji Islands" The prompt report of the first scientific survey of The South Pacific (Japanese Edition), 49-52. Kagoshima Univ.
Research Center for the South Pacific, Kagoshima, Japan, (in Japanese)
2) CHAEN,M., NISHI.T. & HIGASHI.M. (1983): "Surface-temperature structure in the transe
quatorial section along 160°-15'E, December, 1982 " The prompt report of the second scientific survey of the South Pacific, 1-3. Kagoshima Univ. Research center for the South Pacific,
Kagoshima, Japan.
3) MASUMITSU, S., UEDA,S. & HIGASHIKAWA, S. (1983): "A transequatorial oceanographic
section along 160°-15'E, December, 1982" The prompt report of the second scientific survey of the South Pacific, 4-10. Kagoshima Univ. Research center for the South Pacific, Kagoshima,
Japan.
4) MASUMITSU, S. , HIGASHIKAWA, S. , NlSHI. T., Arima, S. & Uchiyama, M. (1984) : "The
oceanographical research in the southern region of Papua New Guinea, on November, 1983" The
prompt report of the third scientific survey of the South Pacific, 90-94. Kagoshima Univ.
Research center for the South Pacific, Kagoshima, Japan.
5 ) CHAEN,M, and Wyrtki, K. (1981) : The 20°C Isotherm Depth and Sea level in the Western
Equatorial Pacific. J. Oceanogr. Soc. Japan, 37, 198-2006 ) Wyrtki,K. (1977) : Se-a level during the 1972 El Nino ,J,Phys. Oceanogr.,7. 779-787
7) WYRTKI, K. (1985) : Sea level Fluctuations in the Pacific During the 1982-83 El Nino. Geophys.
Res. Letters, 12,125-128