Studies on the Production of Sea-Salt
Particles on the Sea Surface
著者
CHAEN Masaaki
journal or
publication title
鹿児島大学水産学部紀要=Memoirs of Faculty of
Fisheries Kagoshima University
volume
22
number
2
page range
49-107
別言語のタイトル
海面における海塩粒子の生成に関する研究
Mem. Fac. Fish., Kagoshima Univ.
Vol. 22, No. 2, pp. 49—107 (1973)
Studies on the Production of Sea-Salt Particles
on the Sea Surface*
Masaaki CHAEN**
Abstruct
Systematic observations of sea-salt particles in the lowest atmospheric layer over the oceans are carried out on board ships at sea. The salt-mass distributions of sea-salt particles, ranging from 10~n gm to 10~7
gm are obtained by combined use of hand-operated impactors and rod samplers. The vertical distribution
of sea-salt particles in the lowest several meters above the sea surface can be expressed by a modified form of Toba's equilibrium theory of sea-salt particles, by introducing the effective relative humidity. The
feature of the mean salt-mass distribution of the number concentration of sea-salt particles, 0, at a height of 6 m for each wind force, for the salt-mass class of log m ^ 2. 25 (m : the salt mass in 10"12gm unit), is
close to a straight-line segment on a logarithmic diagram, and it is expressed, as the first approximation,
by Junge's form concerning the size distribution of aerosols in the atmosphere.
It is found that the number concentration of sea-salt particles, 0, increases linearly on a logarithmic
diagram with a dimensionlessvariable, u^L/v, which represents the overall degree of the breaking of wind waves, where u* is the friction velocity, L the significant wave length and v the kinematic viscosity of air.
The reference level of the production of sea-salt particles, zi-surface, is newly introduced, and the number concentration of sea-salt particles at the ^-surface, 0u is discussed. The character of the salt-mass distribu
tion of 0i is always almost same, even though the wind speed and the state of sea surface may change,
and the absolute value of 0i is proportional to u^Ljv. The production rate of sea-salt particles, Fi, at the zi-surface can be obtained from the value of 0i by Fi = ws0u where ws represents the terminal velocity
of sea-water droplet. The value of Fi has the minimum at near log m = 3. The character of the salt-mass
distribution of F\ is also always almost same as in the case of 0i, and the absolute value changes with
wind and sea states, in proportion to u^Llv.
In conclusion, the values of di and Fi are presented for each class of salt mass as a function of u^L/v.
Also, they are presented approximately as a functionof wind speedalone, assuming the representative sea
state as a function of wind speed.
Contents
1. Introduction 2. Observations
2.1. Procedure of observation of sea-salt particles 2.1.1. Sampling surface of sea-salt particles 2.1. 2. Procedure of sampling of sea-salt particles 2. 2. Observations of sea-salt particles on board ships at sea
2. 2. 1. Observations on board the Kagoshima Maru
2. 2. 2. Observations on board the Hakuho Maru
* Dissertation for Doctor of Science (Tohoku University).
50 Mem. Fac. Fish., Kagoshima Univ. Vol. 22, No. 2 (1973)
2. 3. On the efficiency of impaction of sea-salt particles
3. Vertical distribution of sea-salt particles in the lowest atmospheric layer above the sea surface 3.1. Toba's theory concerning the vertical distribution of sea-salt particles
3. 2. Observed vertical distribution of sea-salt particles 3. 3. Observed vertical gradient of the distribution
4. Amount of sea-salt particles in the lowest atmospheric layer above the sea surface and their production rates on the sea surface
4.1. Values of number concentration of sea-salt particles on the sea surface 4. 2. A factor governing the production of sea-salt particles
4. 3. Production rate of sea-salt particles 5. Summary and conclusion
Acknowledgments References
1. Introduction
The sea-salt particles originate from the sea surface, and take an important part in the con densation process of water vapor in the atmosphere. The sea surface maintains a perfectly definite surface, so far as the wind is weak. As the wind speed increases, wind waves develop, and the breaking of wind waves begins. Thus, the boundary surface between the air and the sea breaks and sea-water droplet, or, sea-salt particles* are produced. The breaking of wind waves is related to the process of the transfer of momentum from wind to wind waves, to the turbulence in the sea water, and to the drift current. Besides, the breaking of wind waves affects the rate of eva poration from the sea surface, and in turn the heat exchange between the air and the sea, since air bubbles and sea-salt particles are produced on the sea surface. In this manner, the breaking of wind waves is related to many problems of the air-sea boundary processes, and the correspond ing production of sea-salt particles has a similar significance. Moreover, there is a plan aiming to estimate the distribution of wind over global oceans from a satellite observation of radar return from the sea surface (Moore and Pierson, 1971) and a problem of anthropogenic chemical films on the sea surface has become of major interest, with the development of human activity (Duce et al. 1972). The wave breaking apparently plays a part in these problems also.
It is necessary, therefore, to clarify the mutual relations among such quantities as the sea-salt particles, the overall degree of the breaking of wind waves and the prevailing wind over the sea surface.
The mechanism of production of sea-salt particles is investigated by Woodcock et al. (1949, 1953), Kientzler et al. (1954), Knelmen et al. (1954), Mason (1955), Blanchard and Woodcock (1957) and Blanchard (1963) by means of laboratory experiments or observations at the sea. Hayami and Toba (1958) and Toba (1959, 1961) carried out a series of experiments of the pro duction of water droplets in a wind-wave tunnel, together with theoretical considerations, and clarified the mechanisms of air bubble entrainment and of the production of water droplets. There is few observation on the actual sea surface concerning these problems. The observations
* In this article, the term "sea-salt particles" is used in the meaning including all the states of droplets of
CHAEN : Studies on the Production of Sea-Salt Particles on the Sea Surface 51
of sea-salt particles near the sea surface were carried out by Fournier d' Albe (1951) in Monaco
Bay, by Moore (1952) and Moore and Mason (1954) in the Atlantic Ocean. Recently, Kikuchi
and Yaura (1970) observed sea-salt particles on board ice breaker "Fuji" from Tokyo to Antarcti
ca. Unfortunately, all of these observations were carried out at only one height above the sea surface.
Toba (1965, 1965a, 1966) proposed a theory of the vertical distribution of sea-salt particles, and estimated the amount and production rate of sea-salt particles at the sea surface, by synthe sizing the data of sea-salt particle observation at cloud levels by Woodcock (1953) and other
investigations. In order to compare the theory with the actual data, Toba et al. (1971) carried
out an observation of the vertical distribution of sea-salt particles at the Shirahama
Oceano-graphic Tower Station in Tanabe Bay, together with observations including wind profiles and
wind waves. Further, Toba and Chaen (1969), and Toba, Okuda and Chaen (1971) carried outsystematic observations including the wind, wind waves, the breaking of wind wave and sea-salt
particles, on board the R.V. Hakuho Maru. Some of the analysis, especially concerning the
breaking of wind waves, have been published by Toba and Chaen (1973).
In the present article, a further analysis is presented to determine the amountand the vertical distribution of sea-salt particles in the lowest atmospheric layer above the sea surface, and their production rates on the sea surface, by synthesizing the above mentioned data from the Hakuho Maru, the data obtained by the present author on board the Kagoshima Maru (Chaen, 1971, 1972), and the data from the Shirahama Oceanographic Tower Station by Toba et al. (1971).
2. Observations
2.1. Procedure of observation of sea-salt particles 2.1.1. Sampling surface of sea-salt particles
In the observation of sea-salt particles, it is necessary to obtain the salt mass contained in a
particle and the number of sea-salt particles in each class of salt mass. There are some methods
used for the purpose, for instance, the method of micro chemical analysis, the isopiestic method
and the optical method. The method of micro chemical analysis is extensively used in the
case where the large number of observations of sea-salt particles in the class of salt mass largerthan 10"11 gm. In the present study, this method was used.
The sampling surface is a gelatin layer on the film containing silver dichromate gel, and when a sea-salt particle is collected on the film surface, it diffuses into the gelatin layer, and the chlorine ion precipitatesas silver chloride, producing a white circular spot on the reddish brown
base of the film. The mass of chlorine can be determined by measuring the size of the white spot.
In practical, it is convenient to use the method of Toba and Tanaka (1967), which is an improv ed method of Farlow's (1954, 1957, 1958). The preparation procedures of this sampling surface are as follows. As the basic film for the halide-ion sensitive film, a commercial Fuji Gravure Safe ty Film Normal (cabinet size), having a gelatin layer of 11. 0 fi in thickness, is used. The film is put into a fixative for about 20 minutes for removing sensitizer, and it is fully washed with distilled water. The film becomes a colorless transparent film with gelatin layers on both sides.
52 Mem. Fac. Fish., Kagoshima Univ. Vol. 22, No. 2 (1973)
of reagent solution are prepared : one is a mixed solution of 0. 5% sodium diehrornate and 2% polyvinyl alcohol in distilled water, the other is a solution of 5% silver nitrate. The film after
being dried is dipped into the first solution for 2 minutes, drained for 15 sec, dipped into the
second solution for 2 minutes, drained for 15 sec, and coarse sediments on the surface are rubbed
off with a soft sponge in a distilled water for 30 sec, and it is dried in a glass desiccator covered
with a black hood, for the film is slightly photosensitive. This is the gelatin film containing
reddish brown sediment of silver dichromate, and may be used by cutting it to a convenient size. After sampling the sea-salt particles on the reagent film, the film is put on a filter paper in the glass desiccator which keeps the inside slightly below 100^ in the relative humidity, and the white halos of silver chloride on the film is fully developed. After developing, the film isdried in the glass desiccator with silicagels, covered with a black hood. Then, it is essential to cover the film with a transparent coating by clipping the dried film into a solution of about 2%
collodion, in order to prevent further contamination by salt particles.
In order to determine the salt mass of a white halo, a microphotograph with 60 times
magnification is taken, and finally, a 100times enlargedprint of the photograph is made relative to the original white halo on the reagent film. The salt mass is easily determined by the
transparent scale which calibrate the relation between the dry masses of sea-salt particles and
the sizes of white halos, as described in Toba and Tanaka (1967), and the particle number was obtained for each class of the range of logm = 0. 25 (the salt mass contained, my is in 10~12 gm unit).
As to the method of measuring the diameter in situ of sea-salt particles when sampling, the sampling surface of MgO on a slide has been used (May, 1950). The magnesium oxide layer is obtained by moving burning magnesium ribbon to and fro under a metal slide or a glass slide.
The slide surface becomes snow white by the soot of magnesium. Through a microscope, the
situation of sea-salt particles on the MgO surface shows a striking analogy to those made by stones falling into snow. The ratio of diameter of water droplet to the hole produced on the magnesium oxide layer is about 0.86. The size of water droplet can be determined from the
diameter of the hole measured by moving microscope with 1 fi vernier.
2.1.2. Procedure of sampling of sea-salt particles
A hand-operated jet impactor described by Toba and Tanaka (1967) was used. The design is shown in Fig. 1. The impactor has an air intake with an orifice of 1 mm diameter (Mark A). By use of a 100 cc medical syringe (Mark G), an air jet is formed at the orifice, and sea-salt particles impact on a circular area of 1 mm diameter on the reagent film (Mark D). By rotating stage C by use of a handle (Mark F), six different volumes of air may be sampled successively as shown in the left hand part of Fig. 1. When using the impactor, the air intake of the impactor is directed against the wind, and the syringe is drawn at a speed of 3 sec per 100 cc or a little faster. In this case, a jet speed through the air intake is about 42m sec-1 or faster. According to the theoretical and experimental studies by Ranz and Wong (1952), it is concluded that sea-salt particles larger than 1 fi diameter are collected perfectly by the jet impactor with a round orifice of 1 mm diameter when the jet speed is higher than 40 m sec-1.
However, larger sea-salt particles in a low concentration have little chance to be caught by the impactor, since the impactor collectsparticles contained in a certain volume of air. So, the
CHAEN : Studies on the Production of Sea-Salt Particles on the Sea Surface A cm A : AIR INTAKE B : 0 RING C : FILM STAGE D : REAGENT FILM E : FILM HOLDER F: HANDLE G: 100 CC SYRINGE H: STOPPER
Fig. 1. Design of the hand-operated impactor for measurement of sea-salt particles
(Toba and Tanaka, 1967).
aluminum pipe brass rod with
sampling surface spring rod holder
53
spring rod holder sampling surface
Fig. 2. Head part of the rod sampler for the measurement of sea-salt particles, showing a 3-mm wide film mounted in the window (Toba et al., 1971).
other sampler which selectively collects the larger sea salt-particles was simultaneously used. The sampler was made of a aluminium pipe of 3 cm in diameter and 3 m long. The top of the
pipe has a structure shown in Fig. 2, and a 3-mm or 5-mm wide reagent film or the MgO
surface is hold in the window. When the window is open, the sampling surface is exposed at
right angles to the wind for a measured time, and sea-salt particles impact on it. This sampler
is named the rod sampler, and was first used during the Hakuho Maru Cruise KH-69-3 (Toba and Chaen, 1969). The efficiency of impaction of the film ribbon had been studied theoretically or empirically by Ranz and Wong (1952), Langmuir and Blodgett (1948). In the present obser vation, however, as will be described in section 2. 3, the efficiency obtained by the observation was not always in agreement with the theoretical results by them, it was found that the effi ciency of impaction was about 80$ or more for the sea-salt particles larger than 1. 8X10~10 gm
(logm = 2.25). The detailed procedures of the observations on board ships at sea will be
described in the next section.
2.2. Observations of sea-salt particles on board ships at sea
2.2.1. Observations on board the Kagoshima Maru
The observations of sea-salt particles on board the Kagoshima Maru, Kagoshima University were carried out at the observation stations of the two international oceanographic programs.
54 Mem. Fac. Fish., Kagoshima Univ. Vol. 22, No. 2 (1973) q70E 80 E 90 E 100 E 10 N 10 S 20°S INDIAN OCEAN 30" 70°E 80 E 90 E 100E
Fig. 3. Map showing the observation stations of
the Kagoshima Maru in the IIOE Cruise. Black circles indicate the location and the
number of observations of sea-salt particles.
20 N 10 N 10 S 20S 30°S 120 E EAST CHINA
SEA T KAGOSHIMA MARU.*,
1967 i BASHI O CHANNEL ° 120E C7 OKINAWA / 130 E AMAMI OSHIMA PACRC OCEAN 130 E
Fig. 4. Map showing the observation stations of the Kagoshima Maru in the CSK Cruise.
Circles indicate the stations of oceanographic observations and sea-salt particles observa
tions. Cross indicates the anchored station
for the hourly observations of sea-salt partic
les for two days.
1964 and the other was the Cooperative Study of the Kuroshio (CSK) in August, 1967. In the Indian Ocean, as shown in Fig. 3, on two or three occasions observations were carried out at each station of oceanographic observation on board while the ship was drifting, and the number of observations totaled about 300. In the East China Sea, the hourly obser vations of sea-salt particles for two days were carried out at the anchored station (cross mark station), as shown in Fig. 4, besides those at each station of the oceanographic observation. All of these observations were carried out for the vertical distribution of sea-salt particles, and the
impactor was used.
The sampling places on board the ship were at three heights, as shown in Fig. 5, namely, the flying bridge deck of about 9 m in height above the sea surface, the boat deck of about 4 m and on the bulwark of the main deck of about 2 m, and for the hourly observation in the East China Sea, the height of about 1 m above the sea surface was added.
The time required for the observation of sea-salt particles at one height was about one
minute, and then, the total time took less than several minutes for one vertical observation of
the three or four heights including the time required for moving from one sampling place to
another. As the sampled air volume, two or three of the volume of air was adopted among various volumes, such as 50cc, 100 cc, 200 cc, 400 cc, 800 cc and 1, 000 cc, according to the states
CHAEN : Studies on the Production of Sea-Salt Particles on the Sea Surface 55
V
WINDFig. 5. Sampling places (cross marks) on board
the Kagoshima Maru.
of sea surface.
The surface meteorological data at the time of sampling: the wind, the dry and the wet-bulb temperatures and the sea-surface temperature were measured. The photographs of the condition of sea surface were also taken. The wind speed was read from the indicator of a cup anemome
ter equipped at the 14-m level on the ship. The wind speed at the 10-m level was estimated from the 14-m level value by the use of the logarithmic law,with the friction coefficient, CD, of
1. 6 X10~3. The relative humidity was calculated from valuesof the dry and the wet-bulbtemper
atures measured by use of an Assmann ventilated psychrometer at the 9-m level on the ship.
The values of the number concentration of sea-salt particles, the wind speed at the 10-m level,
and the relative humidity at 9-m level observed in the Indian Ocean were shown in figures by Chaen (1971). The observations on board the Kagoshima Maru were taken under conditions of relatively light wind speed, i.e., from calm to 12 m sec-1 in the Indian Ocean, and from 2. Om
sec-1 to 5. 5 m sec-1 for the the hourly observations in the East China sea.
2. 2.2. Observations on board the Hakuho Maru
In July of 1969 and 1970, as a part of the GARP (Grobal Atmospheric Research Program), the observations of the air-sea boundary processes including sea-salt particles, the wind, wind waves and breaking of wind waves were carried out on board the Hakuho Maru of Ocean Re
search Institute, University of Tokyo, in the East China Sea and other districts. The two cruises
130 E 134 E !3tfE \ ' V • i / V ' ' / 36 N
i^*n
/ OSAKA TOKYOX -36°N 34°N 32°N. 1969 July 3~8 M£ tt^C^Jy 34°N 32N 1970 July"8^*1^2?^if
30°NEast China Sea •
o i . ' i Pacific Ocean 30°N 28°N 1970 July 18 1 i 28°N
126°E 130°E 13A°E 138°E 142"E Fig. 6. Map showing the observation stations of
sea-salt particles (cross marks) and tracks of the Hakuho Maru in the GARP Cruise (dashed line) and the 2nd GARP Cruise (solid line).
56 Mem. Fac. Fish., Kagoshima Univ. Vol. 22, No. 2 (1973)
in 1969 and 1970 were called the KH-69-3 Cruise (GARP Cruise) and the KH-70-3 Cruise (2nd
GARP Cruise), respectively. The observation stations and her tracks in the two cruises are
shown in Fig. 6. The preliminary reports of the observations were already published in the
cruise reports of Ocean Research Institute, University of Tokyo, by Toba and Chaen (1969) and Toba, Okuda and Chaen (1971), and concerning the breaking of wind wave field by Toba andChaen (1973).
In the KH-70-3 cruise on her sea way to the East China Sea, Typhoon 7008 (Oruga) bit Japan on July 5, 1970 and the ship was anchored off Fuke, Osaka Bay for 24 hours, and the observation was carried out until the wind speed reached 16. 6m sec"1 at 10-m level, without
rain. On the other hand, there were cases where the sea surface was like a mirror under the
calm conditions, so we experienced a wide range of the sea conditions in these cruises.
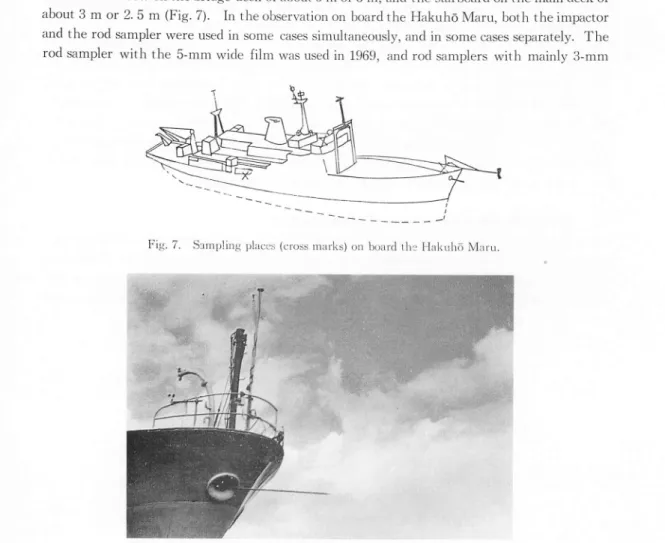
I he observations of vertical distribution of sea-salt particles were taken at three heights, namely, the compass bridge deck of about 13 m in height above the sea surface, the hole near the starboard bow on the bridge deck of about 6 m or 5 m, and t he starboard on the main deckof
about 3 m or 2. 5 m (Fig. 7).
In the observation on board the Hakuho Maru, both the impactor
and the rod sampler were used in some cases simultaneously, and in some cases separately. The
rod sampler with the 5-mm wide film was used in 1969, and rod samplers with mainly 3-mm
Fig. 7. Sampling places (cross marks) on board the Hakuho Maru.
Fig. 8. A view of the sampling of sea-salt particles by Ore rod sampler at
Chaen : Studies on the Production of Sea-Salt Particles on the Sea Surface 57
one were used in 1970. A view of the conditions of the observation by the use of the rod sam
pler at a height of 6 m is shown in Fig. 8. The sampler is projected as far as possible from the body of the ship, and its window is opened to expose the film to the air at right angles to the
flow for a measured time. The exposed time interval was empirically decided, for instance, 300
sec for a wind speed of 3. 3 m sec"1, 180 sec for 6. 0 m sec-1 and 5 sec for 16. 6 m sec ', in order to get a significant number of sea-salt particles and also to avoid the masking of particles.
The observations for the check of the impaction of efficiency, and the measurement of the diameter in situ of sea-water droplet by the MgO surface were carried out at the height of 6 m above the sea surface. In the observation by use of the impactor, six spots of sea-salt particles were taken on the reagent film at one height, for different air volumes or for the same ones, in order to obtain the retention factor for the impactor and to get the counted particle number of over several tens (Toba and Tanaka. 1968). In order to obtain the efficiency of impaction of the rod sampler, the simultaneous observation by the impactor and the rod sampler was made. These results will be stated in the next section.
Surface meteorological data, such as the wind, the air temperature, the dew point and the sea-surface temperature were obtained from the records of ship's equipments. The wind speed at the 10-m level was estimated from the 20-m level value by the logarithmic law. The relative humidity was calculated from the air temperature and the dew point. As to wind waves, the
period of significant waves was measured by the use of a stop watch, by watching some marks
on the water surface, such as bubbles produced by the breaking of wind waves. Furthermore, the breaking of wind waves was evaluted as the percentage of the white breaking area to the area of sea surface, by use of the color slide pictures, including the horizon near the top of the picture taken at a fixed height of 14 m, in the four directions relative to the direction of wind
Fig. 9 (a) Fig. 9 (b)
Fig. 9. Examples of the sampling surface of the reagent film with white circular spots developed by sea-salt particles by (a) the impactor and (b) the rod sampler. The largest spot on the film by the impactor and
the rod sampler has 40.4/( and 100fi in diameter (3.7xHVl0gm and 2xl0_9gm salt mass contained), respectively.
58 Mem. Fac. Fish., Kagoshima Univ. Vol. 22, No. 2 (1973)
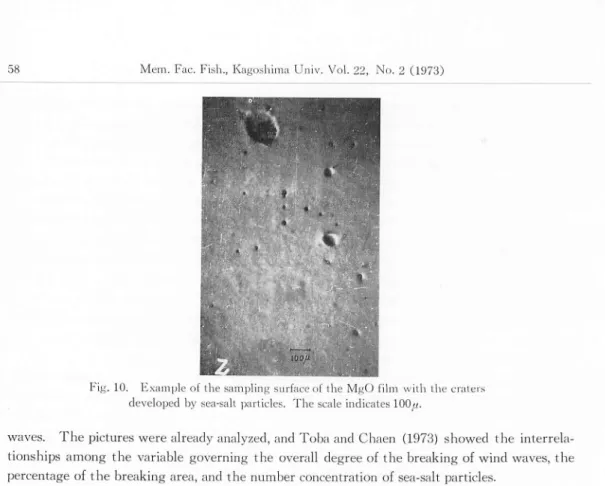
Fig. 10. Example of the sampling surface of the MgO film with the craters
developed by sea-salt particles. The scale indicates lOO^y.
waves. The pictures were already analyzed, and Toba and Chaen (1973) showed the interrela tionships among the variable governing the overall degree of the breaking of wind waves, the percentage of the breaking area, and the number concentration of sea-salt particles.
The reagent films after sampling were carefully treated according to the procedure described in section 2. 1. 1. In Fig. 9 are shown the white circular spots of sea-salt particles on the reagent film obtained by the use of the impactor, and of the rod sampler, and in Fig. 10 is shown the craters of sea-salt particles produced on the MgO surface. The white circular spots collected by the impactor were measured and counted for all six spots and those by the rod sampler were treated as about 10 to 30 sheets of 100 times enlarged microscopic photographs for each obser vation. The original area of one sheet of the microscopic photograph by the rod sampler is 1 X 10~2 cm2. When the microscopic photographs of the film of the rod sampler were taken, the visual field of microscope was succesively moved on the film, in order to obtain a series of prints including 10 to 30 sheets. This was to avoid the personal selection for the situation of the dis tribution of white circular spots. By the above mentioned procedure, the counted particle num ber at one observation became large and very reliable data of sea-salt particles were obtained.
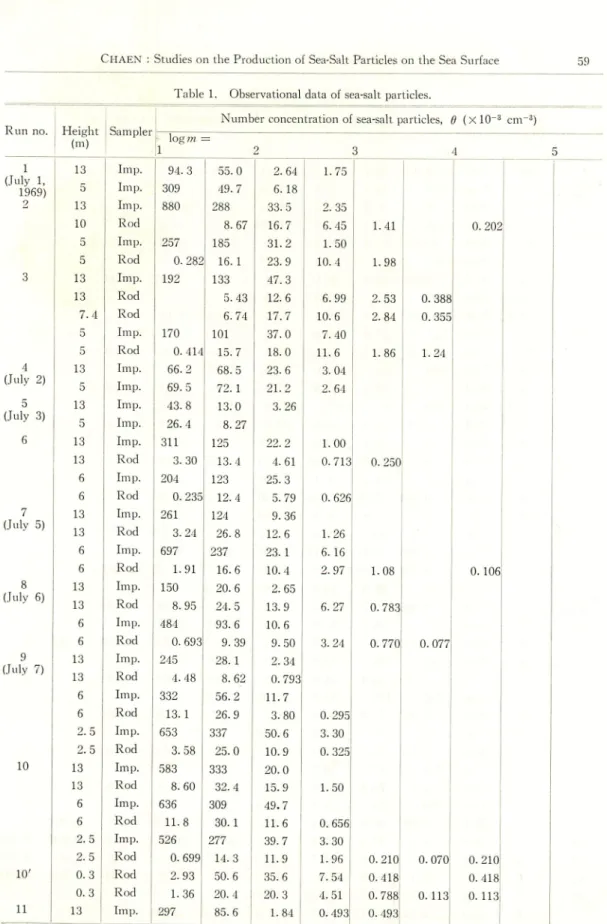
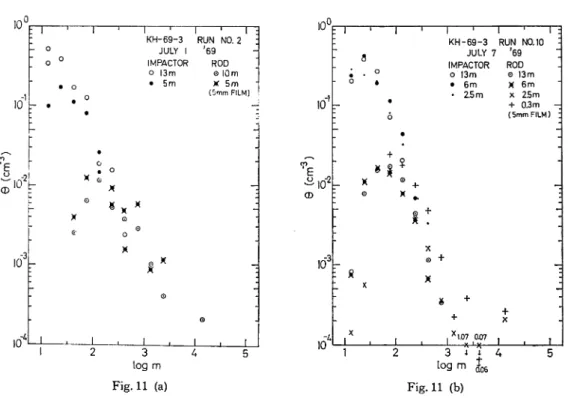
The number concentration of sea-salt particles, 6, for the ranges of log m —0. 5 obtained during the KH-69-3 and KH-70-3 cruises are shown in Table 1. The wind speed, the relative humidity, the period of significant wave and the class of wind waves at the time of observation of sea-salt particles are shown in Table 2. Several examples of the salt-mass distribution of 0 for the ranges of log in =0.25 are shown in Fig. 11. The number concentration of sea-salt particles, obtained by the impactor is high in the class of salt mass of log m :S 2, and that of the rod sampler is low. The values of number concentrations by the two samplers fairly agree in the class of salt mass of log m = 2~2. 5, as shown in the figures. A wide range of the salt-mass distribution of sea-salt particles from log m = 1 (about 8 ft in diameter, as a sea-water droplet) to log m = 5 (about 175[i in diameter) have been able to be obtained, using the two kinds of samplers at the same time.
CHAEN : Studies on the Production of Sea-Salt Particles on the Sea Surface 59
Table 1. Observational data of sea-salt particles.
Number concentration ol sea-salt particles, 9 (XlO"3 cm'3)
Run no. Height
(m) Sampler logm = 1 2 3 4 5 i (July l, 1969) 13 Imp. 94.3 55.0 2.64 1.75 5 Imp. 309 49.7 6. 18 2 13 Imp. 880 288 33.5 2.35 10 Rod 8.67 16.7 6.45 1.41 0.202 5 Imp. 257 185 31.2 1.50 5 Rod 0.282 16. 1 23.9 10. 4 1.98 3 13 Imp. 192 133 47.3 13 Rod 5.43 12.6 6.99 2.53 0.388 7.4 Rod 6.74 17.7 10.6 2.84 0.355 5 Imp. 170 101 37.0 7.40 5 Rod 0. 414 15.7 18.0 11.6 1.86 1.24 4 (July 2) 13 5 Imp. Imp. 66.2 69. 5 68.5 72. 1 23.6 21.2 3.04 2. 64 5 (July 3) 13 5 Imp. Imp. 43.8 26.4 13.0 8.27 3.26 6 13 Imp. 311 125 22.2 1.00 13 Rod 3.30 13.4 4.61 0.713 0.250 6 Imp. 204 123 25.3 6 Rod 0. 235 12.4 5.79 0.626 7 (July 5) 13 13 Imp. Rod 261 3. 24 124 26.8 9.36 12.6 1.26 6 Imp. 697 237 23. 1 6.16 6 Rod 1.91 16.6 10.4 2.97 1.08 0.106 8 (July 6) 13 13 6 Imp. Rod Imp. 150 8.95 484 20.6 24. 5 93.6 2.65 13.9 10.6 6.27 0. 783 6 Rod 0.693 9.39 9.50 3.24 0. 770 0.077 9 (July 7) 13 13 6 Imp. Rod Imp. 245 4. 48 332 28. 1 8.62 56. 2 2.34 0.793 11.7 6 Rod 13. 1 26.9 3.80 0.295 2.5 Imp. 653 337 50.6 3.30 2.5 Rod 3.58 25.0 10.9 0. 325 10 13 Imp. 583 333 20.0 13 Rod 8.60 32.4 15.9 1.50 6 Imp. 636 309 49.7 6 Rod 11.8 30.1 11.6 0.656 2.5 Imp. 526 277 39.7 3.30 2.5 Rod 0.699 14.3 11.9 1.96 0. 210 0. 070 0.210 10' 0.3 Rod 2.93 50.6 35.6 7.54 0.418: 0.418 0.3 Rod 1.36 20.4 20.3 4. 51 0.788! 0.113 0. 113 11 13 Imp. 297 85.6 1.84 0. 493.
o. 493!
60 Mem. Fac. Fish., Kagoshima Univ. Vol. 22, No. 2 (1973) Height (m) Sampler I Table 1. (Continued) Run no.
Number concentration of sea-salt particles, 6 (X 10~8 cm-3) logra = 1 2 3 4 5 11 (July 7, 1969) 13 6 Rod Imp. 29.0 424 30.1 89.0 17.3 25.3 5.61 1.34 1.05 0.051 6 Rod 19.2 49.2 26.8 9.62 1.16 0.155 12 13 Imp. 216 37.2 3.04 0.520 0.493 (July 8) 13 Rod 33.7 39.3 24.8 13.3 3.20 0.388 6 Imp. 855 274 27.6 6.77 6 Rod 2.04 18.4 20.6 14.4 4.55 0.467 0.311 2.5 Imp. 696 313 86.0 29.8 2.5 Rod 2.95 30.3 29.4 16.3 7.57 1.66 13 13 Imp. 421 93.9 36.8 12.4 13 Rod 3.58 29.7 24.6 16.2 8.42 2.10 0.421 6 Imp. 213 143 34.6 6.52 3.74 6 Rod 12.5 24.0 16.2 9.34 2.51 0.228 2.5 Imp. 614 215 114 35.0 19.5 1.25 2.5 Rod 1.51 37.6 50.8 33.5 21.5 1.88 0.752 14 13 Imp. 150 50.8 18.5 0.293 (July 9) 13 Rod 0.654 9.01 7.66 2.70 0.872 0.218 6 Imp. 220 81.5 31.1 3.99 6 Rod 0.863 7.09 7.03 2.40 0.432 0.192 15 13 Imp. 96.6 32.9 11.0 0.50 (July 10) 6 Imp. 84.4 80.2. 19.2 2.89 0.293 6 Rod 0.038 3.01 8.71 4.09 1.08 0.076 2 6 Rod 0.322 9.74 12.8 5.39 2.17 0.162 0.081 3 6 Imp. 147 86.8 14.8 2.63 0.240 (July 5, 1970) 6 Rod 0.296 12.7 16.3 11.2 5.23 1.29 0.198 4 6 Imp. 357 160 47.9 11.5 5.21 2.27 6 Rod 0.253 13.1 29.3 17.6 10.4 3.53 0.758 0.084 5 6 Imp. 307 149 55.3 11.1 3.10 6 Rod 9.25 23.4 21.9 13.9 7.85 2.29 0.545 6 6 Imp. 330 106 17.5 7.05 2.20 6 Rod 8.76 25.9 30.9 16.7 10.2 3.55 0.591 7 6 Imp. 410 109 17.7 2.60 6 Rod 0.750 20.1 32.3 22.9 11.3 3.63 0.500 8 6 Imp. 348 112 20.2 2.57 6 Rod 17.3 70.8 61.3 33.3 22.3 7.24 1.26 9 6 Imp. 399 133 21.0 1.90 1.36 6 Rod 7.60 47.7 61.6 43.5 23.9 8.12 1.31 0.262 10 6 Rod 20.4 65.3 79.5 52.9 32.2 18.2 5.49 0.818 0.168 11 6 Rod 17.2 55.6 62.5 52.6 36.2 18.7 9.02 1.61 0.261 12 6 Rod 19.4 94.9 114 88.7 31.5 16.9 7.32 1.78 0.245 13 6 Imp. 82.5 17.2 1.14 O.560 (July 6) 6 Rod 2.02 8.17 6.71 3.23 0.728 0.081
53 OOOOCnCOOCTjCnCOCnCOCOCrjCOCOOCO £*to to *< to H-<—t c; » to JO ,_ c^ ^ H-H-S-H-3 t-^ O tO *< -^ cr> cri (X)^ >u 00 o O 3 O K I—» i—» t—» •_J 3 " 5, TO* O* CO 00 Oi GO GO O co CO Oi CO cr> o> o> CF> O1} CT> H [L d fl d CL ? !ia-D-d(ld,p,0^^t!'C,Ot!'O'Dt3T!'0t3t3'O'aB'afl 2 2 2 2 « 8. £ 8 £ CL. CL. Q-p &-p &. T3 V B O t— co en o CO O o o to to cn 4^ CO oo 0> tO CO to to o CO enen O •U CTJ -<l <i oo •-» a> oo a> as ©ococncotoocn ? Is1 ? .*" ,M 5° o oo h-cn o to to co p to Ol Ul s to H w rf*. a> © co cn O »u cn *»a •-*•-»>—»l—»H-»h-»tOl—'0>>>-*l—'H-»tO»—»(—»»—»(—i oo o -a to to 00 £t to O 00 CO o H-» cn ^3 ^ COJxCOH-COCOtOOOtOtO-qcOO^O <itopcnototo»fc>.co^cncnocn4^*<j CTi CO CO tO O O O 00 CO 4^ *-» CTi cn >-> a> H-<i CT> h-to to jfcw p »-* to ^1 cn © © >u © to •— to o h-PpJ-*00<100000000000H-' 2 c 3 O o 3 <i co oo co oo cn to J^ co o ^ t-' oo to o a^ to to •o »u jx to tO H-* ^» 00 -o cn ^ •— h--4 ^ O CT5 tO O O tO CT> CO O CO CO CO O h-1 jx •-* co ^q oo cn o cn oo o -*a cn •— co cn cn co cn >-> >-* * i a. I •<! p p p p p ^ to tU •&. oo -O CO to 00 »U to Cft to cn t-» j-1 © © © © © to © j-» ooototo<Jtot-*cn ** cn to oo o co © cn *—» cn 3 CO o GO O co o ocn oGO O ©oo CO O CO cn co cn cr> p o O cn co to h-» cn CO t— O H--3 cn p p p p H H M tO A 00 CO iU oo m o^ oo o o o to to cn co o to tO H-» GO O cn co cA jl X o O a. > : o GO
O Ci £h Ch £h ^H w cn cn cn cn e 4^. 4*> •U c 4^ ^ •U 4*> 4*> 4x C •>&> CO «3" -co 'GO GO CO GO H-» £-00 c 3 GO to »-» © *< to 00 ^4 *< cn cn »t^ GO to »—' *< © to 00 ^4 4^ GO to to*<: h-1 t—» »—» ^ H* D w oc ^-4 3) W 2^ O K •-» I—» •—» 3 2. cn cn CT> cn cn cn cn cn cn cn cn cn cn cn cn cn cn cn cn cn cn cn cn cn cn cn cn cn cn cn cn 00 cn CO 00 cn CO CO cn GO CO cn 3 ? o »—< 3 o o o r o 3 o i—i 3 o r *> o B o o B o 3 o 3 o B B o i—t 3 o o I—i 3 B sf 3" r i—i 3 t—1 3 o o o O o
Sampler
•p o- p-V p-V Q-V P-V P-V P-V p- P-V P-V P-? O-V V o-V a-V V V V V V *? a- p- P- p-to CT) m IO »—' 1—' ^ ^ ,_! »—• ,_, h-GO GO IV) CO to to to H--»4 on -*4 cn CO CO cn cn IV) cn GO cn tv> •u cn cn to © 00 tv> o cn © l-» ^4 »-» »—» © © -a <1 •u © 1—» 4X to cn GO cn to GO oo --4 CO 4^ ai CO o o o o ^4 o 00 CO <i cn © 00 CO t—» S i—* IV) to GO ' t- © o 45*. •«4 ^4 4^ to cn UI II to to to t—» H-» H-» •—' to IV) CO to to to cn CJI cn cn cn cn >U CO to GO 4^ to p t—» © cn to 00 j—1 2 c 3 w CO •-« o © 4^ 4^ to GO © © © t—» © H-» © to © cn © © to © H-* © »^ © 4^ to © 00 cn cn »JX to ai cn ui oo £t 00 IV) o <1 cn CO tV> -4 00 4x IV) cn to to »u 00 © CO 00 to CO 4^ cn cn cn © cn CO (—' cn t—' 4X 00 00 H-* cn ^3 00 £» CO cn cn rv> 4^ GO ui 00 cn -vl oo to o cn to 4^ cn 4*> CO to cn 00 £» to t—» to to to 4*. (Ti 00 CO fi-> tO IV) 00 1—' to to to rfSw CO 00 4*» GO t—' ^ M go cn to to GO ^4 cn -4 CO cn ^4 to cn © to 00 cn ^4 00 to CO cn © to © 1—' cn © 00 Ol 00 GO to 4^ UI © ai -4 l-' on <J o 3 o o> 3 <J -4 cn ,_» cn cn IV) cn CO 00 o »—' cn © »u CO 00 to cn •_» cn © cn ^4 to © cn »u cn 4^ 4^ 00 GO 00 to cn to cn to h-* ^4 to to to -*1 cn cn © cn cn oo to 4x to cn cn oo CO OJ Z P 1—» H-» 4i» © cn cn © to cn »—» to CO 00 to © ^ to »-* •—» t—» to 00 H-» .-»—» CO © •—' © © © cn cn to to 4^ 4^ cn ^ to 00 rf^ cn 00 <J o' 00 CO CO cn (T) oo CO 00 <1 to i—' oo oo -<l CO 00 4^ IV) © 4*. © o cn CO cn to 4^ cn to to H-» © to ^4 1—» <l <j cn to h-» °^ oo cn 4^ cn h-» cn © © cn to 00 to 4^ »—» ^ ^4 cn © OO oo to co © o 4^ to cn cn to to OO 00 o cn to H-*4 CO O CD CO ^ H* 4x GO cn »—» H-» © © © © © © © © © © © © »—» © GO © 4^ to © H-» H-CO to to H 00 H_4 to cn o to cn ro £>. 1—» 1*. on H-» CO 00 © rv> (_i cn cn cn 00 H-* o to cn GO CO cn -4 '-' to 00 hix to 00 £» CO o CO o cn to cn to 4*. cn CO ^4 to cn © cn 00 © © © cn © CO to © cn -^ 00 CO GO to u^ CO T3 © © to © © H-» © © © © © © © © H-» © © © © © o' cT 00 00 <1 m 00 © o r*> © © © t—* © CO rfx to to 00 4^. Cfl oo to 00 ^ rn 00 00 on cn Ul 00 -^ -vl to to 00 y to rv> to cn o CO <J to 00 © GO to to 4^-UI to *<) **> <*> © © © © © © © © © © © >< (.J IV) i—» »—' M © © © H-» °^ © © £t o 4^ >u -4 I-* IV) <4J cn •<! 00 o CT5 4X rf^ H-» 00 ^1 cn to 00 *o © © o 3 i 5 © cn 4^ cn © »-» 4*> 4^ o o CD 3 W 3 O oCHAEN : Studies on the Production of Sea-SaltParticles on the Sea Surface 63
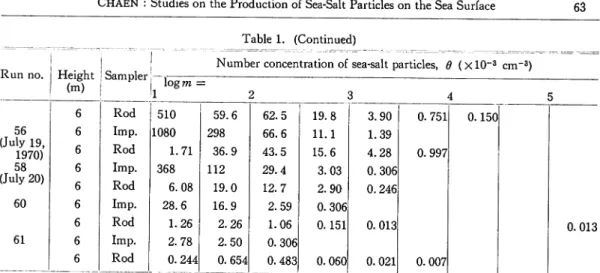
Table 1. (Continued)
Run no. Height
(m)
Sampler
Number concentration of sea-salt particles, (9 (Xl0-3 cm-3) logm = 1 2 3 4 5 6 Rod 510 59.6 62.5 19.8 3.90 0.751 0.150 56 (July 19, 1970) 6 Imp. 1080 298 66.6 11.1 1.39 6 Rod 1.71 36.9 43.5 15.6 4.28 0.997 58 (July 20) 6 Imp. 368 112 29.4 3.03 0.306 6 Rod 6.08 19.0 12.7 2.90 0.246 60 6 Imp. 28.6 16.9 2.59 0.306 6 Rod 1.26 2.26 1.06 0.151 0.013 0.013 61 6 Imp. 2.78 2.50 0.306 6 Rod 0.244 0.654 0.483 0.060 0.021 0.007
Table 2. Surface meteorological and wind wave data at the time of observation of sea-salt
particles. The Uio represents thewind speed at 10-m level, RHthe relative humidity,
T the significant wave period. Data ofscale of wind waves is reprinted from ship's
log of the Hakuho Maru.
Run no. Date Time* tfio
(m sec-1) RH T (sec) Wind waves (scale) 1 July 1,1969 09 : 30 9.1 5 2 14 : 05-14 : 25 9.8 4 3 17 : 10-17 : 50 8.3—10.5 4 4 July 2 08 : 20—09 : 00 4.3-4.7 2 5 July 3 08 : 25—08 : 45 4.9 95 2 6 15 : 02—15 : 25 7. 4—8. 8 94 3 7 July 5 17 : 10 7.2—8.8 95-97 3 8 July 6 13 : 40—13 : 53 8.7—9.0 98 3 9 July 7 14 : 25—14 : 52 4.7—5. 6 95 1—2 10 15 : 20—15 : 45 6.1—6.5 93 2—3 10' 15 : 55—16 : 04 6.1-6.5 93 3 11 20 : 11—20 : 25 10.0 95 4 12 July 8 09 : 04—09 : 15 12.1-12. 6 92—97 5 13 10 : 49—11 : 11 12.8 81 5 14 July 9 19 : 27-19 : 47 7.1—8.2 81 2 - 3 15 July 10 08 : 56—09 : 20 1.2—3.5 70 0
< Uf c0 nS n8 So -8 5n Kn SS §S S? S5 ES i3 HS «) »s «c n^ WM c £ c c c *< *< v: *< *< H-» ,_i H-» i—» •—' -«4 cn to © © © oo 00 cn oo 00 -4 -4 cn (__il_k(_-»l—»(_»©>-»>—» >—» H-» © © •-» I—' © f-* I—' H-* © H-' H-» H-» oc oo ot ©o H- oo to ©© oo ^o H- cn cn cn oo co cn K- co cn o J »_ »> -» 4^ >-'> -» H-»c nc n© >-*t oi -* >-*i -» h-»t
o© oo o© ot ^t ^4 n4 ic 4U *^ to cn i© n< ^c ©4 to
00 1H -t O© ©C O© H-»4 ^C OI ^H -' I^ H-»C nH -» H-iH -4 ^» ^t OH -U 1> ^I ^C n ©» cn H-'G OG o© oo ©o oc nu ic nc n< J4 ^c ot oo oo o^ 44 ^c n-<i ©c n^ 4© 4^ cn cn cn h-to H-» CO -4 © © to cn ^4 cn cn 00 4^ •— tO 00 4s*. GO 4^ •-» to to 1 -4 to GO CO GO 00 4^ £» 4s-cn GO GO GO OO cn 4s-00 |**t £ CO CO © to ^4 -*4 > © to oo cn GO -4 -*4 to 4s-to GO to 00 OO at 4^ © to to © to ^4 00 to GO oo oo oo oo oo to to to to oo to to to to to cn -4 ^- o4 ot oo ot nt oc oc nt oc o- ©t to to to to 00 OO 00 -4 © go © © © h-cn oo 00 cn ^4 -4 oo ^4 ^4 -4 •o oo •<! •<! -4 ^J ~«4 GO 4^ GO to cn cn to 4^ cn © cn t—* cn ^i id 00 C3 W W H H cn cn to cn to cn to © cn © © -4 to oo 00 © 4^ cn oo GO GO Ul PH MO tO MO lO Cl iN iU ^ G0 00 tO C0 tO tO G0 00 CO G0 C0 CO 4^ tO tO tO tO tO tO tO tO IO tO CO H-» tO CO 4^ c H 3 CD >< O ©
§§
C/i 3 8 °- cTS < CD 3 w. cr °8 (A to 3~ 3 n £U o r: 3 3 3 < C CD < P-o z: oCHAEN : Studies on the Production of Sea-Salt Particles on the Sea Surface 65
Run no. Date
44 July 17,1970 45 46 July 18 47 48 49 July 19 50 51 52 53 56 July 19 58 July 20 60 61 Table 2. (Continued) Time* Uio (m sec-1) RH T (sec) Wind waves (scale) 17 :30 3.7 83 4 17 :49 4.0 83 1.91 4 10: 07 6.2 83 2.56 3 12 : 25 6.7 82 2.65 3 15 : 19 6.9 76 2.82 3 08 :24 9.7 93 3.88 5 09 : 04 10.4 90 5 09 :20 10.4 90 09 : 32—09 : 33 9.8 93 3.55 5 ] 12 : 40 8.8 95 3.64 5 17 :08 8.7 97 2.64 4 08 : 49 6.5 97 1.62 3 12 : 03 2.2 92 (0.8) 1 13 : 04 2.2 90 (0.6) 1 ~T ~T — r RUN NO. 2 '69 ROD © 10m X 5m (5mm FILM) -T 1 1 J 1 [-KH-69-3 RUN NO. 10 10 t-'E CD -21 lov
ld3.
KH-69-3 JULY I IMPACTOR o I3m • 5m 3 log m 'E ^102 (D »| JULY 7 IMPACTOR o 13m • 6m • 2.5 m 3 i tog m Q06 '69 ROD © 13m X 6m x 2.5 m + 0.3m (5mm FILM)Fig. 11 (a) Fig. 11 (b)
Fig. 11. Some examples of the salt-mass distribution of the number concentration of sea-salt particles
obtained on board the Hakuho Maru, (a) Run No. 2, (b) No. 10, (c) No. 15 in the KH-69-3
Cruise, and (d) Run No. 12, (e) No. 19, (f) No. 31, (g) No. 37, (h) No. 52, (i) No. 53 and (j) No.
60 in the KH-70-3 Cruise. Values are entered for ranges of log m = 0. 25. Values of 0
indicated with an arrow on the bottom of the figuer should be multiplied by 10"3. Data of the
wind speed, the relative humidity and wind waves at the time of observation are shown in
66 CD
I03^
'9l io"VllO2:-Mem. Fac. Fish., Kagoshima Univ. Vol. 22, No. 2 (1973)
~i—•—i—'—n KH-69-3 RUN NO. 15 JULY 10 '69 IMPACTOR ROD o 13m * 6m • 6 m (5mm FILM) *J-3 oi» i* log m__ 0038 Fig. 11 (c) n 1 1 - i -p KH-70-3 RUN NO. 19 JULY 10 '70 IMPACTCR b 13 m • 6m • 3m 3 log m Fig. 11 (e) 10
§I02
CD 10 ~ 10" 'E , 3 10 CD Id3 Id4 W x X * X x -i ' 1 • r KH-70-3 RUN NO. 12 JULY 5 '70 ROD X 6m CJmm FILM) X * 3 log m Fig. 11 (d) K* 1 1 1 . r KH-70-3 RUN NO. 31 JULY 11 '70 ROD B 13 m X 6m X 3m (3mm FILM) ' x x ,009 005 , l 3 log m Fig. 11 (f)CHAEN : Studies on the Production of Sea-Salt Particles on the Sea Surface 67 10u '6 CD 10 10 * X 0 x KH-70-3 1 • I RUN NO. 37 JULY 12 '70 IMPACTOR ROD • 6m X 6m (3mm FILM) o 6m (5mm FILM) 3 logm Fig. 11 (g) • X® o1 1 — ' — i — • — r KH-70-3 RUN NO. 53 JULY 19 '70 IMPACTOR ROD • 6m X 6m (3mm FILM) x X . X _i_ 3 log m Fig. 11 (i) X X I E , -2, CD I r r © Id3 X 0 0 in* I 1 10V £ -2 3 \ o i r i • r KH-70-3 RUN NO. 52 JULY 19 '70 IMPACTOR • 6m 3 log m Fig. 11 (h) ROD X 6m (3mm FILM) " © 6m (5mm FILM)-X X 0 .0.07 0.07 4i * - j — r --, - , -j-KH-70-3 RUN NO 60 JULY 20 '70 IMPACTOR ROD • 6m X 6m (3mm FILM) _L . 004 001 i3 i log»m Fig. 11 (j)
68 Mem. Fac. Fish., Kagoshima Univ. Vol. 22, No. 2 (1973)
2.3. On the efficiency of impaction of sea-salt particles
For the use of the impactor, two kinds of correction should be considered, one is the effici ency of impaction of the impactor, and the other is the retention factor of particles. Firstly, the efficiency of impaction of the impactor with a round orifice of 1 mm diameter is considered to be 100%? for giant sea-salt particles, if the syringe is drawn at a speed of 3 sec per 100cc or faster, as mentioned in section 2.1.1. Secondly, the retention factor of particles is the ratio of the collected particle number to that impinged on the sampling surface. This means that there is a possibility that particles once collected on the sampling surface may be blown off again by the air jet. Toba and Tanaka (1967) found that counted particle number is not twofold for a twofold sampled volume of air, by the experiments for various volumes of air, and it named the retention factor. The value of the retention factor sharply changes for small sampled volumes of air and becomes 0. 3 to 0. 25 for very large ones.
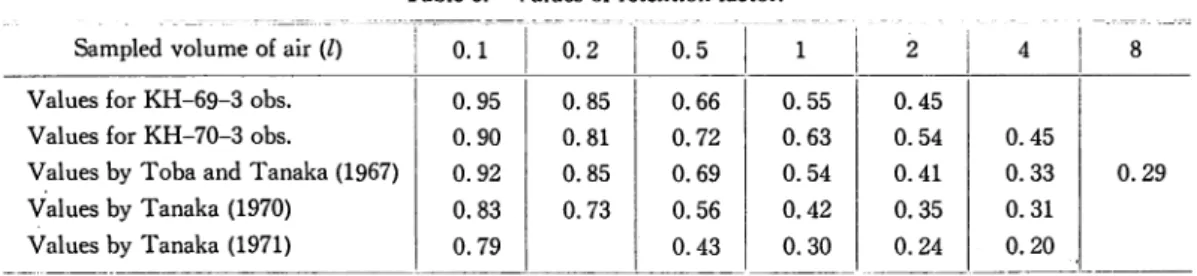
In the Hakuho Maru cruises, the retention factors were obtained from the observations for various sampled volumes of air. The values in the KH-69-3 and KH-70-3 cruises are shown in Table 3, together with the values obtained by Toba and Tanaka (1967) and Tanaka (1970, 1971). The values obtained in the two cruises are almost same, and they are close to the values of Toba and Tanaka (1967). Tanaka's values are smaller than those of the Hakuho Maru obser vation by about 0.1 in each sampled volume of air. It is considered that the sea-salt particles in the observation by Tanaka were drier than in the case of the present observation, because
Table 3. Values of retention factor.
Sampled volume of air (/) 0.1 0.2 0.5 1 2 4 8
Values for KH-69-3 obs. 0.95 0.85 0.66 0.55 0.45
Values for KH-70-3 obs. 0.90 0.81 0.72 0.63 0.54 0.45
Values by Toba and Tanaka (1967) 0.92 0.85 0.69 0.54 0.41 0.33 0.29
Values by Tanaka (1970) 0.83 0.73 0.56 0.42 0.35 0.31
Values by Tanaka (1971) 0.79 0.43 0.30 0.24 0.20
Tanaka's observations were carried out on the ground near shore. The number concentration of sea-salt partilces by the impactor was corrected by use of the retention factor for each cruise, respectively.
The efficiency of impaction of film ribbon had been studied by Langmuir and Blodgett (1946) and Ranz and Wong (1952) on the bases of experiments and theoretical considerations. Ranz and Wong showed the efficiency of impaction of aerosol particles, for various cases such as rectangular and round aerosol jet with width or diameter Dj against the flat plate, and the efficiency of impaction of disk and ribbon with width or diameter Dj (two-dimensional model of a sphere and of a cylinder, respectively) placed in aerosol streams. These results were presen ted in graphical forms, where the efficiency of impaction was plotted as a function of the dimen-sionless parameter expressed by
CHAEN : Studies on the Production of Sea-Salt Particles on the Sea Surface 69 z g »— o u . o >-o z UJ o LL. IU 1 5 mm 1 i FILM i—• 1 i ' -W. F. 4 Uios^msecf1 1 _ RHio=90 V. • -• • • • • i • • • • 0.1 -i 1 • • • • • 1 -0.01
-/
• • i : • • • • 1 i i i i -10 3mm FILM W.F. 2 U»= 2.5msec"1 RHto=887. 2 log m Fig. 12 (a) T z o z o i— o LL O >-O z UJ o IU I » I l • . • 5mnr W.F. U10= RHm filn 6 12.5 m = 887. Bee"' • • • 1 m^ 0 : -• -• • • • • • t 0.1 -• • • 1 • -0.01 -• • I . • 1 l l I i 1* 10 2 log m Fig. 12 (b) £ 1 ~ 1 - 3mm 1 FILM 1 1• 1 1 ' W.F. 3 •• U»o=*3.9m sec' RHio=77 •/. t _ — • s • • • • • — • • • — - -• • — • • • -• -_ULt . 1 • -A I i 1 1 2 O 0.1 -o£ 0.01
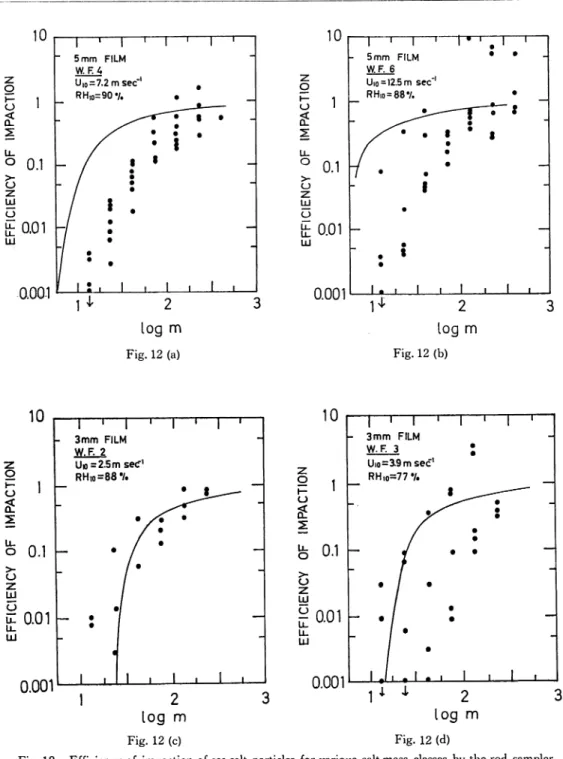
-0.001 I I 2 log m Fig. 12 (c) Fig. 12 (d)Fig. 12. Efficiency of impaction of sea-salt particles for various salt-mass classes by the rod sampler using 5-mm and 3-mm wide films, and for each wind force : (a) 5 mm, W. F. 4, (b) 5 mm, W. F. 6, (c) 3 mm, W. F. 2, (d) 3 mm, W. F. 3, (e) 3 mm, W. F. 4, and (f) 3 mm, W. F. 5. Solid
curve indicates the theoretical efficiency of impaction calculated from equation (2.1) by Ranz
70 Mem. Fac. Fish., Kagoshima Univ. Vol. 22, No. 2 (1973) o IL. o z UJ o Ul U-LU 10 1 0.1 -I ' I - 3 mm FILM 1 1 W.F. A • U»o =66m sec' _ RH,o=77% • • t -^^~~ t • -i • • 1 • / • i -— / _ 1 • -• i . i • . i 1 1 0.01-0.001 2 log m Fig. 12 (e) LL. O >• U 0.1 UJ
£ 0.01
0.001 "1 i—I—r 3 mm FILM W.F. 5 Ujo=9.5msec' RHio = 907. .f t
_]_ 2 log m Fig. 12 (f) _1-where, pp and Dp was the particle density and the diameter, respectively, U the velocity of uniform air flow or jet, pt the viscosity of air, which were all expressed in the c.g.s. unit. The
J<p is a quantity which is proportional to the particle diameter, Dp, when C = 1, namely,
i
(CUIlSfiDj)2 = constant for a certain collector under a specific air flow, and the pp takes re
spective values at the conditions of the relative humidity under consideration.
In the Hakuho Maru cruises, the efficiency of impaction of the rod sampler was obtained as the ratio of the particle number by the rod sampler to that by the impactor, from the simultaneous observations. The efficiency of impaction for each class of the salt mass is shown in Fig. 12, which is presented for each wind force. The solid curve in the figure represents the theoretical efficiency of impaction under the condition of the mean wind speed and the mean relative humidity at the time of observation, calculated from equation (2.1). The observed efficiency of impaction coincides with the theoretical one, when the wind speed was weak as 2 or 3 m sec-1. In the case of wind speed larger than 5m sec-1, both are not in agreement for the salt-mass class of about log m ±J2, namely, the observed efficiency of impaction is low compared with the theoretical one. However, in the salt-mass class of log m ^ 2.25, the efficiency of impaction for the 3 mm wide film is almost 90$?, and for the 5 mm wide film, it is a little lower compared with that of the 3 mm wide one. Naturally speaking, 3 mm wide film is more reliable than 5 mm one, in the efficiency of impaction, as also shown in Fig. 13.
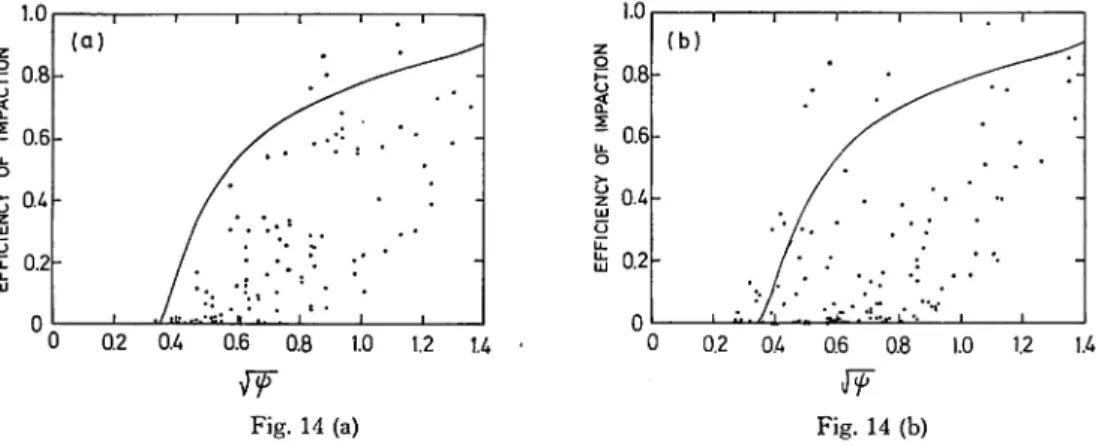
The efficiency of impactions of 5 mm and 3 mm wide films, for salt-mass classes of logm
<^ 2.5, are plotted against V~^~, respectively (Fig. 14. a, b). The figures show a large scattering
of points. Consequently, it is concluded from the data obtained in the present observation that
to apply, without consideration, the normalized equation (2.1) by Ranz and Wong is unsuitable.
The fact that the observed values of efficiency of impaction scatter largely compared with the experimental results by Ranz and Wong may be caused by the results of the field observation under the turbulent air flows.
z o SE LL O >-10 0.1 UJ
t 001
UJ 0.001 Fig. 14CHAEN : Studies on the Production of Sea-Salt Particles on the Sea Surface 71
~i—•—i—'—r 5mm and 3mm FILM Uio= 8.0 m sec"1 RH)0 = 96% I U I ' I ' I • - 5 mm and 3 mm FILM 1 1 U,o =9.8m sec"' T . RHI0-=93 7.
TIO
• • a < - X -a : x 2 • b o.i - ->- -• X _ o z LU c 0.01 — Ll. UJ n n n i I • X 1 I . 1 . 1 1 J_ 1 0.2 0.4 J_ _L 2 3 i 2 3log m
log m
Fig. 13 (a) Fig. 13 (b)
Fig. 13. Efficiency of impaction of sea-salt particles for various salt-mass classes by the rod samplers
using 5-mm and 3-mm wide films of the simultaneous observations. Crosses and dots indicate 5-mm and 3-mm wide film, respectively.
1.0 0.8 S06 0.4 0.2 (b) i i I 1 -;../i .... W-.*.'.'... L* *v 1 0.6 0.8 1.0 1.2 1.4 • 0 0.2 0.4 0.6 0.8 1.0 1.2 1.4
Fig. 14 (a) Fig. 14 (b)
Normalized efficiency of impaction of sea-salt particles for the salt-mass class of log m <£ 2. 5
by the rod sampler, (a) 5-mm wide film and (b) 3-mm one. Solid curve indicates the theoretical efficiency of impaction by Ranz and Wong (1952).
3. Vertical distribution of sea-salt particles in the lowest atmospheric layer above the
sea surface
3.1. Toba's theory concerning the vertical distribution of sea-salt particles
As to the theoretical study on the vertical distribution of sea-salt particles in the lowest atmospheric layer above the sea surface, there is only one theory of the equilibrium distribution by Toba (1965a). After sea-salt particles are produced on the sea surface, they are suspended in the atmospheric layer above the sea surface, by the balance between falling due to the
grav-72 Mem. Fac. Fish., Kagoshima Univ. Vol. 22, No. 2 (1973)
itational force and the eddy diffusion. While a sea-salt particle is suspended in the form of a
droplet in the air, it has the equilibrium vapor pressure for a solution of the salinity of that droplet. If the vapor pressure surrounding the droplet is smaller than the equilibrium vapor
pressure on the droplet, the size of droplet becomes small and the density of saline solution be
comes large due to evaporation. In the contrary case of the condition of vapor pressure, the size of the droplet becomes large and the density of solution becomes small through condensa
tion. The equilibrium relative humidity for a"droplet of saturated salt solution is about 75^. Toba's theory (1965 a) is summarized as follows. The vertical distributions of wind speed, vapor pressure and temperature obey a logarithmic law. He considered a case where a steady state holds with no horizontal gradient, but the fall velocity by the gravitational force, w, of
sea-salt particles as well as the eddy diffusivity, D, change with the height, z. Although the fall velocity varies in a complicated way from droplet to droplet, for simplicity, each droplet instantly attains its equilibrium salinity for the vapor pressureand temperature of the surround
ing air, and the vapor pressure and temperature are given as functions of z. Consequently, the terminal velocity is a function of z, if the mass of salt is given. Now, the equation of diffusion of the number concentration of sea-salt particles, 0, is written as follows
d , d
Kh
0 (3.1)where the eddy diffusivity is expressed by D = ku*(z+zo), and where k is the von Kalman con stant and u* the friction velocity. For the boundary conditions : 0 = do at z = 0 and 0 = 0 at z = oo, the solution of equation (3.1) is expressed in the following form
log (dido) = -tJurfx (RH™> 7io> z)
(3. 2)
In this expression, the logarithm of the ratio 6 to do is expressed as being proportional to the
1000
/Go
RH=95% log m=25
Fig. 15. Theoretical vertical distribution of sea-salt particles of log m = 2. 5, calculated from equation (3. 2) by Toba (1965a) for the condition of RH10 = 95%.
CHAEN : Studies on the Production of Sea-Salt Particles on the Sea Surface 73
two thirds power of salt masscontained in a particle, m, and inversely proportionalto the wind speed at the 10-m level, C7i0, with a factor Xwhich is a function of the relative humidity at the
10-m level, RHio, the friction coefficient, fio and the height, z. Since the value of rto does not
vary largely in the wind speed range from three or four to ten and odd m sec-1, and is about 1.6X10⁻³, the value of %at a height of 10 m is regarded as a function of RHio only. Conse quently, the value of dido is expressed as the function of m, Ui0 and RHio. In conclusion, the
vertical distribution of the number concentration for each class interval of mass of salt, d, is along a straight line on a logarithmic diagram of \ogz-\ogd.
According to this theory, the higher the relative humidity and the weaker the wind speed, the more the particle number concentration decreases with height, on the other hand, the
lower the relative humidity and the stronger the wind speed, the more the particle number concentration is distributed nearly uniformly in the 10-m layer over the ocean. Fig. 15 shows the theoretical vertical distribution for the class of salt mass of logra = 2. 5 under .RHio = 9596, the value of d/do being calculated from equation (3. 2).
As to the confirmation Toba's theory from the results of observation, there are two signifi cant points, one is the shape of the distribution on the log z-logd diagram and the other is its vertical gradient. To compare the observed gradient with the theoretical one for a given RH (%) means to check the assumption that the sea-salt particles instantaneously attain their equilibrium salinities for the environmental air at their momentary height.
3.2. Observed vertical distribution of sea-salt particles
The situation of the vertical distribution of the number concentration of sea-salt particles is
now examined on the basis of much data. The observations of vertical distribution were carried
out at 3 or 4 levels above the sea surface on board ships, as already described. At the anchored station in the East China Sea, the hourly observation for two days was carried out, under weak
X o AUG. 22 '67 16h 2.5 m/s 73 7. 10' t 1—i—i i u i f r '« ' I
J- 1 I I
""i
y
1 | 1 Ml| —i 1—i \ i i rr | i i \ \ j- T T T20h \ . 1.9m/s X 807. / i i i P
21h \
^ 3.3m/s Vr
79 7o
\
22-h 3.6m/s , 80 7o i i i 111,/ -^-""^ 4.5 m/s\
J
78 7.
l 1 1 10" 10 10' 0 (cm"3) 10"Fig. 16. Some examples of hourly observed vertical distribution of sea-salt particles for two days from
74 Mem. Fac. Fish., Kagoshima Univ. Vol. 22, No. 2 (1973)
wind conditions of 1. 9—5. 8 m sec-1 and a mean relative humidity of 77^. Some of these
results are shown in Fig. 16. The shape of the vertical distribution of seasalt-particles every
hour has various types. The values of d for a class of log m = 1. 28—2. 53 at each level are distributed in a wide range of 5X10"3—lXlO-1 cm"8, but the mean vertical distribution of d is
very close to a straight line on the logarithmic diagram as shown in Fig. 17. The same tendency
1 1 1 1—I—I i I I I I
7
»M • * • *. I.}\,*:••?&. •: i**. • . •• i» •• •• •• t X2
2
I 1 \ l «&SS« ••• SM?£ *•'•»*•*•• 10' 10'6 (cm"3)
Fig. 17. Hourly observed vertical distributions of sea-salt particles (dots) of 48 times for two days and their mean vertical distribution (solid line with crosses).
9
\ \
\u
0 1 i i r-i—'I
:
V \\
— o o b o•
V
V
. \&
'il
| • i >o — 1:'!
HEIGHT
11ii
2.15< tog m< 2.53 1.45< log m<1.80 1.80< logm<2.!5 W. F. 2 1 Uio =2.5 msec"1 RH10=81% i i . 1 I . . .10"2
.
10'3
0 (cmd) 2.15<log m<2.53 1.45<log m<1.80 1.80< log m<2.15 W. F. 3 Uio= 4.4m sec'1 RHl0=817o 1 -10"2 . . .,. 10"3 0 (cm"3)Fig. 18 (a) Fig. 18 (b)
Fig. 18. Mean observed vertical distribution of sea-salt particles (black circles) obtained on board the Kagoshima Maru in the Indian Ocean, (a) in wind force 2, (b) wind force 3, (c) wind force 4 and (d) wind force 5. Dashed and dash-dot lines with circles indicate the theoretical vertical distributions by Toba's model for the conditions of RHio = 95% and mean RHio at the time
of observation in each wind force, respectively. The abscissa is OjOo in the theoretical model.