近畿大学学術情報リポジトリ
5
0
0
全文
(2) conditions,. and different. acid. concentrations,. in. addition to complicated deterioration mechanisms. The present. study was. therefore. was. evaluated. undertaken. Effects identified. acceleration. results. corrosion. result. for. the. chemical. mechanism. As for the chemical. erosive. ion. were. environment. measurements of carbonation depth, its invasion route. concentration.. concentration. conditions. shown in Table 1 are [3]; results. are shown. 2.1 Materials Mortar was used as the cement hardening agent. used. were. a. commercially. available. ordinary Portland cement (specific gravity: 3.15) for cement and river sand (specific gravity: 2.57) as fine aggregate.. the. corrosion. factor. the. environment. operation. were. elapsed in the. examined. setting with. operation the. ability to. change. another. pH and. environment.. correlation. and for. of the. the. applying different. These. between corrosion a result. the. the and. of. one. environmental. Outline. obtained from references following these.. Materials. the. concentration. (corrosive) phenomenon, it was verified by mass measurement as expansion and corrosion. Using. Experimental. of from. evaluated. 2. Experimental. by. into the mass.. based on the contents shown below, including the evaluation of the extensive applicability of the experiment. as permeation. In addition,. the best available. quality. reagent of sulfuric acid was used as the environment. every 1-wk or 2-wk until 4-wk. Thereafter, it was done every fixed period. Each environmental tank was kept covered to prevent evaporation from the solution surface in the indoor air environment. 2.4 Measurements Each test specimen was removed from the mold on the day after casting; it was cured in water for 4 wk and then cured in an air environment for 2 wk. After the treatment described above, test specimens by group (classified by water-cement ratio) were immersed individually in the sulfuric acid tank. Items such as pH and ion analysis for environmental solution, and mass weight and carbonation depth were examined based on following conditions.. solution. 2.2 Mix proportions, shape and treatment The water cement ratios (W/C) of the mortar were 40, 50 and 60%. The mass ratio of the cement and river sand was a constant value of 1:3. As for the mortar test specimen shapes, A and B were rectangles. and the side surface of specimen (C), all surfaces were. (1) pH and ion concentration The time for measurement of the pH and sulfuric ion concentration were approximately every after 1 wk for 4 wk and every after 2 wk for 4-16 wk in all concentration cases. These measurements were done at the time of replacement of the old acid solution with the new acid. Measurements were done after 1, 3, 6, and 24-hours from the immersion beginning to. painted with resin. 2.3 Environmental condition The initial concentrations of the sulfuric acid. grasp a change in the early stages. Personal pH meter and ion analysis meter were used for each measurement.. solution were 2% (specimen (A) and (B)) and 3%. (2) Mass change and carbonation depth Each mass weight measurement was done at the time of replacing the old environment solution with. and C was a column. For A, both sides of the section were 55 mm; it had 80-mm height. For B, both sides of the section were 40 mm, with 25-mm thickness. For C, the diameter was 25 mm, with 50-mm height. Aside from one 40 x 40 mm section of specimen (B). (specimen (C)). The replacement time for old acid solution in tank with new solution was basically at. —36—.
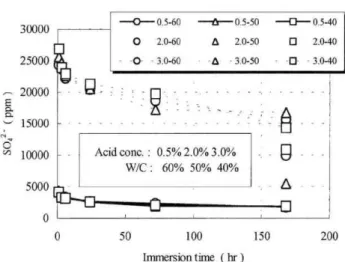
(3) Table. 1 Experimental. outline. the new one, as described in the section "2.2" in all. exposure surface (in the case of (B)) and at the long. cases of the (A), (B) and (C). Regarding the standard. axis (in the case of (C)). These cut surfaces were. mass of each test specimen, the resin coat weight was. sprayed with phenolphthalein solution and were measured from the corroded surface to the boundary. added to the specimen weight after curing in water for 4 wk. To assess the carbonation depth, for test. position of carbonation/non-carbonation. Each carbonation depth was used as an average with five measured values for (B). The value was subtracted. specimens of (B) and (C) were measured using the following procedure. The test specimen was taken out at 1, 2, 4, 8 and 16 wk from the start of exposure in solution and was cut using the dry cutter. Test. from the diameter of non-carbonation. from the initial. diameter before exposure for (C).. specimens were cut respectively at right angles to the. 3. Results The pH measurement. is used generally. For a. strong acid environment, it is difficult to assess the degree of the environment operation by dissociating. —r. the acid degree and the pH meter coverage region.. 25000. Nevertheless, ion measurements can better reflect reaction phenomena than the pH measurements because the quantity. 0.5-60. 30000. —r. 0.5-50. --o--. 0.5-40. O. 2.0-60. A. 2.0-50. o. 2.0-40. - -0-. - 3.0-60. A. - 3.0-50. D. - 3.0-40. related with the reaction is. 20000. 15000. obtained directly.. N O. Acid conc.. 10000. 8. : 0.5% 2.0% 3.0%. W/C :. Therefore, it is expected that environmental action can be estimated using the ion measurement method.. 60%. 50%. 40%. 5000. a. In this report, some of these examination results are discussed as the following.. 0. 50100150. 200. 3.1 Change of environmental operation The change in sulfuric acid ion concentration of each environment is shown in Fig. 1.. Immersion time ( hr ). From a relative point of view, it is assumed that the immersion periods were "the first period" for I. Fig.. In. 1 Change. every. environment,. concentration. day from the start of immersion without the case of 2% (because of measurement in every 1 wk) and "the. long-term. long-term" after "the first period" in all cases.. to the. —37—. At. in sulfuric. decreased. initial. rate. during. ion concentration. the. sulfuric. with immersion. concentrations. comparison. acid. of. of the early the. time. of the. acid. time.. 0.5% stages. ion. and. 3%,. of exposure. sulfuric. acid. ion.
(4) 0. decrease was remarkable.. Especially,. a change is. The. general. remarkable for 1 h from the beginning of immersion from other periods: it increases greatly just at the start. difference. of immersion. After 24 hr, the rate of change is low.. carbonation. 3.2 Operation and corrosion by acid The result shown in Fig. 1 depicts. concomitant. ratio.. each. ion. relation. resulting. However, as. as. Therefore,. that the pH and the ion quantity depend on the number. expression.. the. depth. the. damage. this relationship. is regarded. reaction. The relation to the corrosion. to alleviate these influences. increase. increase.. to be a linear. acid ion is assumed. conditions. Therefore,. ion. and. value of hydrogen. accumulate. the. to. operations. less sulfuric. cement. corrosion. seems. of test specimens and the gross volume of environment solutions in cases under the same. as. significant. water. of the. environmental. Furthermore,. no. from the different. with the accumulated the. environment in this experiment. The results suggest. showed. disappeared. through. to the. and carbonation. (the number of test specimens and the gross volume of acid solution) the results were converted to the value. depth in this case is shown in Fig. 3. This correlation. per unit quantity of test specimen. Therefore, the value of environment operation was calculated for the test specimen unit area.. similar to that shown in Fig. 2.. has a good relation,. 3.3 Relation. between. Regarding. On the other hand, the change of test specimen. as shown by a linear expression. the. operation/damage. 2%. acid. environment,. quantity) and the carbonation depth. The environment operation on each specimen,. the pH/ion measurement.. Using the relation. in. of. which was the accumulated measured change of environment until carbonation testing, was reflected. concentration. by the accumulated value per unit area of the test. This. "3.2",. the. is portrayed. ability. described. another. An example. acid. of this case. in Fig. 4.. result. was. between. based. correlation disappeared. quantity. the pH. environment. operation.. and. applying. was examined.. specimen. The relationship between the accumulation value of the hydrogen ion, which was converted from and the corrosion. was. presumed to be possible to expect the effect to the cement hardened body by the environment using with. was a summation of the mass variation (the corrosion. of 2%-solution,. it. on. the damage of. Fig.. 3, showing. and the accumulated. sulfuric. acid. ion. as. same calculated. shown in Fig. 2.. method. as that of the 2% case.. 5. -4. s -, b 0. b 3. 0 •. 21. 0 g0 Accumulation value of hydrogen ion by pH (mol/cm2). Fig.. 2 Relationship measurement. between. operation/damage. (operation:. an. In Fig. 4, the results of 3% were plotted using the. carbonation depth for unit area of test specimen, is. •00 0 0 U. a. Accumulation ofdisappearance SO42( x10-3nul/cm2 ) Fig. 3 Relationship. by pH. 2%-acid). between. SO42- ion meaurement. —38—. operation/damage (operation:. by. 2%-acid).
(5) Result points of the 3% case were not plotted out of range of the 2% result. The shape of the. E E. ~. test-specimen in the case of 3% is not identical to that for 2%, but both values might be under identical conditions in terms of calculations for their unit area. Regarding these points, the damage imparted by the acid with 0.5% of low concentration is based and must. Ca -o 0 0 U C0. be examined. In future studies, these conjectures must be investigated in detail and must be assessed using experiments. with lower concentrations. OL. 00.511.52 0 U. than those. used for this experiment.. 2.5. Accumulation of disappearance5042 ( xl0-3moVcm2 ) Fig.. 4 Application. of 3% measurement. to 2% measurement. result. result. 4. Conclusion Operation of the specific acid environment was estimated indicated. as the hydrogen by the pH/ion. ion concentration as measurement. These. by hydrogen ion concentration or the disappeared sulfuric acid ion for unit area of test specimen. The. accumulated values of environmental operation were. damage was assumed as a summation with the corrosion and carbonation depth. Good correlation. related. existed between the operations and their respective. with. the. depth. of. the. corrosion. and. carbonation depth, which reflect the degree of damage. Some conclusions from obtained results are as. damage levels.. follows.. (3) The same degree of damage might not always be shown, even with identical operations (the mass. (1) In each environment, sulfuric acid ion decreased according to the immersion period of the test. decrease and the carbonation rate) because of different acid concentrations if a relation between operation. specimen. Especially, the rate of decrease in the early. and. stages was remarkable. environment is applied to another acid environment. Therefore, detailed examinations are necessary for. compared to that for other. periods. (2) It was assumed that the environmental operation can be assessed according to the accumulation value. damage. obtained. from. the. specific. acid. other subjects, as in this report.. References [1] JSCE Concrete Committee: Japan Concrete Standards, their Maintenance and Management, JSCE, 2001.1. [2] T. Kawahigashi: The corrosion evaluation of concrete under the sulfuric acid environment, The 57th Japan Cement Institute Conference, JCI, pp.158-159, 2003.5. [3] T. Kawahigashi: Corrosion of steel in mortar under sulfuric acid environment, Concrete structure scenarios, JSMS, vol.5, pp.27-32, 2005.10..
(6)
図
関連したドキュメント
As far as local conditions at infinity are concerned, it is shown that at energy zero the Dirac equation without mass term has no non-trivial L 2 -solutions at infinity for
We extend a technique for lower-bounding the mixing time of card-shuffling Markov chains, and use it to bound the mixing time of the Rudvalis Markov chain, as well as two
We study existence of solutions with singular limits for a two-dimensional semilinear elliptic problem with exponential dominated nonlinearity and a quadratic convection non
It is suggested by our method that most of the quadratic algebras for all St¨ ackel equivalence classes of 3D second order quantum superintegrable systems on conformally flat
Keywords: continuous time random walk, Brownian motion, collision time, skew Young tableaux, tandem queue.. AMS 2000 Subject Classification: Primary:
It leads to simple purely geometric criteria of boundary maximality which bear hyperbolic nature and allow us to identify the Poisson boundary with natural topological boundaries
[2])) and will not be repeated here. As had been mentioned there, the only feasible way in which the problem of a system of charged particles and, in particular, of ionic solutions
Rostamian, “Approximate solutions of K 2,2 , KdV and modified KdV equations by variational iteration method, homotopy perturbation method and homotopy analysis method,”
