Tax differentials and inflow of foreign direct
investments : evidence from foreign operations
of U.S. multinational companies
著者
Watanabe Yuichi
権利
Copyrights 日本貿易振興機構(ジェトロ)アジア
経済研究所 / Institute of Developing
Economies, Japan External Trade Organization
(IDE-JETRO) http://www.ide.go.jp
journal or
publication title
IDE Discussion Paper
volume
263
year
2010-12
INSTITUTE OF DEVELOPING ECONOMIES
IDE Discussion Papers are preliminary materials circulated
to stimulate discussions and critical comments
Keywords: Tax differentials, FDI inflow, Developed/Developing countries,
Income/Non-income taxation
JEL classification: F23, H25
*
East Asian Studies Group, Area Studies Center, IDE-JETRO ([email protected])IDE DISCUSSION PAPER No. 263
Tax Differentials and Inflow of Foreign
Direct Investments: Evidence from Foreign
Operations of U.S. Multinational Companies
Yuichi WATANABE*
December 2010
Abstract
This paper concerns the measurement of the impact of tax differentials across
countries on inflow of Foreign Direct Investment (FDI) by using comprehensive data
on the foreign operations of U.S. multinational corporations that has been collected
by the Bureau of Economic Analysis (BEA), the U.S. Department of Commerce. In
particular, this research focuses on examining: (1) how responsive FDI locations are
to tax differentials across countries, (2) how different the tax effect on FDI inflow is
between developed and developing countries, and (3) whether investment location
decisions have become more or less sensitive to tax differences between countries
over time ranging from the late 1990s to the early 2000s. Estimation results suggest
that high rates of corporate income taxation are associated with reduced foreign
assets of U.S. multinational firms in all industries by decreasing the return to foreign
asset investment. Further, foreign assets of U.S. multinationals in all industries have
become more responsive to non-income tax differentials across countries than to
income tax differences from 1999 to 2004. Empirical estimates also indicate that
foreign investment by American firms is associated with higher tax sensitivity more
in developed countries than in those that are developing.
The Institute of Developing Economies (IDE) is a semigovernmental,
nonpartisan, nonprofit research institute, founded in 1958. The Institute
merged with the Japan External Trade Organization (JETRO) on July 1, 1998.
The Institute conducts basic and comprehensive studies on economic and
related affairs in all developing countries and regions, including Asia, the
Middle East, Africa, Latin America, Oceania, and Eastern Europe.
The views expressed in this publication are those of the author(s). Publication does not imply endorsement by the Institute of Developing Economies of any of the views expressed within.
INSTITUTE OF DEVELOPING ECONOMIES (IDE), JETRO 3-2-2, WAKABA,MIHAMA-KU,CHIBA-SHI
CHIBA 261-8545, JAPAN
©2010 by Institute of Developing Economies, JETRO
No part of this publication may be reproduced without the prior permission of the IDE-JETRO.
1
I. Introduction
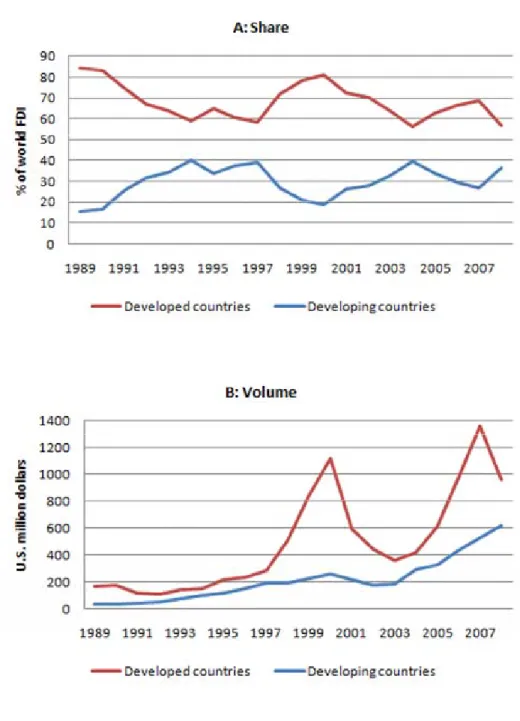
The pattern and volume of the world’s foreign direct investment (FDI) have changed
dramatically in the last two decades. According to recent data reported by the United Nations
Conference on Trade and Development (UNCTAD), the share of FDI inflow to developing
countries has increased from 16 percent of total world FDI in 1989 to 37 percent in 2008.
Developed countries have gradually decreased their share of inward FDI from 84 percent of
total world FDI in 1989 to 56 percent in 2008 (see Figure 1A). Even though developed
countries still exceed developing countries in share and magnitude of inward FDI, developing
economies have been rapidly rising as major capital-importing countries in recent years.
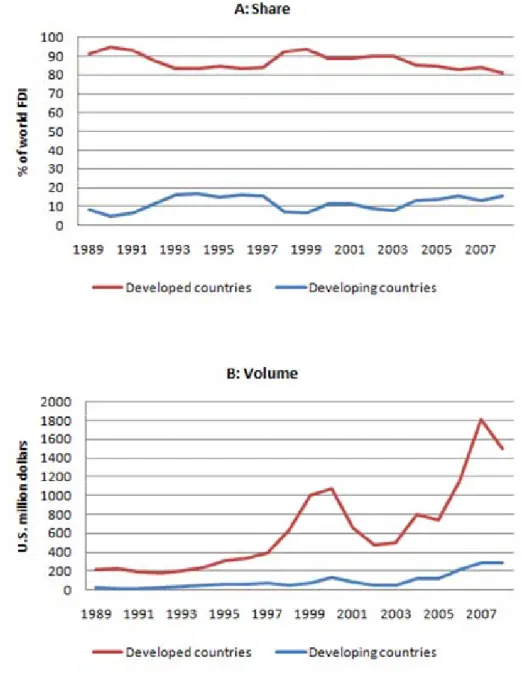
Figure 2A shows that most (more than 80 percent) of world FDI outflow has long been
carried out in developed countries. They also have had the upward tendency of outbound FDI
in volume over the past two decades; this is in stark contrast to the small increase in
developing countries (see Figure 2B). Thus, recent world FDI flow, most of which comes from
developed regions, has been diversified into not only developed countries but also developing
economies.
Many explanations have been presented to account for the change in distribution of FDI
flow in the world and the growing willingness of investors to locate FDI in developing
countries. Major explanations focus on: (1) market-oriented factors such as host market size or
potential and unit labor costs, and (2) institutional factors such as financial liberalization and
deregulation in developing countries. This paper sheds light on the impact of tax differentials
across countries on FDI inflow by using comprehensive data on the foreign operations of U.S.
multinational corporations collected by the Bureau of Economic Analysis (BEA), the U.S.
2
In open economies with free capital mobility, international tax differentials across
countries are capable of affecting the size and location of international capital flow.
Higher/lower tax rates on profits or returns are likely to decrease/increase the after-tax rate of
return, thereby changing investor incentive and decision-making to commit to investment
(Hines, 1999). Similarly, various types of operational and financial activities of multinational
firms (e.g. profit shifting, transfer pricing, dividend repatriations, royalty payments, and
allocation of real investment) are also likely to be sensitive to tax differences between
countries that are in search of higher after-tax rate of returns.
Governments often make careful consideration of the use of tax incentives (i.e. what tax
instruments to use and what rates to impose) in order to attract FDI inflow which can
contribute to local economic development. At the same time, these governments are faced with
downward pressures on the taxation of capital or corporate income that is posed by
international tax competition and globalization of capital markets (Wilson, 1999).
Motivated by the potential importance of taxation in the growing openness of the global
economy, this paper focuses on examining the impact of tax incentives on inward FDI across
different economies and attempts to address the following questions: (1) How responsive are
locations of FDI by U.S. multinational corporations to tax differentials across countries? (2)
Are there clear differences in the effect of taxation on FDI inflow between advanced and
developing economies? (3) Have investment location decisions become more or less sensitive
to tax differences between countries over periods from the late 1990s to the early 2000s?
The first question about tax responsiveness of FDI inflow to different countries has been
embedded in almost all literature that has empirically investigated the impact of host country
3
Following these studies with more recent data should provide additional evidence on how tax
differentials across countries have had an impact on the distribution of locations of FDI inflow.
The second question about differences in the tax effect on FDI inflow between advanced
and developing economies has been studied in the context of recent diversification of FDI
inflow in both developed and developing countries. With the exception of Hines (2001),(1) the
impact of taxation on FDI in developing economies has not been examined thoroughly in
previous related work. The relevant earlier study deals exclusively with tax responsiveness of
bilateral FDI flow among OECD or EU countries particularly due to the availability and
quality of data. The second question is also intriguing from a fiscal point of view. Specifically,
how are empirical findings associated with the difference of taxation structures between
developed and developing countries and the recent changes in the composition of tax revenue
in developing economies (Keen and Simone, 2004)? Answers to this question should yield new
insights for tax policies in developing countries.
The third question about the change in tax sensitivity of FDI locations over time has
been previously analyzed in Altshuler et al (2001), which suggested that the location of foreign
real capital in U.S. manufacturing affiliates became more sensitive to tax rates in the period
from 1984 to 1992. Altshuler and Hubbard (2003) also found that the location of foreign assets
in U.S. financial subsidiaries was less responsive to variations in effective tax rates across host
countries since the provisions of the Tax Reform Act of 1986 in the U.S. Analysis in this paper
updates data from the late 1990s to the early 2000s. It should provide implications for tax
(1)
Hines (2001) evaluates the effect of the provision of tax-sparing credits for investment in developing countries. Tax-sparing is often provided by governments in high-income countries as a fiscal incentive for their own firms. It often takes the form of allowing firms to claim foreign tax credits against home-country tax liabilities. Hines compares patterns of outbound FDI by Japanese firms that are permitted to claim tax-sparing credits for their investments in certain developing countries and by U.S. firms that are not allowed.
4
sensitivity of foreign investment by U.S. multinationals since the trend of the distribution of
locations of FDI inflow between developed and developing economies changed during that
time period.
The complexity of international taxation has often presented a difficulty in conducting
empirical research, not only because taxation of international transactions is different from that
of domestic economic activities, but also because the same foreign-source income is taxed by
multiple governments. In order to prevent international double taxation, which would
otherwise strongly discourage international business activities, most countries adopt one of
two systems for taxing the foreign income earned by the domestic residents.
Under the exemption system (territorial taxation), foreign-source income that is taxed in
the host country is exempt from home country taxation. Further, since firms that earn foreign
profits have no tax liabilities for the home country under the exemption system, no foreign tax
credit is given to them. Too, under the credit system (worldwide taxation), foreign tax
liabilities in the host country are credited against the home country tax.(2) In general,
corporations in the country which chooses the foreign tax credit system are permitted to defer
their tax liabilities on certain unremitted foreign profits until they are repatriated to the home
country through dividend payments (Hines, 1999).
Researchers such as Slemrod (1990) and Hines (1996) have explored tax responsiveness
of FDI flow depending on tax schemes in operation in the investor’s country. In order to
investigate the three questions previously mentioned, research in this paper is concerned more
with different levels of economic development in countries rather than with differences in
(2)
The foreign tax credit is usually not allowed to exceed the home-country tax liability on
foreign-source income in order not to reduce home-country tax liabilities on profits earned within the home country.
5 taxation regimes.
The remainder of the paper is organized as follows: Section II contains a critical review
of previous empirical studies that estimate tax effects on U.S. FDI flow. Section III includes
description of the data used for estimations. Section IV presents econometric methodologies
and empirical results of estimating tax sensitivity of FDI inflow in pooled regressions. Section
V contains estimation methods and results in the first differenced form. Interpretations of the
findings focusing on the relationship between taxation and FDI inflow are discussed in Section
VI. The final section contains conclusion as well as suggestions for future study.
II. Review of Literature
1. Hartman (1984)
In an empirical study focusing on the impact of taxation on U.S. FDI flow, Hartman
used aggregate time series data from 1965 to 1979 and estimated the response of FDI (financed
separately by retained earnings and transferring funds from abroad)(3) to three variables in the
following regression model:
ln / ln 1 ln 1 ln 1
1
where / is the aggregate inflow of direct investment in the U.S. financed either by
retained earnings or transfers of funds, is U.S. GNP, is the gross pretax rate of returns to
foreign investors in the U.S., is the gross pretax rate of returns earned on all capital in the
U.S., and is the average tax rate on U.S. capital owned by foreign (domestic) investors.
(3)
Hartman (1984) assumes that the marginal investment decisions of firms is affected differently by taxes depending on whether the investing funds are already retained in the U.S. or if a firm is contemplating transferring funds to the U.S.
6
The first term on the right hand side of the equation refers to the after-tax rate of returns
realized by foreign investors in the U.S. The second term refers to the overall after-tax rate of
returns on capital in the U.S. reduced by the U.S. tax rate on domestic capital earned by
foreign investors. The first two terms reflect the expected return to new FDI in the U.S., and
their coefficients are expected to be positive since the higher rate of returns tends to increase
the FDI inflow. The third term on the right hand side is the relative tax term and represents the
net-of-tax rate of returns on the same investment received by U.S. investors relative to that
received by foreign investors. Inclusion of this term attempts to capture the possibility that tax
changes in favor of domestic investors will decrease the return to foreign investors who
acquire U.S. assets by affecting the valuation of these assets and thereby reducing foreign
investment in the U.S. Thus, the coefficient of the third term is expected to have a negative
sign.
Results of Hartman’s regressions show that the estimated coefficients of the first two
variables have the expected positive sign and are significantly different from zero. Moreover,
the estimated coefficient of the third term reveals a significantly negative association of the
FDI-GNP ratio (in both retained earnings and transferring of funds) with the relative tax rate
on foreign investors compared with U.S. investors. Based on these results, he concludes that
the negative effect of U.S. taxation on FDI inflow, financed by both retained earnings and
transfers of funds, is quite strong.
Although Hartman’s model has become a basis for a number of subsequent studies on
the effect of taxation on FDI flow, it has some shortcomings. First, the study only focuses on
the U.S. tax rate on foreign or domestic investors and the rate of returns on investment in the
7
abroad to foreign investors. It disregards the effect of tax differentials across foreign countries.
Hartman defends the absence of foreign tax rates applied to the aggregate FDI by simply
stating that the average values of the foreign tax rates may be relatively constant over time. He
also assumes that the home country tax applied to U.S.-source income plays no role in the
marginal investment decisions of firms. It would be optimal for U.S. subsidiaries to finance
their planned investment first by retained earnings without repatriating their profits, and then
only when they exhaust total earnings by transferring funds from abroad, a process which does
not have foreign tax liabilities.
However, FDI flow can also be influenced by the tax system of the capital-exporting
home country. Under the exemption system, firms consider the difference of the tax rate on
FDI between the home and host country. They benefit from the home country tax exemption
unless the host country’s tax rate is higher than the home country’s tax rate. Under the foreign
tax credit system, when firms decide whether to reinvest or repatriate foreign earnings, they
often compare the potential tax cost of making an investment from retained earnings which
will be taxed by the host country with that of remitting foreign profits as dividends which are
taxed by the home country.
2. Slemrod (1990)
Slemrod investigated the effect of both U.S. and home country taxation on FDI in the
U.S. by disaggregating FDI by the seven major investing countries according to their taxation
system (exemption or credit). He also used an alternative measure for the tax rate which is the
marginal effective rate of tax on new investment(4) rather than the observed average tax rate
(4)
8
with controls for the influence of nontax variables on FDI (e.g. the total GDP ratio, the
unemployment rate, and the real exchange rate).
Slemrod’s regression model is given in the following equation:
/
, , , , , ,
where the dependent variable is the FDI inflow (financed either by retained earnings or
transferring funds) from country i at time t as a ratio of U.S. GNP, is a measure of the
marginal effective corporate tax rate on investment in the U.S. at time t, is the foreign
marginal effective tax rate in country i at time t, and are the lagged (t-1,
t-2) tax rate terms to allow for the time it takes to implement an investment decision, and is a vector of nontax variables of country i at time t including year dummies.
Slemrod starts with a replication of Hartman (1984) with corrected and updated data
from 1956 to 1984. The results of his estimation generally support the negative effect of the
U.S. marginal effective rate of taxation on total FDI and transfers of funds, but not on retained
earnings.(5) In bilateral cross-sectional analysis covering 1962 to 1987, the evidence does not
show a clear difference in tax sensitivity of FDI from countries that adopt the exemption
system of the U.S. and countries that grant foreign tax credits. This evidence led him to
conclude that the home country tax rate as well as its tax system is not an important
determinant of FDI flow.
Even though Slemrod’s cross-sectional approach, based on the criticism of the aggregate
government’s desired tax function and assumed that a firm anticipating no future tax changes would set its marginal product of capital equal to 1 ⁄ 1 , where is the relative price of capital goods, is the real discount rate, is the geometric rate of economic depreciation, is the investment tax credit, is the statutory corporate tax rate, and is the present value of depreciation allowances per dollar invested. The cost of capital is thus affected by the ratio 1 ⁄ 1 , and it is this ratio that reflects the government’s tax choice, namely the marginal effective tax rate. (5)
Slemrod (1990) suggests that deteriorating economic conditions in home countries may preclude the negative association of U.S. tax rates with FDI financed by retained earnings.
9
time series approach exploited by Hartman (1984), had a great influence on subsequent
studies,(6) shortcomings still remain. One of the difficulties facing the cross-sectional analysis
of a relationship between taxation and FDI location is the inevitable omission of many
important determinants of FDI that may be correlated with tax rates. In particular,
cross-sectional variation in national tax rates and tax systems may be correlated with both
observable and unobservable national differences in economic variables that influence
investment, and this may bias estimation of the effect of taxation on FDI flow.
3. Hines (1996)
Hines built on Slemrod’s (1990) approach of using data on bilateral FDI flow into the
U.S. but incorporated state fixed effects in estimating the effect of state corporate income tax
rates on the distribution of FDI within the U.S. The idea behind this study was to compare the
pattern of foreign investors whose home governments grant foreign tax credits for federal and
state income taxes with the pattern of those whose home governments exempt income earned
in the U.S. from their home country taxation. The inclusion of state fixed effects implicitly
controls for state attributes which are hard to measure, as long as the effect of these attributes
does not systematically vary between foreign investors from countries with different tax
systems.
Hines’s main specification is given in the following Tobit regression:
(6)
For example, Swenson (2001) estimated separate conditional logit regressions for different types of transactions (the establishment of new plant, plant expansions, mergers and acquisitions, joint ventures, equity increases, and others) undertaken by foreign investors in the U.S. with the state rate of taxation (but missing home country taxation). Results indicated that the effect of state taxation varies with transaction type; high state tax rates are negatively correlated with the establishment of new plants and with plant expansions while they are positively correlated with acquisitions by foreign investors.
10
where the dependent variable is the state i’s share of each country j’s ownership of
manufacturing property, plant, and equipment (PPE) rather than aggregate FDI, is the
unobservable state fixed effects, is a country-specific constant assumed to be close to zero,
is the observable size of business activity in state i, is the statutory tax rate on corporate
income in state i corrected by depreciation rules and federal deductibility, and is the average
state corporate income tax rate in the U.S. The tax term is thus the weighted state corporate tax
rate measured as a deviation from its weighted average; measures the match between the
PPE ownership of industries located in state i and the extent to which investors from country j
concentrate their PPE in those industries to control for national differences in the industrial
composition of their U.S. investment within manufacturing, and is the censored residual.
In order for unobservable state fixed effects to be estimated in fitting the equation to the data,
Hines imposed the restriction that the coefficients equal each other if j is the exemption
country and equal zero if j is the foreign tax credit country. This makes it possible to
capture differences between investors relative to their tax rate sensitivities.
Results suggest that high state corporate tax rates have a significantly negative effect on
local investment, and foreign investors from exemption countries are considerably more
responsive to state tax rates than those from foreign tax credit countries. In addition, the
inclusion of industrial controls persists with the negative tax effect on foreign investment;
a higher corporate tax rate is significantly associated with a smaller share of PPE ownership by
exemption investors than by foreign tax credit investors.
Overall, Hines successfully explained that FDI inflow to the U.S. is significantly
sensitive to state corporate tax rates and the difference of home-country tax regimes. Also, his
11
have reduced incentives to avoid high-tax foreign locations. However, he failed to demonstrate
whether or not the difference of corporate tax rates between foreign countries has an impact on
inward FDI since he showed no attempt to incorporate home-country tax rate variables or tax
rate differentials between states of the U.S. and home countries.
4. Desai, Foley, and Hines (2004)
Desai, Foley, and Hines investigated the effect of multiple host country taxes on FDI by
U.S. multinational firms and classified host country taxation into direct taxes (corporate
income taxes) and other indirect non-income taxes (e.g. sales taxes, value-added taxes,
property taxes, excise taxes, and import and export duties). This study was motivated by the
following: (1) governments usually impose an array of tax instruments on multinational
activities and international transactions simultaneously, and (2) foreign indirect tax burdens of
U.S. multinational firms significantly exceed their foreign income tax obligations. Further,
American firms are not eligible to claim foreign tax credits for indirect tax payments, and this
raises the possibility that low foreign indirect tax rates are more likely to affect their foreign
investment decisions since they have no tax advantages over other local firms in high-tax
locations.
By exploiting affiliate-level data on the activities of U.S. multinational firms, Desai,
Foley, and Hines attempted to estimate the extent to which higher rates of foreign direct and
indirect taxation reduce the levels of FDI using four types of OLS regressions. The dependent
variables were: (1) log of affiliate assets, (2) log of affiliate gross product, (3) the ratio of
employee compensation to affiliate assets (proxy for capital/labor substitution), and (4) the
12
The foreign corporate income tax rate was calculated by taking the ratio of the sum of
foreign income taxes to the sum of net income plus foreign income taxes for each country, year,
and major industry group (petroleum, manufacturing, and non- manufacturing). Similarly, the
foreign indirect tax rate was calculated by taking the ratio of the sum of indirect taxes to the
sum of gross product in each country, year, and major industry group. Each specification also
included as explanatory variables firm-specific and industry-specific fixed effects (each
dummy variable) along with controls for sizes of host economies (three powers of the log of
GNP).
Empirical results indicate that higher rates of both types of taxation are negatively
correlated with the levels of foreign investment by U.S. multinational firms measured by assets
and output, but indirect tax rates have a slightly greater impact than rates of corporate income
taxation. Conversely, high corporate income tax rates depress capital/labor ratios and profit
rates of foreign subsidiaries while high indirect tax rates have no clear effects on these
variables. Desai, Foley, and Hines illustrated the range of channels through which indirect
taxation influences foreign investment in the absence of factor substitution incentives and
transfer pricing motives by shedding light on the differences in the responsiveness of FDI to
income and non-income taxation.
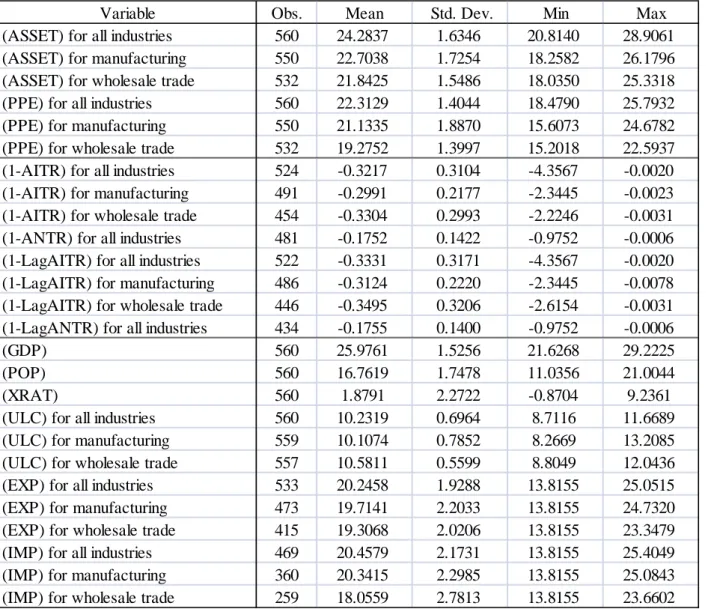
III. Data
Through periodic benchmark and annual surveys, the Bureau of Economic Analysis
(BEA) provides detailed reports of foreign operations and activities of U.S. multinational
corporations aggregated by country and by industry. Research in this paper incorporates
13
responsiveness of FDI flow across countries and differences in the tax impact on FDI inflow
between advanced and developing economies. It takes advantage of the 1999 and 2004
benchmark surveys to answer the third question concerning the change in tax sensitivity of
FDI over time. Both surveys cover more than 50 developed and developing regions and some
major industries. Among these, manufacturing and wholesale trade industries as well as the
case of all industries are considered.(7) These two industries engage in a large amount of
foreign investment among all industries and have little attrition in the BEA survey data.
Data on U.S. outbound FDI comes from the BEA surveys. As described in the literature
review in the previous section, the source of FDI flow consists of several types of categories
and objectives. This paper considers two different types of FDI measures available in the BEA
surveys as dependent variables in various forms of regressions: (1) total assets of foreign
affiliates and (2) net property, plant, and equipment (PPE) of foreign affiliates. Note that both
FDI figures represent historical book values.(8)
Data on tax variables is also derived from the BEA surveys, and this makes it possible to
construct two types of country average tax rates. First, the host-country average income tax
rates can be calculated by dividing total foreign income taxes by the sum of net income and
foreign income taxes in each country.(9) Only foreign subsidiaries of U.S. multinationals with
positive net income and foreign income taxes are included in the calculation of the average
(7)
“All industries” includes mining, utilities, manufacturing, wholesale trade, information, finance (except depository institutions) and insurance, professional, scientific, and technical services, and other industries.
(8)
These measures may be affected by host-country inflation and exchange rates. However, according to Altshuler et al (2001), the inclusion of the inflation term in the regression has no effect on the tax elasticities. In any case, this paper adds exchange rates as an explanatory variable to the regressions that follow.
(9)
The U.S. average income tax rates can also be measured if the effect of home-country taxation on FDI and tax rate differentials between the U.S. and host countries are incorporated. However, they are only available from the benchmark surveys, and the U.S. average non-income tax rates are not available in the BEA surveys. Instead, constant terms are assumed in the estimates that follow to vary by year. To some extent, this makes it possible to control for changes in the U.S. tax rates over the time period.
14
income tax rates in order for the tax measure not to have upward bias.Second, this paper also
uses host-country average non-income tax rates that can be similarly calculated by dividing
total foreign non-income taxes by the sum of value added (gross product) in each country.(10)
The inclusion of host-country average non-income tax rates stems from the potential
importance of indirect taxes for FDI suggested in Desai, Foley, and Hines (2004).
One potential problem with using host-country average tax rates is that the average tax
rate in a country in a given year may be dependent on a change in investment activities in that
country in a prior year, thereby causing it to be endogenous to investment location decisions
(Altshuler et al, 2001). In order to address this potential endogeneity problem, this paper
replaces host-country average tax rates with the one-year lagged average tax rates in
estimations. Using lagged average tax rates as alternative tax variables is also useful to check
the robustness of the original results that used average tax rates.
Analysis took into account several nontax variables to control for country specific
characteristics that may potentially affect the volume and distribution of locations of FDI flow.
Data on GDP and population were collected from the World Bank’s World Development
Indicators; Taiwan data was supplemented by statistics from national sources in the Directorate General of Budget, Accounting and Statistics (DGBAS) of Executive Yuan. These
variables would be expected to reflect the economic size and market potential of countries.
Data on exchange rates was obtained from the IMF’s International Financial Statistics. The
BEA surveys provide data on unit labor costs that are calculated by dividing compensation of
employees in foreign affiliates by total employment of foreign affiliates.
Data on exports (U.S. exports of goods shipped to foreign affiliates) and imports (U.S.
(10)
Similarly, only foreign affiliates of U.S. multinationals with positive value added (gross product) and foreign non-income taxes are included in the calculation of the average non-income tax rates.
15
imports of goods shipped by foreign affiliates) was also taken from the BEA surveys. The trade
terms were interpreted as a proxy for the degree of economic proximity and trade openness of
countries. A country dummy variable was constructed to distinguish developed and developing
countries. A set of regional dummies was also included in every regression form to control for
unmeasured geographic characteristics.
IV. Estimation methods and results in the pooled regressions
1. Models
The pooled regression model was constructed to illuminate the first two questions
addressed in Section 1: (1) How sensitive are the locations of FDI by U.S. multinational
corporations to tax differentials across countries? (2) Are there empirical differences in the
impact of taxation on FDI inflow between developed and developing counties? By using the
1999-2008 annual survey data, expected FDI by U.S. multinational firms could be modeled as
a function of the after-tax rates of returns and other nontax variables that could affect FDI
inflow in an industry of a country as follows:
ln ln 1 , ln
where is inward FDI in country c and industry i in year t, , is the host-country
average income or non-income tax rates, is a vector of nontax variables of each host
country (i.e. GDP, population, exchange rates, unit labor costs, exports, and imports), is a
16
directly interpreted as tax elasticity due to log specification. The estimated coefficient
represents tax elasticity for whole countries in the sample and would be expected to have a
positive sign since higher after-tax rates of returns are likely to increase FDI inflow.
In order to directly investigate the second question on differences in the tax effect on
FDI inflow between advanced and developing economies, the tax term was set to interact with
a dummy variable for developing countries as follows:
ln ln 1 , ln 1 , ln
where is the dummy variable equal to one for developing countries and zero for
developed countries, is a constant term, and is an error term. In this specification, the
estimated coefficient on the tax term represents the tax elasticity for developed countries.
The coefficient on the interaction term ln 1 , , namely , captures the difference between tax elasticity for developed countries and that for developing countries.
Thus, the tax elasticity by country may be summarized as follows:
Tax elasticity for developed countries:
Tax elasticity for developing countries:
2. Results
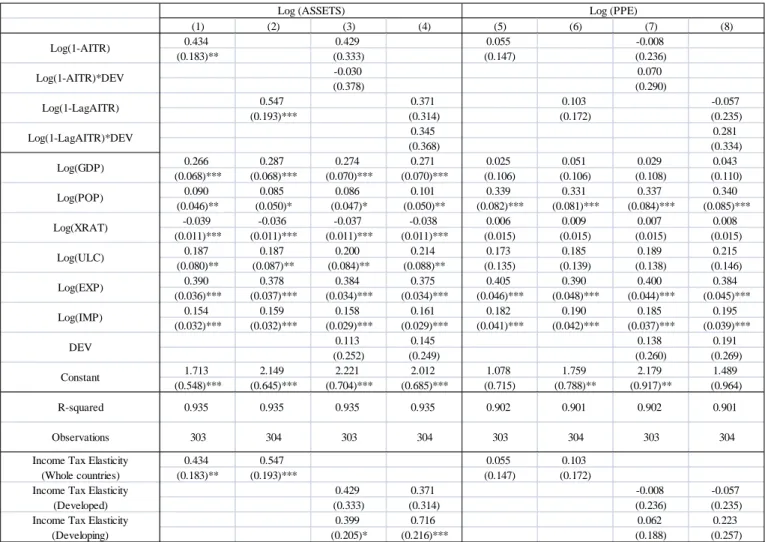
Empirical results for pooled regressions are presented in Tables 1A, 1B, 2, and 3.
Columns (1) to (4) of Tables 1A and 1B present the results for the basic regressions of the log
17
the (lagged) average income or non-income tax rate without the interaction terms. The income
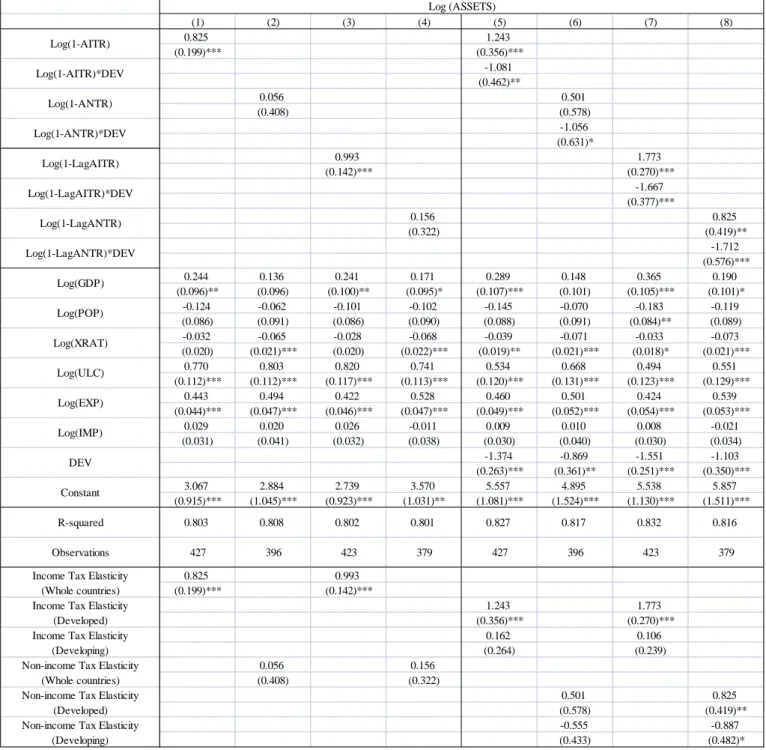
tax elasticities of total assets (columns [1] and [3] of Table 1A) are positive as expected and
significantly different from zero at the one percent confidence level. This result suggests that a
one percent increase in the after-income-tax rate of returns leads to an increase in total assets
of foreign affiliates by 0.83 to 0.99 percent. Also, the location of FDI measured by foreign
assets of U.S. multinational corporations is sensitive to income tax differentials across
countries; they search the higher after-income-tax rate of returns and the lower rate of income
taxation for their foreign assets investment.
The non-income tax elasticities of total assets (columns [2] and [4] of Table 1A) are not
statistically significant at the conventional level of confidence. Also, both income and
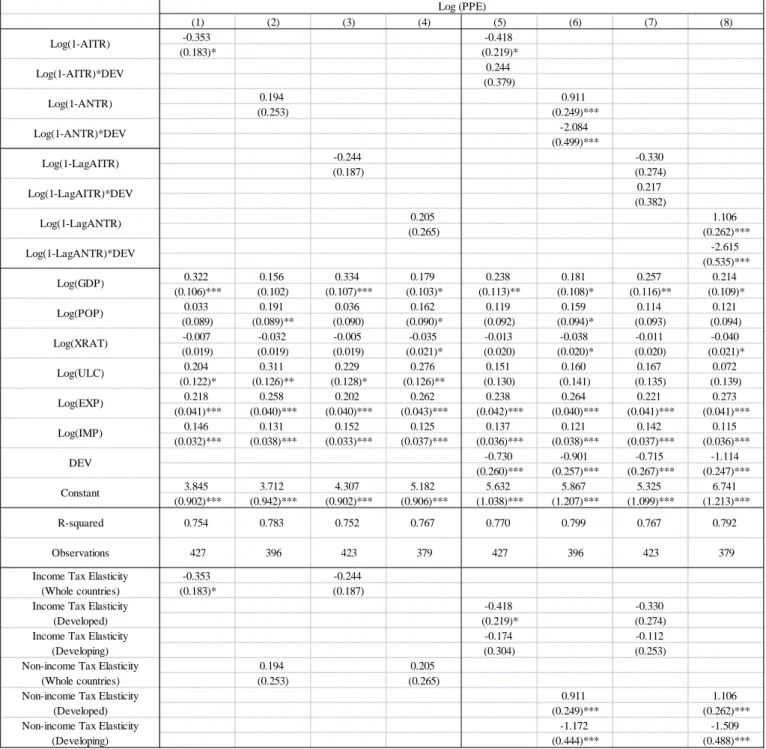
non-income tax elasticities of net PPE (columns [1] to [4] of Table 1B) lack statistical
significance at standard level and partly show negative signs. It can be inferred from these
results that U.S. multinational firms are not responsive to non-income tax differentials across
countries for their foreign investment. Further, the causal effect of taxation on foreign PPE
investment by U.S. multinationals cannot be observed.
Columns (5) to (8) of Tables 1A and 1B show results for regressions of the log of inward
FDI by foreign affiliates of U.S. multinationals in all industries on the log of one minus the
(lagged) average income or non-income tax rate with the interaction terms. The income tax
elasticities of total assets for developed countries (columns [5] and [7] of Table 1A) are
positive as expected and significantly different from zero at the one percent confidence level,
but those for developing countries are not statistically significant. This indicates that a one
percent increase in the after-income-tax rate of returns increases total assets of foreign
18
The coefficients of the interaction terms are negative and significantly different from
zero at the standard confidence level. This result suggests that the responsiveness of total
foreign assets to the difference in income taxation is higher in developed countries than in
developing countries by 1.08 to 1.67 percent. This may be happening because the effect of
income tax incentives (e.g. reduction in corporate income taxation) on FDI inflow is stronger
in developed countries than in developing countries. Consequently, low income tax rates in
developed countries may be more attractive to foreign assets investment by U.S. multinational
firms.
The non-income tax elasticities of total assets for developed countries (columns [6] and
[8] of Table 1A) are also positive (0.5 to 0.83) as expected and in some cases statistically
significant. Conversely, those for developing countries are negative (-0.89 to -0.56) and lack
statistical significance at standard level. The negative signs are contrary to the expectation that
the coefficient of the tax elasticity be positive because higher after-tax rates of returns are
likely to increase FDI inflow.
The coefficients of the interaction terms are also negative and significantly different
from zero at the conventional level of confidence. This result suggests that total foreign assets
in all industries are less sensitive to non-income tax differentials in developing countries than
in developed countries by 1.06 to 1.71 percent. Again, the low rate of non-income taxation in
developed countries attracts more foreign assets investment by U.S. multinationals than that in
developing economies.
Unlike the regressions of log assets, the income tax elasticities of net PPE for both
developed and developing countries (columns [5] and [7] of Table 1B) have negative signs
19
developed and developing countries (columns [6] and [8] of Table 1B) are significantly
different from zero at the one percent confidence level. The former (for developed countries)
are positive (0.91 to 1.11) as expected, but the latter (for developing countries) are negative
(-1.51 to -1.17) and smaller than those in the regressions of log assets. This result, along with
the non-income tax elasticities of total assets, shows that foreign investment by U.S.
multinationals responds to higher after-non-income-tax rate of returns in developed countries
but lower after-non-income-tax rate of returns in developing regions.
The coefficients of the interaction terms in the non-income tax specifications are
negative, significantly different from zero at the one percent confidence level, and greater in
absolute values than those in the analogous regressions of log assets. This result also implies
that net PPE of foreign subsidiaries in all industries are more responsive to non-income tax
differentials in developed countries than in developing countries by 2.08 to 2.62 percent. This
difference may be driven by the difference in the impact of non-income tax incentives on
inward FDI between developed and developing countries as a result of the recent change in tax
structure in both countries; this will be discussed later.
Tables 2 and 3 present empirical results for analogous pooled regressions in
manufacturing and wholesale trade industries respectively. The average non-income tax rates
are not available for both industries from the survey data. Similar to results for all industries,
the income tax elasticities of total assets (columns [1] and [2] of Tables 2 and 3) are positive
(0.43 to 0.55 in manufacturing and 0.24 in wholesale trade) and significantly different from
zero at the conventional level of confidence. However, they are smaller than those for all
industries. This suggests that locations of foreign assets of U.S. multinationals in
20
across countries; they respond to the higher after-income-tax rate of returns and the lower rate
of income taxation for their foreign assets investments.
Unlike results for all industries, neither the income tax elasticities of total assets for
developed countries nor the coefficients on the interaction terms in the regressions of
manufacturing industry (columns [3] and [4] of Table 2) show statistical significance at the
standard confidence level.(11) However, the income tax elasticities of total assets for developed
countries in wholesale trade industry (columns [3] and [4] of Table 3) are positive (0.42 to
0.59) as expected and statistically significant at the five percent confidence level. Further, the
coefficients of the interaction terms are negative and significantly different from zero at the ten
percent confidence level. This indicates that total assets of foreign affiliates in wholesale trade
industry are more sensitive to income tax differentials in developed countries than in
developing countries by 0.46 to 0.68 percent. The impact of income tax incentives (reductions
in income tax rates) on FDI inflow may be stronger in developed countries than in developing
countries. Note that it is difficult to compare the results for regressions of the log of foreign net
PPE (columns [5] to [8] of Tables 2 and 3) with each industry due to the lack of statistical
significance.
Estimated coefficients of nontax variables are also reported in Tables 1A, 1B, 2 and 3
even though these are not the focus of this paper. Among nontax variables, the coefficients of
trade terms (exports and imports), unit labor costs, and GDP mostly have positive signs with
high statistical significance in each industrial category. On the other hand, exchange rates are
(11)
Nevertheless, a view of columns (3) and (4) of Table 2 shows that a one percent increase in the after-income-tax rate of returns promotes foreign assets investment in developing countries in U.S. manufacturing industry by 0.4 to 0.72 percent. However, the income tax elasticities for developing countries in all industries and wholesale trade industry generally show negative signs but lack statistical significance.
21
in general negatively associated with foreign investment by U.S. multinationals except for
regressions of log net PPE in manufacturing industry. The relationship between FDI and
population is ambiguous since the signs change depending on types of FDI and industry.
V. Estimation methods and results in the first difference forms
1. Models
The previous pooled regression model cannot illuminate the third question addressed in
Section 1 regarding whether investment location decisions have become more or less
responsive to tax differentials across countries over time ranging from the late 1990s to the
early 2000s. In order to answer this last question, the pooled estimating equation was changed
to the following model in difference form by taking first differences of the 1999 and 2004
benchmark survey data as employed in Altshuler et al (2001). One of the advantages of the
first difference model is to control for unobservable country fixed effects. Thus, it should
provide more precise estimates if the tax terms are correlated with time-invariant country fixed
effects in pooled regressions. However, the number of observations was dramatically reduced
because the sample was obtained from the difference between data of the two surveys, each of
which contained about 50 countries and regions.
∆ ln ∆ ln 1 , ∆ ln 1 ,, ∆ ln (12)
where ∆ ln ln , ln , , ∆ ln 1 , ln 1 ,,
(12)
22
ln 1 ,, , ∆ ln ln , ln , , ∆ , is a constant term,
and is an error term. The estimated coefficient on the ∆ ln 1 , term is interpreted as the tax elasticity in 2004 for whole countries in the sample. It would be expected
to have a positive sign since higher after-tax rates of returns are likely to promote inward FDI.
Further, the coefficient of the ln 1 ,, term ∆ provides an estimate of the difference between tax elasticity in 1999 and 2004. Therefore, the tax elasticity in 1999 for whole
countries is represented as ∆ .
Similar to the pooled regression model and in order to examine tax elasticity by country
and by year, the tax terms were set to interact with a dummy variable for developing countries
as follows:
∆ ln ∆ ln 1 , ∆ ln 1 ,, ∆ ln 1 ,
∆ ln 1 ,, ∆ ln (13)
where is the dummy variable equal to one for developing countries and zero for
developed countries, ∆ , ∆ , is a constant term, and is an error term. The estimated coefficient on the ∆ ln 1 , term is interpreted as the tax elasticity in 2004 for developed countries. The coefficient of the first interaction term
∆ ln 1 , , namely , measures the difference between tax elasticity in 2004 for developed countries and that for developing countries in the same year. Further, the
coefficient of the ln 1 ,, term ∆ provides an estimate of the difference between tax elasticity for developed countries in 1999 and 2004. Thus, the tax elasticity by country and by
(13)
23 year may be summarized as follows:
Tax elasticity for developed countries in 2004:
Tax elasticity for developed countries in 1999: ∆ Tax elasticity for developing countries in 2004:
Tax elasticity for developing countries in 1999: ∆ ∆
2. Results
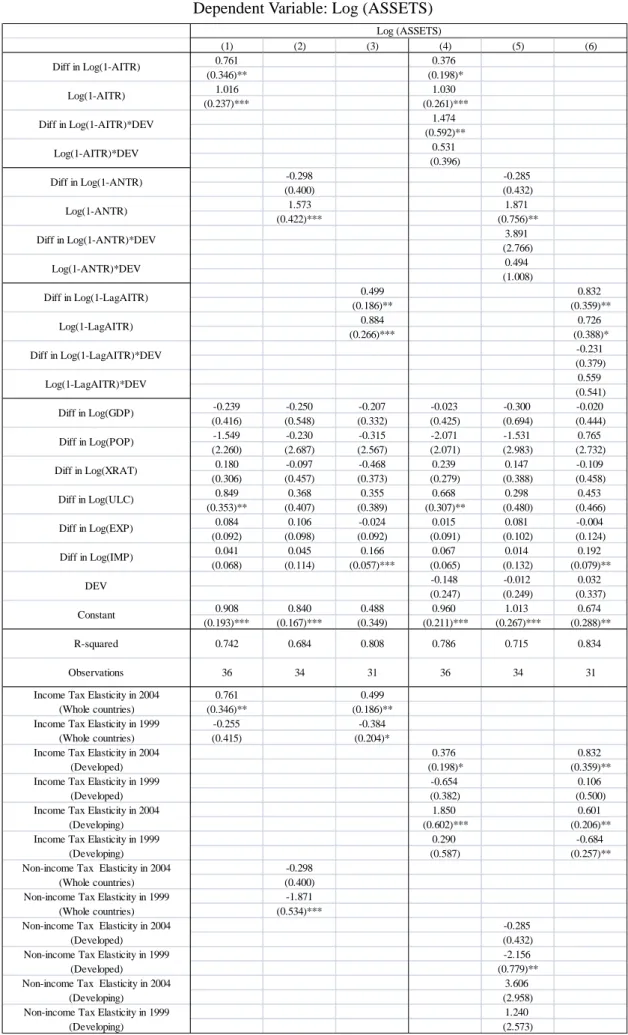
Empirical results for the first difference regressions in all industries are presented in
Tables 4A and 4B. Columns (1) to (3) of Table 4A show results for regressions of log assets
without interaction terms. Coefficients of the differences between tax elasticity in 1999 and
2004 are positive (0.88 to 1.57) and significantly different from zero at the one percent
confidence level. This indicates that foreign assets of U.S. multinationals became more
responsive to tax differences between countries from 1999 to 2004. It also implies that total
foreign assets became more sensitive to non-income tax differentials rather than income tax
differentials across countries from 1999 to 2004. This change may be driven by the active
attitude that governments take toward using tax incentives to attract FDI inflow. In particular,
for American firms, the effect of tax incentives on foreign asset investment turned out to be
stronger for non-income taxes than for income taxes. Tax differentials across countries also
became more important determinants of foreign investment by U.S. multinationals in the
context of increasing international mobility of capital.
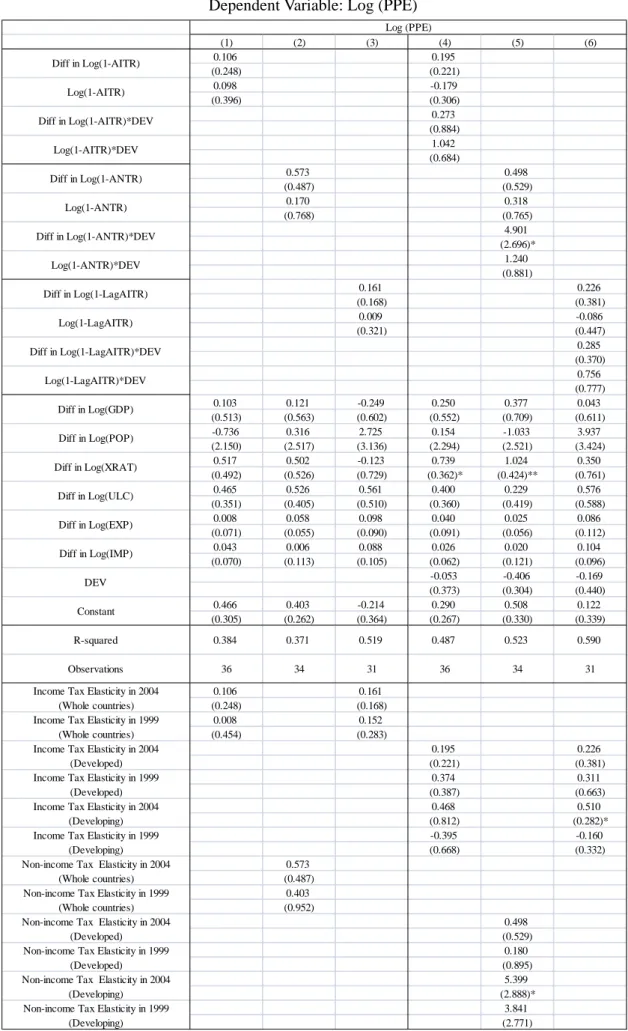
However, the specifications of log net PPE in all industries (columns [1] to [3] of Table
24
elasticity in 1999 and 2004. It is unclear from this result whether foreign PPE investment by
U.S. multinationals became more or less sensitive to tax differentials across countries from
1999 to 2004.
Columns (4) to (6) of Table 4A show the results for regressions of log assets in all
industries with interaction terms. The coefficients of the differences between tax elasticity for
developed countries in 1999 and 2004 are positive (0.73 to 1.87) and statistically significant at
the standard level of confidence. This suggests that foreign assets held by U.S. multinational
firms became more sensitive to tax differentials in developed countries from 1999 to 2004.
Note that total foreign assets became more responsive to non-income tax differentials than
income tax differences in developed countries during that time period. It also appears that
foreign assets of U.S. multinationals became more sensitive to income tax differences in
developing countries from 1999 to 2004 but unclear to non-income tax differentials in
developing economies. Developing countries may put more effort in expanding income tax
incentives rather than non-income taxation to attract inward FDI while governments in
developed countries make use of both types of tax incentives.
Columns (4) to (6) of Table 4B indicate a lack of statistical significance in coefficients of
differences between tax elasticities for both countries in 1999 and 2004. Thus, it is uncertain
whether foreign net PPE of U.S. multinationals became more or less responsive to tax
differences in developed and developing countries from 1999 to 2004.
First difference regressions of the log of FDI inflow in manufacturing and wholesale
trade industries on the after-tax rate of returns were also experimented even though results are
not reported in the table. The first difference estimators in both industries may not have enough
25
which was caused by attrition mainly in export and import data. Dropping the export and
import terms from the first difference model in both industries had little impact on the
statistical significance of the tax effects on total foreign assets and net foreign PPE,
particularly the coefficients of the differences between tax elasticities.
VI. Discussion
Estimation results reported in the previous section show with statistical significance that
the after-income-tax rate of returns is positively associated with total foreign assets of U.S.
multinational firms in all industries including manufacturing and wholesale trade industries.
This implies a negative relationship between local corporate income tax rates and FDI
measured by total assets; high rates of income taxation reduce foreign asset demands by
decreasing the return to foreign investment, and conversely, low income tax rates make a
country an attractive location for FDI.
Foreign assets of U.S. multinationals in all industries have become more responsive to
tax differentials across countries from 1999 to 2004. This implies that tax differences between
countries became more important determinants of foreign assets investment by U.S.
multinationals. In particular, non-income tax differences became more sensitive to foreign
assets in all industries rather than income tax differentials across countries. This evidence is
partly consistent with Desai, Foley, and Hines (2004) who suggest that the effect of multiple
host country taxes on foreign investment should be stronger for indirect (non-income) taxes
than for income taxes due to the ineligibility of American firms to claim foreign tax credits for
indirect tax payments. However, the association between foreign net PPE and tax differentials
26
Empirical results also show the difference in tax sensitivity of foreign investment
between developed and developing countries. Total assets of foreign affiliates in all industries
(also wholesale trade industry in part) are more responsive to differences in both income and
non-income taxation in developed countries than in developing countries. Likewise, the
responsiveness of net foreign PPE in all industries to non-income tax differentials (but not
income tax differences) is also higher in developed countries than in developing countries.
This may be happening because the impact of tax incentives (reduction in corporate tax rates)
on FDI inflow is stronger in developed countries than in developing economies.
Even though both types of foreign investment are associated with higher tax sensitivity
in developed countries than in developing countries, it appears that the difference in tax
responsiveness of FDI stems from the different tendencies of tax sensitivity between income
and non-income taxation. The first difference regressions indicate that foreign assets became
more responsive to income tax differentials both in developed and developing countries from
1999 to 2004. From the results for the pooled regressions, it appears that the degree of income
tax elasticity growth is larger in developing countries while the degree of tax sensitivity is
higher in developed countries. Pooled regressions also suggest that the location of foreign
investment by U.S. multinationals has become more sensitive to non-income tax differences in
developed countries while less responsive to non-income tax differentials in developing
countries (non-income tax elasticities for developing countries show statistically significant
negative signs).
What kind of factors can account for this difference in income and non-income tax
sensitivity of FDI in developed and developing countries? One possible explanation may be
27
Developing countries rely heavily on indirect taxes (about 40 percent of their total tax revenue)
and derive about 25 percent of their tax revenue from income taxes (more corporate income
tax than personal income tax), about 20 percent from trade taxes, and about 15 percent from
social security and payroll (Tanzi and Zee, 2000). For developed countries, income taxes
(more personal income tax than corporate income tax is raised) are more important, and
indirect taxes are less significant (each about one-third of their total tax revenue). Social
security and payroll are also more important contributions to their tax revenue (rather less than
one-third) than trade taxes and property taxes (Tanzi and Zee, 2000). Heavier dependence on
indirect non-income taxes in developing economies is consistent with findings reported here
that the location of foreign investment by U.S. multinationals is less responsive to non-income
tax differences in developing countries. It could be perceived as a disincentive for allocation of
real capital by American firms.
There have been some general changes in the composition of tax revenue in developing
countries since the 1990s. Developing countries as a whole have been significantly shifting
away from trade taxes in the process of trade liberalization and have been undergoing
reduction in revenue from the corporate income tax as a result of international tax competition
that has been intensified by increased ease of capital movements (Keen and Simone, 2004). In
particular, the decline of corporate income tax revenue has been reflected in a steady reduction
in statutory rates of corporate income tax in developing economies (as well as developed
countries).(14) Another striking feature with developing countries is that their revenue from
general sales taxes (value-added taxation in practice) among indirect taxes has remarkably
(14)
The contrast with developed countries is especially noteworthy in that they have actually experienced an increase in corporate tax revenue both relative to GDP and as a share of total tax revenue since the reduction in statutory tax rates has been offset to some extent by expansion of the tax base (Keen and Simone, 2004).
28 increased since the 1990s (Keen and Simone, 2004).
Thus, foreign asset investment by U.S. multinational corporations has become more
responsive to income tax differentials in both developed and developing countries partly due to
the fact that average statutory rates of corporate income tax have steadily fallen across the
world since the 1990s. The higher degree of tax sensitivity in developed countries may be
explained by the lower downward trend in corporate income tax rates in developed countries.
It could also be related to the fact that much of capital mobility and trade still occurs between
developed countries. The evidence that FDI by U.S. multinationals is less responsive in
developing countries and more sensitive in developed countries relative to non-income tax
differentials may be interpreted through the remarkable spread of indirect taxes (above all,
value-added tax) to the developing world. Heavy dependence on indirect taxes is likely to raise
additional costs of local sales of firms and consequently discourage their economic activities in
developing countries.
VII. Conclusion
This paper concerned measurement of the extent to which host-country taxation (income
and non-income taxes) affects the location of foreign investment (total assets and net PPE)
undertaken by U.S. multinational firms. In particular, it has focused on examining: (1) how
responsive FDI locations are to tax differentials across countries, (2) how different tax effects
on FDI inflow are between developed and developing countries, and (3) whether investment
location decisions have become more or less sensitive to tax differences between countries
over time ranging from the late 1990s to the early 2000s.
29
annual surveys (1999 to 2008) and periodic benchmark surveys (1999 and 2004). Controlling
for country specific nontax characteristics and unobservable country fixed effects in first
difference form, empirical estimates suggest that high rates of corporate income taxation are
associated with reduced foreign assets of U.S. multinational firms in all industries by
decreasing the return to foreign asset investment. Foreign assets of U.S. multinationals in all
industries have also become more responsive to non-income tax differentials across countries
rather than income tax differences from 1999 to 2004. Further, estimation results indicate that
foreign investment by American firms is associated with higher tax sensitivity in developed
countries than in developing countries. This evidence may be rooted in the different tendencies
of tax responsiveness between income and non-income taxation and the difference of taxation
structures between developed and developing countries.
Further research is required to study the mechanisms or channels through which
host-country taxation is likely to affect or operate on FDI inflow. While this paper as well as
most prior research has revealed a negative association between tax rates and FDI flow, the
evidence is still open to multiple interpretations. For example, Desai, Foley, and Hines (2004)
propose three pathways through which high tax rates may reduce foreign investment: (1) by
reducing the scale of local business activity, (2) by reducing the capital intensity of given level
of business activity, and (3) by encouraging the relocation of assets to facilitate profit
reallocation. Country-specific or industry-specific attributes may also have the explanatory
power to understand these mechanisms. Investigating the mechanisms of the causal effect of
30
Figure 1. Inward FDI Flow by Country Development
31
Figure 2. Outward FDI Flow by Country Development
32
Table 1A. Results for Pooled Regressions (All Industries) Dependent Variable: Log (ASSETS)
Notes: All regressions have been estimated using ordinary least squares (OLS), and all specifications include regional dummies. White-corrected standard errors are reported in parentheses with ***, **, and * denoting statistical significance at the 1, 5, and 10 percent level respectively. AITR is the average income tax rate, and ANTR is the average non-income tax rate. DEV is a dummy variable which equals 1 for developing countries and 0 for developed countries. GDP is gross domestic product. POP is population. XRAT is the exchange rate. ULC is unit labor costs. EXP is exports, and IMP is imports.
(1) (2) (3) (4) (5) (6) (7) (8) 0.825 1.243 (0.199)*** (0.356)*** -1.081 (0.462)** 0.056 0.501 (0.408) (0.578) -1.056 (0.631)* 0.993 1.773 (0.142)*** (0.270)*** -1.667 (0.377)*** 0.156 0.825 (0.322) (0.419)** -1.712 (0.576)*** 0.244 0.136 0.241 0.171 0.289 0.148 0.365 0.190 (0.096)** (0.096) (0.100)** (0.095)* (0.107)*** (0.101) (0.105)*** (0.101)* -0.124 -0.062 -0.101 -0.102 -0.145 -0.070 -0.183 -0.119 (0.086) (0.091) (0.086) (0.090) (0.088) (0.091) (0.084)** (0.089) -0.032 -0.065 -0.028 -0.068 -0.039 -0.071 -0.033 -0.073 (0.020) (0.021)*** (0.020) (0.022)*** (0.019)** (0.021)*** (0.018)* (0.021)*** 0.770 0.803 0.820 0.741 0.534 0.668 0.494 0.551 (0.112)*** (0.112)*** (0.117)*** (0.113)*** (0.120)*** (0.131)*** (0.123)*** (0.129)*** 0.443 0.494 0.422 0.528 0.460 0.501 0.424 0.539 (0.044)*** (0.047)*** (0.046)*** (0.047)*** (0.049)*** (0.052)*** (0.054)*** (0.053)*** 0.029 0.020 0.026 -0.011 0.009 0.010 0.008 -0.021 (0.031) (0.041) (0.032) (0.038) (0.030) (0.040) (0.030) (0.034) -1.374 -0.869 -1.551 -1.103 (0.263)*** (0.361)** (0.251)*** (0.350)*** 3.067 2.884 2.739 3.570 5.557 4.895 5.538 5.857 (0.915)*** (1.045)*** (0.923)*** (1.031)** (1.081)*** (1.524)*** (1.130)*** (1.511)*** 0.825 0.993 (0.199)*** (0.142)*** 1.243 1.773 (0.356)*** (0.270)*** 0.162 0.106 (0.264) (0.239) 0.056 0.156 (0.408) (0.322) 0.501 0.825 (0.578) (0.419)** -0.555 -0.887 (0.433) (0.482)*
Income Tax Elasticity (Developing) Non-income Tax Elasticity
(Whole countries) Non-income Tax Elasticity
(Developed) Non-income Tax Elasticity
(Developing) Income Tax Elasticity
(Whole countries) Income Tax Elasticity
(Developed) 423 379 Observations 427 396 423 379 427 396 0.827 0.817 0.832 0.816 R-squared 0.803 0.808 0.802 0.801 Constant Log(1-LagAITR) Log(1-LagAITR)*DEV Log(1-LagANTR) Log(1-LagANTR)*DEV Log(GDP) Log(POP) Log(XRAT) Log(ULC) Log(EXP) Log(IMP) DEV Log (ASSETS) Log(1-AITR) Log(1-AITR)*DEV Log(1-ANTR) Log(1-ANTR)*DEV
33
Table 1B. Results for Pooled Regressions (All Industries) Dependent Variable: Log (PPE)
Notes: All regressions have been estimated using ordinary least squares (OLS), and all specifications include regional dummies. White-corrected standard errors are reported in parentheses with ***, **, and * denoting statistical significance at the 1, 5, and 10 percent level respectively. AITR is the average income tax rate, and ANTR is the average non-income tax rate. DEV is a dummy variable which equals 1 for developing countries and 0 for developed countries. GDP is gross domestic product. POP is population. XRAT is the exchange rate. ULC is unit labor costs. EXP is exports, and IMP is imports.
(1) (2) (3) (4) (5) (6) (7) (8) -0.353 -0.418 (0.183)* (0.219)* 0.244 (0.379) 0.194 0.911 (0.253) (0.249)*** -2.084 (0.499)*** -0.244 -0.330 (0.187) (0.274) 0.217 (0.382) 0.205 1.106 (0.265) (0.262)*** -2.615 (0.535)*** 0.322 0.156 0.334 0.179 0.238 0.181 0.257 0.214 (0.106)*** (0.102) (0.107)*** (0.103)* (0.113)** (0.108)* (0.116)** (0.109)* 0.033 0.191 0.036 0.162 0.119 0.159 0.114 0.121 (0.089) (0.089)** (0.090) (0.090)* (0.092) (0.094)* (0.093) (0.094) -0.007 -0.032 -0.005 -0.035 -0.013 -0.038 -0.011 -0.040 (0.019) (0.019) (0.019) (0.021)* (0.020) (0.020)* (0.020) (0.021)* 0.204 0.311 0.229 0.276 0.151 0.160 0.167 0.072 (0.122)* (0.126)** (0.128)* (0.126)** (0.130) (0.141) (0.135) (0.139) 0.218 0.258 0.202 0.262 0.238 0.264 0.221 0.273 (0.041)*** (0.040)*** (0.040)*** (0.043)*** (0.042)*** (0.040)*** (0.041)*** (0.041)*** 0.146 0.131 0.152 0.125 0.137 0.121 0.142 0.115 (0.032)*** (0.038)*** (0.033)*** (0.037)*** (0.036)*** (0.038)*** (0.037)*** (0.036)*** -0.730 -0.901 -0.715 -1.114 (0.260)*** (0.257)*** (0.267)*** (0.247)*** 3.845 3.712 4.307 5.182 5.632 5.867 5.325 6.741 (0.902)*** (0.942)*** (0.902)*** (0.906)*** (1.038)*** (1.207)*** (1.099)*** (1.213)*** -0.353 -0.244 (0.183)* (0.187) -0.418 -0.330 (0.219)* (0.274) -0.174 -0.112 (0.304) (0.253) 0.194 0.205 (0.253) (0.265) 0.911 1.106 (0.249)*** (0.262)*** -1.172 -1.509 (0.444)*** (0.488)*** 0.799 396 0.767 423 0.792 379 0.770 427
Non-income Tax Elasticity (Developing)
R-squared Observations
Income Tax Elasticity (Developed) Income Tax Elasticity
(Developing)
Non-income Tax Elasticity (Developed) Income Tax Elasticity
(Whole countries) Log(1-LagAITR)*DEV Log(1-LagANTR) Log(1-LagANTR)*DEV Constant Log(XRAT) Log(ULC) Log(EXP) Log(IMP) DEV Log(POP)
Non-income Tax Elasticity (Whole countries) Log (PPE) 0.754 427 396 0.783 423 0.752 379 0.767 Log(1-AITR) Log(1-AITR)*DEV Log(1-ANTR) Log(1-ANTR)*DEV Log(GDP) Log(1-LagAITR)
34
Table 2. Results for Pooled Regressions (Manufacturing)
Notes: All regressions have been estimated using ordinary least squares (OLS), and all specifications include regional dummies. White-corrected standard errors are reported in parentheses with ***, **, and * denoting statistical significance at the 1, 5, and 10 percent level respectively. AITR is the average income tax rate, and ANTR is the average non-income tax rate. DEV is a dummy variable which equals 1 for developing countries and 0 for developed countries. GDP is gross domestic product. POP is population. XRAT is the exchange rate. ULC is unit labor costs. EXP is exports, and IMP is imports.
(1) (2) (3) (4) (5) (6) (7) (8) 0.434 0.429 0.055 -0.008 (0.183)** (0.333) (0.147) (0.236) -0.030 0.070 (0.378) (0.290) 0.547 0.371 0.103 -0.057 (0.193)*** (0.314) (0.172) (0.235) 0.345 0.281 (0.368) (0.334) 0.266 0.287 0.274 0.271 0.025 0.051 0.029 0.043 (0.068)*** (0.068)*** (0.070)*** (0.070)*** (0.106) (0.106) (0.108) (0.110) 0.090 0.085 0.086 0.101 0.339 0.331 0.337 0.340 (0.046)** (0.050)* (0.047)* (0.050)** (0.082)*** (0.081)*** (0.084)*** (0.085)*** -0.039 -0.036 -0.037 -0.038 0.006 0.009 0.007 0.008 (0.011)*** (0.011)*** (0.011)*** (0.011)*** (0.015) (0.015) (0.015) (0.015) 0.187 0.187 0.200 0.214 0.173 0.185 0.189 0.215 (0.080)** (0.087)** (0.084)** (0.088)** (0.135) (0.139) (0.138) (0.146) 0.390 0.378 0.384 0.375 0.405 0.390 0.400 0.384 (0.036)*** (0.037)*** (0.034)*** (0.034)*** (0.046)*** (0.048)*** (0.044)*** (0.045)*** 0.154 0.159 0.158 0.161 0.182 0.190 0.185 0.195 (0.032)*** (0.032)*** (0.029)*** (0.029)*** (0.041)*** (0.042)*** (0.037)*** (0.039)*** 0.113 0.145 0.138 0.191 (0.252) (0.249) (0.260) (0.269) 1.713 2.149 2.221 2.012 1.078 1.759 2.179 1.489 (0.548)*** (0.645)*** (0.704)*** (0.685)*** (0.715) (0.788)** (0.917)** (0.964) 0.434 0.547 0.055 0.103 (0.183)** (0.193)*** (0.147) (0.172) 0.429 0.371 -0.008 -0.057 (0.333) (0.314) (0.236) (0.235) 0.399 0.716 0.062 0.223 (0.205)* (0.216)*** (0.188) (0.257) Log (ASSETS) 0.935 303 304 0.935 0.935 303 0.935 304 304 0.901 Log (PPE) 303 0.902 303 0.902 304 0.901
Income Tax Elasticity (Developing) Log(EXP) Log(IMP) DEV Constant R-squared Observations Income Tax Elasticity
(Whole countries) Log(POP) Log(XRAT)
Log(ULC) Log(1-AITR)
Income Tax Elasticity (Developed) Log(1-AITR)*DEV
Log(1-LagAITR) Log(1-LagAITR)*DEV
35
Table 3. Results for Pooled Regressions (Wholesale Trade)
Notes: All regressions have been estimated using ordinary least squares (OLS), and all specifications include regional dummies. White-corrected standard errors are reported in parentheses with ***, **, and * denoting statistical significance at the 1, 5, and 10 percent level respectively. AITR is the average income tax rate, and ANTR is the average non-income tax rate. DEV is a dummy variable which equals 1 for developing countries and 0 for developed countries. GDP is gross domestic product. POP is population. XRAT is the exchange rate. ULC is unit labor costs. EXP is exports, and IMP is imports.
(1) (2) (3) (4) (5) (6) (7) (8) 0.240 0.417 -0.062 -0.058 (0.114)** (0.155)*** (0.118) (0.126) -0.455 0.015 (0.247)* (0.259) 0.204 0.593 -0.030 0.056 (0.147) (0.246)** (0.174) (0.202) -0.680 -0.099 (0.312)** (0.296) 0.608 0.583 0.266 0.249 0.155 0.122 -0.047 -0.095 (0.189)*** (0.204)*** (0.133)** (0.134)* (0.130) (0.136) (0.139) (0.144) -0.405 -0.389 -0.148 -0.124 0.196 0.222 0.349 0.391 (0.173)** (0.185)** (0.104) (0.106) (0.096)** (0.099)** (0.102)*** (0.106)*** -0.110 -0.115 -0.125 -0.130 -0.044 -0.047 -0.049 -0.054 (0.023)*** (0.023)*** (0.021)*** (0.021)*** (0.021)** (0.022)** (0.019)** (0.020)*** -0.288 -0.204 -0.198 -0.102 0.400 0.460 0.444 0.523 (0.283) (0.289) (0.210) (0.211) (0.239)* (0.244)* (0.233)* (0.239)** 0.277 0.291 0.267 0.268 0.243 0.252 0.242 0.245 (0.041)*** (0.045)*** (0.034)*** (0.038)*** (0.050)*** (0.052)*** (0.049)*** (0.051)*** 0.194 0.179 0.252 0.239 0.107 0.094 0.140 0.128 (0.025)*** (0.029)*** (0.022)*** (0.026)*** (0.032)*** (0.035)*** (0.030)*** (0.033)*** -1.511 -1.600 -0.804 -0.854 (0.314)*** (0.325)*** (0.177)*** (0.172)*** 6.912 6.336 9.977 9.191 1.677 1.986 3.471 3.810 (1.405)*** (1.313)*** (1.440)*** (1.330)*** (1.253) (1.248) (1.140)*** (1.162)*** 0.240 0.204 -0.062 -0.030 (0.114)** (0.147) (0.118) (0.174) 0.417 0.593 -0.058 0.056 (0.155)*** (0.246)** (0.126) (0.202) -0.038 -0.087 -0.043 -0.044 (0.190) (0.197) (0.236) (0.243) Log(1-LagAITR)*DEV
Log (ASSETS) Log (PPE)
Log(1-AITR) Log(1-AITR)*DEV Log(1-LagAITR) Log(GDP) Log(POP) Log(XRAT) Log(ULC) Log(EXP) Log(IMP) DEV Constant R-squared 0.890 0.881 0.845 0.840 Observations 192 186 192 186 0.922 0.916 0.831 0.825
Income Tax Elasticity (Whole countries) Income Tax Elasticity
(Developed) Income Tax Elasticity
(Developing)