A Flowchart Approach to Malaysia's Automobile
Industry Cluster Policy
著者
Kuchiki Akifumi
権利
Copyrights 日本貿易振興機構(ジェトロ)アジア
経済研究所 / Institute of Developing
Economies, Japan External Trade Organization
(IDE-JETRO) http://www.ide.go.jp
journal or
publication title
IDE Discussion Paper
volume
120
year
2007-09-01
INSTITUTE OF DEVELOPING ECONOMIES
IDE Discussion Papers are preliminary materials circulated to stimulate discussions and critical comments
Keywords: Malaysia, automobile industry cluster, policy prescriptions, actors, deregulation
JEL classification: G18, O18, R11
* Executive Vice President, Japan External Trade Organization (JETRO) E-mail: [email protected]
IDE DISCUSSION PAPER No. 120
A Flowchart Approach to Malaysia’s
Automobile Industry Cluster Policy
Akifumi KUCHIKI*
September 2007
Abstract
In this paper, we apply a flowchart approach to investigate Malaysia’s automobile cluster policy. We investigate whether the industrial cluster policy has been successful or not, suggest policy prescriptions, and propose a way to prioritize policy measures. Our flowchart approach leads to the following three policy prescriptions: (1) Malaysian firms should establish sites for exporting compact cars with automatic transmissions; (2) actors in the public, semi-public and private sector should work to upgrade skilled labor; and (3) the central government should promote liberalization and deregulation to attract foreign firms into the supporting industries.
The Institute of Developing Economies (IDE) is a semigovernmental, nonpartisan, nonprofit research institute, founded in 1958. The Institute merged with the Japan External Trade Organization (JETRO) on July 1, 1998. The Institute conducts basic and comprehensive studies on economic and related affairs in all developing countries and regions, including Asia, the Middle East, Africa, Latin America, Oceania, and Eastern Europe.
The views expressed in this publication are those of the author(s). Publication does not imply endorsement by the Institute of Developing Economies of any of the views expressed within.
INSTITUTE OF DEVELOPING ECONOMIES (IDE), JETRO 3-2-2, WAKABA,MIHAMA-KU,CHIBA-SHI
CHIBA 261-8545, JAPAN
1
1. Introduction
Industrial cluster policies have been put into practice in many countries around the world, including in Asia. Thailand continues to grow as the “Detroit of Asia” and Malaysia plans to establish automobile clusters by implementing an industrial cluster policy. However, Malaysia’s policy has not been as successful as that of Thailand. This offers an opportunity to discuss whether industrial cluster policy is effective or not. No practical method for prescribing industrial cluster policy based on a flowchart approach has yet been established.
Komiya, Okuno and Suzumura (1988) define industrial policy as a policy under which the central government intervenes in dynamic inefficiency or market failures and fosters industries by protecting infant industries. Local governments play a crucial role in the success or failure of cluster policy, since it is not a national growth strategy but a regional one. The role of local governments is increasing relative to that of central governments, as the worldwide trend toward decentralization is bringing a shift from industrial policy to industrial cluster policy.
Porter (1998) constructed a diamond model, finding that four factors — (1) demand conditions, (2) factor conditions, (3) firm strategy, structure and rivalry, and (4) related and supporting industries — offer sufficient conditions for innovation in industrial clusters. However, it is not easy to satisfy the four conditions at the same time. The aim of our flowchart model is to attempt to prioritize the four factors in order, not on a diamond plane but in a line. Markusen (1996) classified industrial districts as the three types: Marshallian ID, Hub-and-spoke and Satellite platform. In the case of the Hub-and-spoke type, he found a relationship between anchor firms and their related firms. However, Markusen (1996) neither provided conditions for the formation of industrial clusters nor ordered the factors of the conditions. Kuchiki (2005b) proposed a practical flowchart model of industrial cluster policy by ordering and prioritizing policy measures in a line.
The purpose of this paper is to offer prescriptions for Malaysia’s automobile industry cluster policy, using a flowchart approach. The purpose of our flowchart approach is to diagnose whether the industrial cluster policy will succeed or not. We will apply it to Malaysia’s automobile cluster policy, with the aim to make prescriptions. We prioritize the policy measures of Malaysia’s industrial cluster policy. The flowchart approach involves setting a target, ordering the policy measures, and finding actors to implement the policy measures.
As step 1, using questionnaires provided by the Japan Bank for International Cooperation and Japan External Trade Organization, we determine which factors along
2
the flowchart process constitute the problems of industrial cluster policy. As step 2, we determine policy measures and actors for solving the problems, based on interviews with professionals on the automobile industry of Malaysia. For step 3, we offer prescriptions for the industrial cluster policy by specifying the policy measures and actors along the flowchart.
Our flowchart approach leads to the following three conclusions. First, the projected increase in future demand in the local markets in Malaysia will not be sufficient to start the flowchart process. Second, the shortage of skilled labor is a crucial problem for further industrial agglomeration in Malaysia. Third, one of the factors hindering foreign investors from investing in Malaysia is the institutional regulations. The second and third conclusions tell us that developing an automobile cluster in Malaysia will require building the capacity of both skilled human resources and institutions such as laws and regulations.
This paper is organized as follows. Section 2 describes our flowchart model. Section 3 explains Malaysia’s automobile industry cluster policy. Section 4 is an application of the flowchart approach to the automobile industry cluster policy of Malaysia. Section 5 offers prescriptions for the automobile industry cluster policy. Section 6 concludes the paper.
2. Patterns of the flowchart models
This section proposes a flowchart approach for promoting agglomeration and innovation among firms in the hi-technology and automobile industries. We propose some sufficient conditions for allowing industrial cluster policy to lead firms to agglomerate as step I, and innovate as step II.
(1) A prototype flowchart model for cluster policy
We cannot strictly prove our hypothesis that a flowchart approach will be useful using the inductive method or deductive method. Our aim is to propose sufficient conditions for the success of an industrial cluster policy. That is, we hope to provide a flowchart that can lead to the successful formation of an industrial cluster if the sufficient conditions listed in the flowchart are satisfied.
It should be noted that we can provide illustrations of cases where our hypothesis of a flowchart approach holds. We can show a large number of cases, but cannot prove our hypothesis as a sufficient condition using inductive and deductive methods. Our flowchart cannot show that other orderings of factors different from that of our flowchart will not work. We can show, by increasing the number of the cases, that our
3
flowchart may be generally applied to industrial cluster policy in other regions.
Our hypothesis is a practical one, since we can form a cluster if we follow the following four steps. First, we determine the ingredients of A, B, C, D and E. Second, we select the minimum number of factors from the ingredients found above needed to form a flowchart (see Figure 2). Third, we order them along the flowchart (see Figure 3). Fourth, we specify actors to proceed at each step of the flowchart if the step goes to not “Yes” but “No” (see Figure 4).
Our flowchart of the automobile industry cluster policy follows the following process. First, a local government establishes an industrial zone to act as a receptacle for foreign investors. Second, the government builds capacity for improving business and living conditions for foreign investors. The elements of capacity building include: (1) constructing physical infrastructure, (2) building institutions, (3) developing human resources, and (4) creating living conditions amenable to foreign investors. Physical infrastructure refers to roads, ports, communications, and so on. Institutional building, which is also crucial to success in inviting foreign investors, includes streamlining investment procedures through one-stop services, deregulation, and the introduction of preferential tax systems. Human resources, which are usually an initial condition for foreign investors, include unskilled labor, skilled labor, managers, researchers, and professionals. The living environment, for example, includes the provision of hospitals and international schools in order to attract foreign firms. An anchor firm will be ready to invest after the capacity building mentioned above has been carried out.
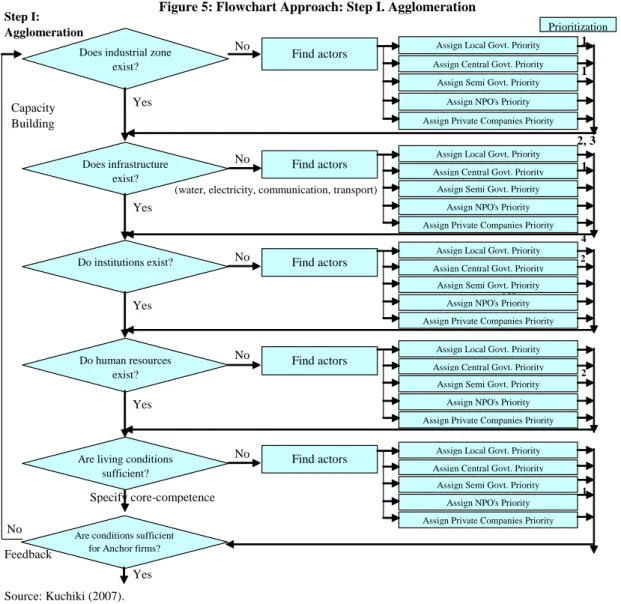
Our flowchart approach is illustrated in Figure 5. First, we ask whether industrial zones have been established. If these have not, we must decide which actors should establish such zones. Once these actors are identified, we return to the main stream of the flowchart.
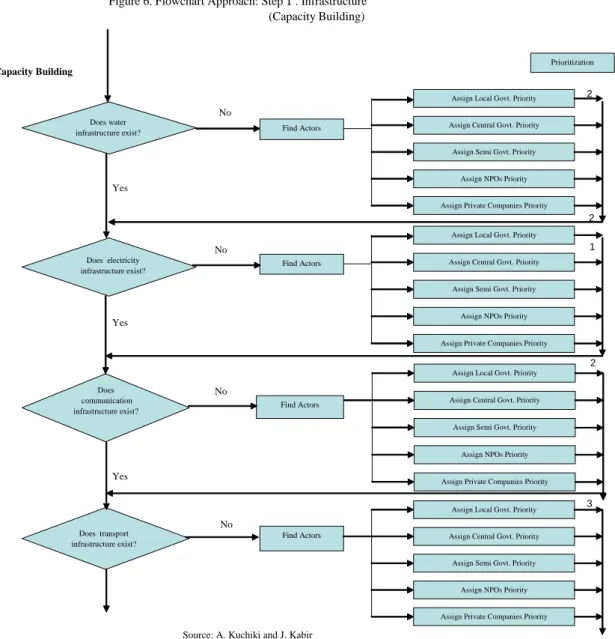
Next we apply the flowchart’s second step, capacity building, which takes place after the establishment of industrial zones. We examine whether there is an adequate water supply for the industrial zones (see Figure 6). We proceed along the flowchart to examine power supply, communication, and transportation.
After looking at the physical infrastructure, we examine whether institutions are in place. The central government must institutionalize national tax systems and the local government must institutionalize local tax systems. It is well known that one-stop investment procedures are crucial for success in attracting foreign investors.
In the area of human resource development, an abundance of unskilled labor with a high literacy rate is a necessary condition for luring foreign investors whose purpose is to employ cheap labor. On the other hand, an industrial cluster sometimes faces a
4
shortage of skilled labor after industrialization has gone forward; universities and on-the-job training centers for innovation are then needed for further development.
Living conditions are crucial for attracting foreign investors. Researchers from investor companies have incentives to work hard if they can enjoy their lives. It is necessary to create satisfactory conditions in areas such as housing, schools, hospitals, and so on. These are the final conditions that must be satisfied to bring in anchor firms.
Figure 7 shows the priorities of each actor. Local governments play the main role in establishing industrial zones, supplying electricity, facilitating transport, and forming institutions. The first priority of local government in Figure 6 is to construct industrial zones to accept foreign investors. The second priority during that stage is to supply electricity, facilitate transportation and form institutions. The main priorities of the central government are to supply electricity and build institutions.
The typical industrial cluster policy was theorized by defining an industrial zone as “quasi-public goods,” and it was shown that the policy enhances economic growth under a production function of “increasing returns to scale” of an anchor company. The critical amounts of the production of “scale economies” that are used by the related companies to decide whether or not to invest in clusters were also shown (Kuchiki (2005a)).
(2) Demand conditions
It should be noted that our flowchart approach does not explicitly discuss the demand side in the manufacturing industry, since we suppose that the demand conditions are satisfied as follows:
Case 1:
(i) An anchor firm locates in an exportprocessing zone and exports its products. In this case, there is little constraint on its demand, since its factory can attain its minimal optimal level of production by exporting products to the world. In this case, the logistics of the anchor firm are crucial to attaining the minimal optimal level.
(ii) Therefore, suppliers to the anchor firm can attain their minimal optimal levels of production. The demand for the suppliers is “demand derived from the anchor firm.”
Case 2:
(i) The anchor firm sells its products locally. In this case, the market size in the place where the anchor firm is located should be large enough for the anchor firm to attain the minimal optimal level of production. The anchor firm decides to invest
5
in a place once it judges the local demand satisfies this condition. (ii) The suppliers’ condition is the same as that in Case 1.
(3) Patterns of flowchart models
This section presents patterns for flowchart models in the information technology industry, biotechnology industry and automobile industry. The flowchart model for the IT industry is almost as the same as that of the biotechnology industry. Knowledge-intensive industries include the IT industry, biotechnology industry and nanotechnology industry. The flowchart model for knowledge industries is different from that of the automobile industry. Knowledge industries require, as a precondition, the existence of universities. Local governments play an important role in implementing the cluster policy. The success in the cluster policy in Austin, Texas in the United States is based on the leadership of the governor of Texas. The partnership between the state government and municipal government has been instrumental in the success of the cluster policy.
One large difference between the flowcharts of the automobile industry and the knowledge industry is that anchor firms play an important role in implementing the automobile industry cluster policy, while superstars play an important role in implementing the knowledge industry cluster policy. The reason is as follows. While the knowledge industry requires partnership between intellectuals, a car assembler as an anchor firm is a necessity in the automobile industry cluster policy, considering that a car is composed of more than twenty thousand individual components. Superstars are needed for the knowledge industry cluster policy since knowledge is embodied in human resources. Preferential treatment is required in order to lure superstars. Partnerships between universities, large firms, startup firms, multinational firms, and laboratories are required for innovations in digital technology. Superstars were crucial for achieving success in creating the partnership and industrial agglomeration in Austin. The leadership of heads of local governments and worldwide superstars in the knowledge industry are the keys to the success of cluster policy.
Science parks and capacity building are necessary for a knowledge industry cluster policy. The following three points must be taken into consideration when implementing a knowledge industry cluster policy. First, the regulations should not be terribly strict. Second, mechanisms should be in place to link patents and innovations. Third, patentees and innovators need to be matched. Matching funds are effective for this.
6
econometric method giving priority to policy measures. They find support for the prioritization of the flowchart approach except for the fact that infrastructure was not found to be a significant factor.
3. Malaysia’s industrial policy and industrial cluster policy
(1) History of Proton
Malaysia’s national car project was carried out as an industrial policy. In 1981, the Malaysian government proposed a joint venture with Mitsubishi, a Japanese automaker, to build a Malaysian car. The cabinet approved the National Car Project in 1982, and Heavy Industries Corporation of Malaysia (HICOM) signed an agreement with Mitsubishi. Proton, a national car company, was established on May 7, 1983. Its factory was established in the HICOM compound. Its first car, named Proton Saga, was launched in 1985, and in 1986 began to be exported to Bangladesh. Production reached 50,000 cars in 1987, and 500,000 cars in 1993. The Proton R&D facility opened in 1993, and in 1996 the Proton was being exported to 31 countries. The national car project is a so-called industrial policy, or selective government intervention policy to nurture national firms. The policy succeeded in allowing Proton to export its products.
However, Proton cancelled its agreement with Mitsubishi in 2002. Proton’s share of sales in the Malaysian market reached about 90% at the highest but fell to 24% in 2005. In 2006, Proton reduced its car prices in Malaysia along with several other car manufacturers as part of a move by the government to lower car prices. Thus, in 2007, Proton found itself facing the difficulty of management without an alliance with a foreign firm.
In 1996, Proton City was established as a base for agglomeration by its related suppliers. The Malaysian government established barriers to investments by foreign firms in order to protect national cars, including Proton. The policy may have had some negative effects on the attraction of foreign investors into Malaysia or on promoting the agglomeration of foreign firms.
(2) History of Perodua
Perodua, a national project, means “second national car” in Malay language. Japanese firms also contributed to the capitalization of Perodua in the following ratios. The Malaysian government and Japanese firms invested 73% and 27%, respectively, of the total capital, when POBS of Perodua was establishment in November 2001. The
7
POBS invested 100% of the capital in both PSSB (Perodua’s marketing company) and its vehicle manufacturing company. The capital structure changed in December 2001, with the Japanese firm acquiring 51% of capital in the vehicle manufacturing company (or PMSB/PEMSB). The shares of the Malaysian government and the Japanese in POBS remained at 73% and 27%, but POBS and the Japanese company now owned 49% and 51% of the capital of PCSB, respectively. POBS still owned 100% of the capital of PSSB, the marketing company. POBS and PCSB owned 49% and 51% of the capital of the vehicle manufacturing company. In summary, the Japanese company owned 47.04% of the total capital of the marketing company and the vehicle manufacturing company, but 51% of the total capital of Perodua.
The production processes consist of mainly pressing, painting and assembling. There are 32 Japanese staff members working in important positions in these production processes (November 2006).
Production of Perodua cars grew steadily to 102 thousand in 2004, recorded 116 thousand in 2005 and was expected to be 134 thousand in 2006. The production of Protons was 141 thousand in 2004 and 139 thousand in 2005, but fell to 102 thousand in 2006. The market share of Perodua grew from 25% in 2004 to 30% in 2006, while that of Proton, which was more than 80% at one point, gradually reduced to about 20% in 2006.
The local contents ratio of Kancil and Myvi, both produced by Perodua is about 80%, while that of Perodua’s Rusa and Kembara models are about 50%. There are 145 domestic suppliers. There are 59 local suppliers, with a share of 40%. The 19 Japanese suppliers have a share of 13.1%. Once a process of industrial agglomeration as illustrated in step 1 is completed, the feedback process illustrated in our flowchart in Figure 1 can be used to examine whether further industrial agglomeration is possible.
(3) The Third Industrial Master Plan (IMP3: MTI (Ministry of Trade and Industry) (2006)) of Malaysia
As explained in MTI (2006), the Third Industrial Master Plan of Malaysia will provide an overall development framework for the manufacturing sector and detailed sub-sector plans for the 2006-2020 period. Automotive clusters are to be established in Tanjung Malim (Perak), Gurun (Kedah) and Pekan (Pahang), where producers and suppliers of parts and components, and distribution networks have been established. Other areas with some clustering features include Bertam (Pulau Pinang), Serendah (Selangor) and Pego (Melaka).
8
(4) Ninth Malaysia Plan 2006-2010
(i) Chapter 4 of Prime Minister’s Department (2006) identifies anchor companies for automoile clusters as Perusahaan Otomobile Nasional Berhad (PROTON), Petroliam Nasional Berhad (PETRONAS), Tenaga Nasional Berhad (TNB), and a number of MNCs. It lists more than 200 first-tier vendor companies involved in manufacturing and related activities.
(ii) While the contribution of MNCs to the electric and electronics industry will remain significant, local investments as well as technological capabilities in existing and new electric and electronics activities will be further enhanced. These will leverage developments within the cybercities of Bayan Lepas, Pulau Pinang and Kulim Hi-Tech Park in Kedah (Prime Minister’s Department (2006), p. 120).
(iii) During the Plan period, shared services and outsourcing (SSO) will be positioned as a major new source of growth. In order to further strengthen the SSO cluster, assistance such as access to funds for joint ventures as well as mergers and acquisitions will be made available (Prime Minister’s Department (2006), p.121).
(5) Transportation costs between countries in ASEAN:
Perodua’s production system is planned from the perspective of its supply chain management in Asia. Toyota divides its production systems between China and ASEAN in consideration of the logistics under the current situation of Asia’s regional integration. In other words, it has two systems of supply chain management, one for ASEAN and the other for China. The decrease in the tariff rates of ASEAN under the AFTA (ASEAN Free Trade Agreement) affected Malaysia’s management of firms in ASEAN. Daihatsu’s plants in Indonesia and Thailand now supply parts and components to the Daihatsu plant in Malaysia. In particular, the Indonesian plant supplies parts and components to other countries in ASEAN, partly because the plant in Indonesia is large enough to export them.
Decisions on whether the plant in Malaysia imports parts and components from other countries are made based on the costs of transportation and the size of the domestic demand in Malaysia. For example, it is costly to package painted car bodies in order to import cars from Thailand to Malaysia. The outward appearance of cars is an important factor in selling them, since consumers’ choices are made partly depending on the perfection of the outward painted appearance. The painted bodies have to be transported from Thailand to Malaysia without being scratched. Trucks can efficiently carry bodies to realize the just-in-time lean production system, but Perodua cannot use trucks since road conditions from Thailand to Malaysia are not good enough to allow
9
the bodies to be transported without scratch. Ships, however, can transport the painted-bodies without scratch. Using ships can lower the average costs by guaranteeing that a minimum number of bodies can be carried.
(6) Demand conditions in Malaysia:
Next, we will explain the situation of suppliers in Malaysia. One of the factors that determines whether foreign suppliers decide to move to Malaysia is the demand from their anchor firm, or the size of its production. The total demand for cars in Malaysia recovered following the Asian Currency Crisis in 1997 and increased to 550 thousand per year in 2005. This large increase in automobile sales was not anticipated since the population of Malaysia was about 25 million in 2005. One staff member of an automobile company in Malaysia forecasts that car sales will increase by about 100 thousand in the next ten years. It is difficult for suppliers in Malaysia to realize a minimum average cost based on the minimum level of production. This is why Japanese suppliers have hesitated to move into Malaysia. The demand conditions for attaining the minimum size level is a pre-condition for starting our flowchart process in Figure 1. We conclude that the automobile industry in Malaysia today, with a production level of 500 thousand in its domestic market, does not satisfy the minimum demand condition.
Furthermore, there are two more reasons why Japanese suppliers find it difficult to move into Malaysia. They are (i) the labor shortage and (ii) instability in institutions such as tax systems.
(i) The Malaysian government has worked, since the early 1990s, to develop the human resources necessary to nurture suppliers in the automobile industry. The Japanese government has cooperated with these human resource development projects. Malaysia is unfavorable to China in the human resource development since Chinese firms acquire Japan’s technologies by themselves. It is said that in the past, Japanese and Korean firms went through the same process of acquiring technology by imitating foreigntechnology that Chinese firms are now experiencing. But Malaysian firms have in many failed to go through this process. Foreign firms in Malaysia, including Japanese firms, complain about the shortage of skilled labor. Human resource development, or capacity building on our flowchart, is needed before the next step forward can be made in the cluster policy.
The ratio of automation by robots in Perodua’s production process highlights the shortage of skilled labor. The ratio, which in Japan is 99% is 9% in Malaysia, according to our interview with a staff member of Perodua in October 2006. He told us
10
that few local workers are skilled in maintaining robots, though Perodua provides components such as cylinders to Proton. The reporter told us at that time that human resource development was needed.
(ii) Malaysia’s tax system was at times favorable to foreign firms, but it was changed into an unfavorable one when the Malaysian government started to protect domestic firms. The tax system has changed over time, and is too unstable to allow foreign firms to forecast profits. It is said that the current instability of the tax system is not acceptable, though such instability is seen in many developing countries including the value added tax system of China, the import tariff rates of Vietnam and the tax system that gave preferences to pioneer foreign firms in the 1990s in Malaysia. We can use the case of the tariff system reform in Malaysia in 2006 as an illustration. Under the reform, tariff rates on automobile components were suddenly raised, without notice, in 2006. Given the unstable institutions, firms cannot calculate the rate of return on their investment in Malaysia and find it difficult to decide to invest in Malaysia. In the long run, the Malaysian government needs to stabilize the tax system.
4. Applying the Flowchart Approach to Malaysia’s Automobile Industry Cluster Policy
This section illustrates how Malaysia’s industrial cluster policy, illustrated in a flowchart process in Figure 1, faced difficulty in proceeding to further steps due to the shortages of demand and skilled labor, and the lack of development of supporting industries.
Here, we summarize the results of our application of a flowchart approach to Malaysia’s automobile industry cluster policy. Malaysia does not satisfy the demand conditions that are a precondition of the flowchart approach. Malaysia’s domestic demand is not promising since the population is small, numbering around 25 million people. The export demand is also not promising, since it will be difficult for Malaysia to become an exporter due to the underdevelopment of its supporting industries.
Figure 1 gives a step-by-step picture of the flowchart approach. On (a) industrial zones, there are many industrial zones including Proton city. On (b) capacity building, the infrastructure of Malaysia is better than that of Thailand. On institutional aspects, the transparency of Malaysia’s investment laws is slightly inferior to that of Thailand. On human resources, Malaysia has less unskilled labor than Thailand, but has more skilled labor and managers. On living conditions, Malaysia has few problems at all. There are a sufficient number of anchor firms such as Toyota, Mitsubishi, Honda, and Ford operating in Malaysia. However, the supporting industries are greatly inferior to
11
those of Thailand.
There are two ways for Malaysia to resolve the above situation. One is to increase the demand, which is a precondition of the flowchart approach, by exporting more products. This means that anchor firms should establish export sites to increase products. But this will be difficult, since Malaysia does not have an abundance of cheap labor. Another solution is to go to step II, innovation process, from step I, agglomeration process, in Figure 1. A precondition for this solution is the existence of universities. However, Malaysia does not have many universities. It does, however, have the opportunity to create a new industry by combining the electric and electronics industry with the automobile industry.
(1) Comparison between Malaysia and Thailand of the process of industrial cluster policy
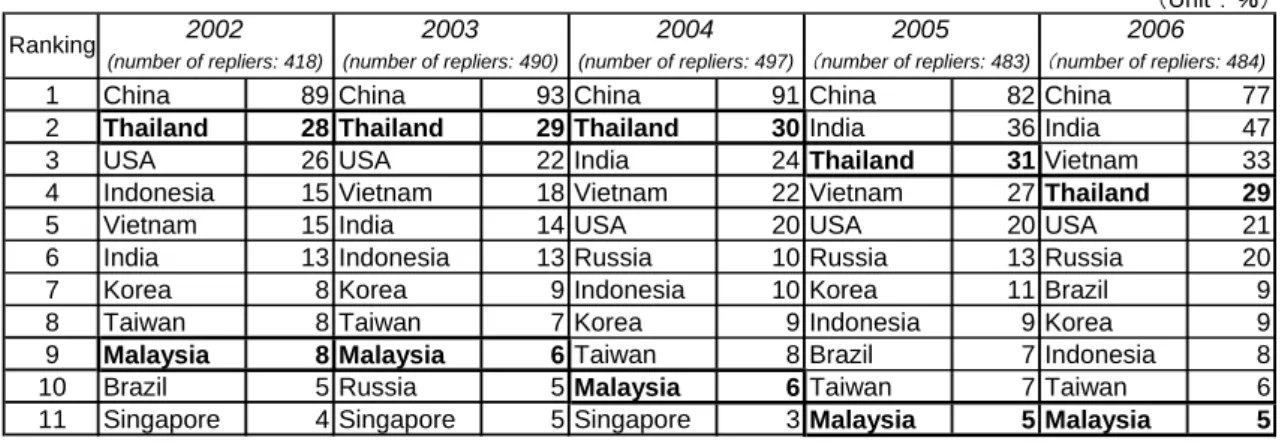
Japan Bank for International Cooperation (JBIC (2006)) surveyed 597 firms, as shown in Table 1. General machines, electric and electronics, transport machines, automobiles, and precision machinery make up 60.8% of the manufacturing industry, compared to 15.3% for the automobile industry. The table shows changes in countries and regions seen as the most promising place to do business in the three-year medium term. The ratio of votes obtained by Thailand to the total was 28% in 2002, 29% in 2006 and nearly the same figure from 2002 to 2006. The ratio of votes obtained by Vietnam to the total increased from 15% in 2002 to 33% in 2006. Indonesia’s share decreased from 15% in 2002 to 8% in 2006. Similarly, that of Malaysia decreased from 8% in 2002 to 5% in 2006. This section explains why Malaysia’s ratio decreased, and why Thailand’s did not. Figure 8 shows that the numbers of firms planning to strengthen and enlarge their branches in the automobile industries of Thailand, Indonesia, Vietnam, and Malaysia are 55, 24, 15, and 10, respectively. Malaysia has the smallest number among them.
Japan External Trade Organization (JETRO (2006)) surveyed 966 firms. Of these firms, 44.2% were in general machines, electronic and electronics appliances, electric and electronics parts, transport equipment, and transport equipment, whereas 17.2% were in transport equipment and parts. Of these firms, 937 answered a question on what they saw as suitable production sites in the medium and long run. The numbers of respondents citing Thailand, Vietnam, India, China, and Malaysia were 237, 199, 110, 100, and 79, respectively.
From these surveys by JBIC and JETRO, we may conclude that Japanese firms are expected to invest in Thailand, Vietnam, or India, rather than Malaysia. This section
12
elucidates the differences between Malaysia and Thailand in terms of the factors for agglomeration and clustering.
Table 3, which illustrates the domestic sales figures of automobiles in the main ASEAN countries, shows that those of Malaysia, Indonesia and Thailand are almost the same at 487 thousand, 483 thousand, and 626 thousand, respectively. Table 4, which gives the automobile production figures of the main ASEAN countries, shows that the production in Malaysia in 2004 was 480 thousand while that of Thailand was twice as large, with 920 thousand. Table 5 shows the difference between the production figures and the domestic sales figures. For Thailand, this figure was 460 thousand in 2005, since firms had sites for exporting products.
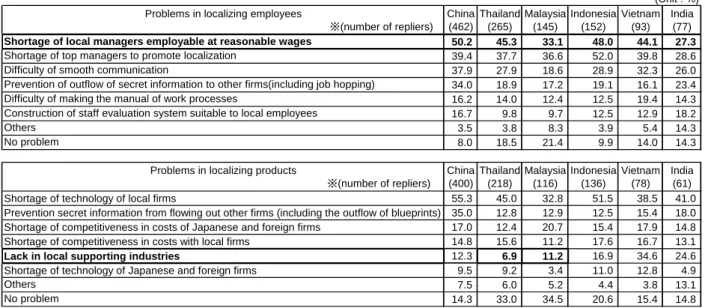
Table 6 clarifies the problems in terms of the localization of employees, products and technology. Problems in localizing employees include a shortage of local managers employable at reasonable wages and top managers to promote localization. Both Malaysia and Thailand have a similar shortage of local managers and top managers, and the shortage in Thailand is more serious than that of Malaysia. Problems in localizing products faced by all the countries shown in Table 6 are a shortage of technology at local firms. Problems in localizing technology faced by all countries shown in Table 6 include a shortage of local skilled labor at reasonable wages. In sum, the common problems faced by all of the countries are a shortage of local managers, top managers and local skilled labor. The problems of Thailand seem more serious than those of Malaysia. Thus, the shortage of human resources alone is not sufficient to explain the difference of export capacity between the two countries.
Table 7 shows reasons for why certain countries and regions are seen as promising. All ten countries and regions shown in Table 7 give high priority to promising local markets. A large local market is a pre-condition for decisions by multinational corporations on locations. It is expected that in the future, the markets of Vietnam and Indonesia will become larger than that of Thailand. All ten countries and regions shown in Table 7 give a high priority to the existence of abundant labor.
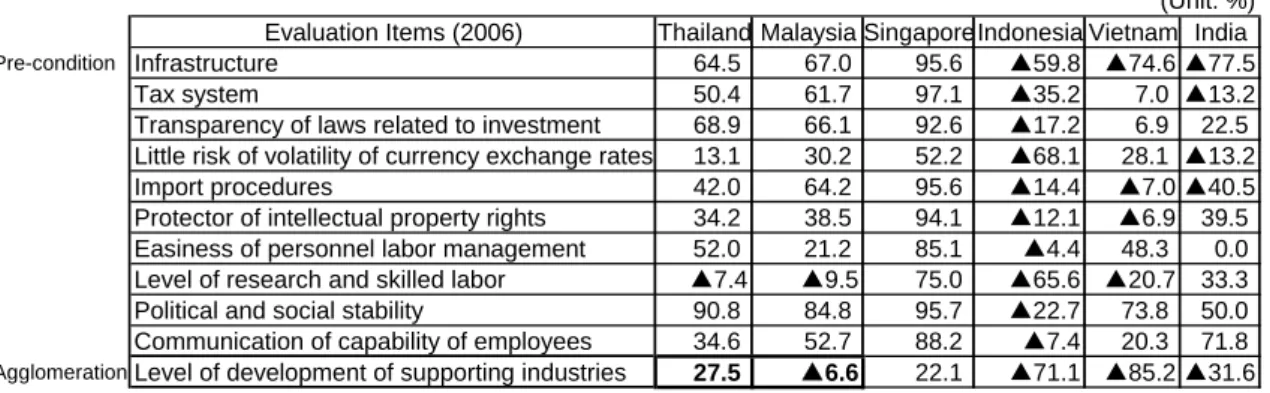
Table 8 shows an evaluation index of the investment environment of ASEAN and India in comparison with China. The index is calculated as follows:
A = (Number of firms who replied “superior”)-(Number of firms who replied “inferior”),
B = (Number of firms who replied “superior”) + (Number of firms who replied “inferior”), and
Evaluation Index=(A/B)×100.
13
development of supporting industries of Malaysia (-6.6) is much worse than that of Thailand (+27.5). Table 6 also shows that, on the problems in localizing products, the lack of local supporting industries of Thailand is 6.9% while that of Malaysia is 11.2%.
We examined the problems of Malaysia’s automobile industry cluster using the questionnaires data from JBIC and JRTRO, and reached the following three conclusions. First, Malaysia has a shortage of domestic demand for cars. Second, it has a shortage of unskilled labor. Third, its supporting industries are underdeveloped compared with those of Thailand. Considering these problems, we raise the following six questions: Is the size of Malaysia’s automobile market large enough? Can Malaysia host export sites? Will foreign automobile firms invest in Malaysia under the present regulations? Will foreign automobile firms invest in Malaysia despite the shortage of unskilled labor? Can Malaysia catch up Thailand in its supporting industries? Are the controls over foreign capital inflow of suppliers to the national cars sufficiently deregulated?
5. Prescriptions for Malaysia’s automobile industry
We carried out a survey of Malaysia’s automobile industry cluster policy to determine whether we can solve its problems using our flowchart approach. We interviewed ten professionals on the automobile industry, and found the following six results, as summarized in Table 9. (The ten respondents included one staff member of a national car project, two professors at the University of Malaya, one staff member of a national car supplier, two instructors for small and medium enterprises, three staff members of Japanese semi-government organizations, and one Japanese government officer in Malaysia).
(1) On the size of Malaysia’s domestic car market, Malaysians cannot be expected to buy more cars since the size of the population is small at about 25 million in 2007, per capita income is more than US$5,000, and each family owns one car on average. The total domestic demand for automobiles might not increase from the current level of approximately 500 thousand per year. Only two of the ten respondents stated that the demand was not small.
(2) On the question of whether Malaysia can host export sites, six of the ten answered “Yes.” A division of labor between Thailand, Indonesia and Malaysia is needed for Malaysia to become a host to export sites. Thailand and Indonesia specialized in pick-up trucks and multi-purpose vehicles, respectively. Malaysia can specialize in
14
compact cars with automatic transmissions. Automatic cars are not very popular in Asia in 2007. However, Malaysia must compete with India, which is expected to increase its production of compact cars, and China, which has excess production capacity for compact cars.
(3) On the question of whether foreign auto firms will invest in Malaysia under the present regulations protecting the national cars such as Proton and Perodua, three of the ten answered “Yes.” Most of the respondents judged that deregulation and liberalization would be required to attract foreign investors. Malaysia should try to promote the influx of foreign direct investment through deregulation.
(4) On the question of whether foreign auto firms will invest in Malaysia despite the shortage of unskilled labor, eight of the ten answered “Yes.” Malaysia has introduced unskilled labor from foreign countries for the last twenty years. The foreign countries were mainly Indonesia and Bangladesh in the 1990s, and Vietnam, Myanmar and Nepal in 2007. Taiwan is similar to Malaysia in introducing unskilled labor from foreign countries. One of the respondents answered that the social cost had increased since the share of foreigners in the total population exceeded 20% in 2007. It is expected that Malaysia will adopt a policy of refraining from introducing more foreign labor.
(5) On the question of whether Malaysia can catch up with Thailand in the supporting industries, three of the ten answered “Yes.” Thailand has actively introduced foreign direct investment while Malaysia has tried to protect and foster its domestic firms. For this reason, there is a large difference in the development of the supporting industries between the two countries. However, the development of Thailand’s supporting industries has relied on foreign capital, while Malaysia has tried to foster domestic firms in the supporting industries. Malaysia is slowly nurturing local suppliers step by step.
(6) On the question of whether the controls over inflows of foreign capital into suppliers of the national cars are sufficiently deregulated, three of the ten answered “Yes.” Some respondents stated that generally speaking, suppliers of parts, who provide their products to Proton and Perodua, cannot meet world quality standards. Some local suppliers related to the national cars provide their products to Japanese anchor firms in Malaysia. They may be competing with other suppliers in the world.
15
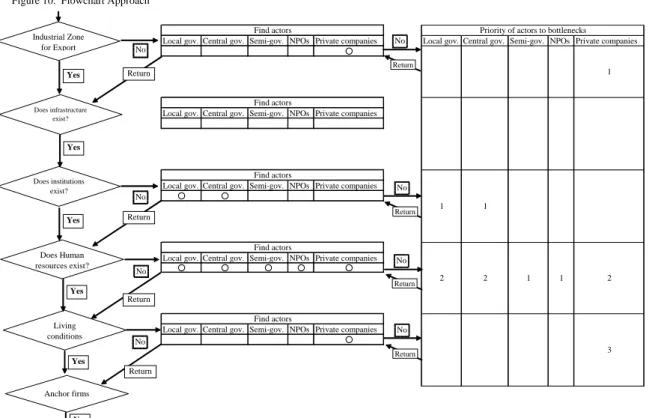
Table 9 shows the answers to the questions, and Figure 9 shows the prescription for Malaysia’s automobile industry cluster policy. The prescriptions are as follows: organizations in the quasi-public sector and private firms must act as actors to further develop skilled labor; the central government must further deregulate laws on the national car policy to introduce foreign direct investment; and Malaysia must aim to host sites for exporting compact cars (See Figure 10).
6. Summary and Conclusions
In this paper we applied a flowchart approach to Malaysia’s automobile industry cluster policy, with the aim to elucidate problems in the industrial cluster policy, conduct interviews and questionnaires on the problems, and offer prescriptions for the problems by specifying the actors to solve them.
In step 1, we found the following three facts regarding Malaysia.First, Malaysia has shortages in both domestic demand and foreign demand, which are preconditions of the flowchart approach. The projected future outlook of demand in local markets in Malaysia does not satisfy the pre-conditions for starting the flowchart process. Second, Malaysia has a shortage of unskilled labor for attracting foreign investors. The shortage of skilled labor is a crucial problem in view of the creation of further industrial agglomeration in Malaysia. Malaysia has introduced foreign workers into the palm oil industry and the construction industry, from Indonesia, Bangladesh and other countries. It has become difficult to continue the policy, however, due to the threat to social stability. Third, Malaysia has a lack of developed supporting industries in comparison with Thailand since one of the factors that hinders foreign investors from investing in Malaysia is its institutional instability.
In step 2, we came up with the following six questions: Is the size of the automobile market of Malaysia sufficiently large? Can Malaysia be a host for export sites? Will foreign automobile firms invest in Malaysia under the present regulations? Will foreign automobile firms invest in Malaysia despite the shortage of unskilled labor? Can Malaysia catch up with Thailand in the supporting industries? Are the controls over foreign capital inflows into suppliers to the national cars sufficiently deregulated? On these questions, we interviewed professionals on the problems of Malaysia’s automobile industry.
In step 3, our flowchart approach lead the following three policy measure prescriptions: Firms in Malaysia should establish sites for exporting automatic compact cars; actors or economic agents in the public, semi-public and private sectors should endeavor to upgrade skilled labor; the central government should liberalize and
16
deregulate its laws to attract foreign firms in the supporting industries. The prescriptions for the automobile industry cluster policy are as follows: Firms in Malaysia should aim to become sites for exporting automatic compact cars while firms in Indonesia and Thailand are engaged in exporting pick-up trucks and multi-purpose vehicles, respectively; organizations in the quasi-public sector and private firms as actors should further upgrade skilled labor rather than nurture unskilled labor; the central government must further liberalize and deregulate laws on the national car policy to attract foreign direct investment into the supporting industries in Malaysia.
References
Japan Bank for International Cooperation. 2006. Survey Report on Overseas Business
Operations by Japanese Manufacturing Companies, Tokyo.
Japan External Trade Organization. 2006. Current Management of Japanese
Manufacturing Industries in Asia, Tokyo.
Komiya, R., Okuno, M. and Suzumura K. (eds.) (1988) Industrial Policy of Japan, London, Academic Press Inc.
Kuchiki, A. 2005a. “Theory of a Flowchart Approach to Industrial Cluster Policy,” IDE-JETRO, Discussion Paper, No.36.
Kuchiki, A. 2005b. “A Flowchart Approach to Asia’s Industrial Cluster Policy.” In
Industrial Clusters in Asia, eds. Kuchiki, A and M. Tsuji. London: Macmillan.
Malaysia Trade and Industry. 2006. Third Industrial Master Plan 2006-2020, Kuala Lumpur.
Markusen, A. 1996. “Sticky Places in Slippery Space: A Typology of Industrial Districts,” Economic Geography, 72: 293-313.
Prime Minister’s Department, 2006. Ninth Malaysia Plan 2006-2010, Putra Jaya. Tsuji, M., Y. Ueki, S. Miyahara, S. Komolavanij. 2006. “An Empirical Examination of
Factors Promoting Industrial Clustering in Greater Bangkok, Thailand,” 10th
International Convention of the East Asian Economic Association 18-19
November 2006, Beijing
Porter, M.E. 1998. The Competitive Advantage of Nations. New York: The Free Press. World Bank. 1998. World Development Report, World Bank.
17
Step Ⅰ: (a) Agglomeration (b) (c) (d) Step Ⅱ: (a) Innovation (b) (c) (d)Source: A. Kuchiki and Y. Yoshida
Related firms Anchor persons Cluster 3. Human resources 4. Living conditions 1. Infrastructure 2. Institutions
Capacity building (II)
Universities / Research institutes Figure 1. Flowchart Approach to Industrial Cluster Policy
Industrial zone
Capacity building (I)
3. Human resources 4. Living conditions
Anchor firm 1. Infrastructure 2. Institutions
18
1. Find factors.2. Select some factors from all factors. ⇒Figure 2, Figure 3
3. Apply the flowchart approach to a region and find actors if the answer at a step of the flowchart is 'No'.
⇒Figure 4 Figure 2 Figure 4 Example Cluster Local government Cluster Figure 3 Anchor firm Capacity building Industrial zone Cluster C A E E C A E A
,
B,
C,
D,
Yes
No
Actor
19
Figure 5: Flowchart Approach: Step I. Agglomeration
yes (water, electricity, communication, transport)
Does industrial zone exist?
Find actors
Yes
No
Assign Private Companies Priority Assign Local Govt. Priority Assign Central Govt. Priority
Assign Semi Govt. Priority Assign NPO's Priority
Does infrastructure exist?
Find actors
Yes
No
Assign Private Companies Priority Assign Local Govt. Priority Assign Central Govt. Priority
Assign Semi Govt. Priority Assign NPO's Priority
Do institutions exist? Find actors
Yes No Do human resources exist? Find actors Yes No
Are living conditions sufficient? Find actors No Capacity Building Specify core-competence
Are conditions sufficient for Anchor firms?
Yes No
Feedback
Assign Private Companies Priority Assign Local Govt. Priority Assign Central Govt. Priority
Assign Semi Govt. Priority Assign NPO's Priority
1
1 1
2, 3 1
Assign Private Companies Priority Assign Local Govt. Priority Assign Central Govt. Priority
Assign Semi Govt. Priority Assign NPO's Priority
4 2
Assign Private Companies Priority Assign Local Govt. Priority Assign Central Govt. Priority
Assign Semi Govt. Priority Assign NPO's Priority
2
Prioritization
Step I: Agglomeration
20
Figure 6. Flowchart Approach: StepⅠ. Infrastructure (Capacity Building) Capacity Building Prioritization Does water infrastructure exist? No Yes
Assign Local Govt. Priority
Assign Central Govt. Priority
Assign Semi Govt. Priority
Assign NPOs Priority
Assign Private Companies Priority
Assign Local Govt. Priority
Assign Central Govt. Priority
Assign Semi Govt. Priority
Assign NPOs Priority
Assign Private Companies Priority
Find Actors
Find Actors
Find Actors
Find Actors
Assign Local Govt. Priority
Assign Central Govt. Priority
Assign Semi Govt. Priority
Assign NPOs Priority
Assign Private Companies Priority
No No No Yes Yes Does electricity infrastructure exist? 1 2 2 Does communication infrastructure exist? Does transport infrastructure exist? 3
Assign Local Govt. Priority
Assign Central Govt. Priority
Assign Semi Govt. Priority
Assign NPOs Priority
Assign Private Companies Priority
2
21
Figure 7. Priorities of actors
Local government
Priority 1 = industrial zone
Priority 2 = water, electricity & communication Priority 3 = transport Priority 4 = institutions Central government Priority 1 = electricity Priority 2 = institutions Semi government
Priority 1 = industrial zone Priority 2 = human resources
NPOs
Priority 1 = living conditions
22
<The automobile industry>
Korea Taiwan Singapore Hong Kong Thailand Indonesia Malaysia Philippines China India Vietnam
number of replies 9 2 3 3 55 24 10 5 76 29 15
Source: 2006 JBIC Institute
Figure 8. Number of firms to strengthen and enlarge their branches
9 2 3 3 55 24 10 5 76 29 15 0 10 20 30 40 50 60 70 80 Kor ea Taiw an Sing apor e Hong Ko ng Tha iland Indo nes ia Mal aysi a Philip pine s Chi na India Viet nam no. of repl ies
Figure 9. Prescription on the automobile industry clustering in Malaysia Stage I. Agglomeration Domestic demand:
Actors Capacity building:
deregulation of Central government National car policy
Human resource
development: skilled labor Private firms Quasi-gov. Agglomeration of
suppliers I Feedback process Export demand:
Compact automatic Private firms
cars Capacity building Anchor firms Agglomeration of suppliers II Source: Author. 500,000 ① ② ③
23
Figure 10. Flowchart Approach
Local gov. Central gov. Semi-gov. NPOs Private companies Local gov. Central gov. Semi-gov. NPOs Private companies ○
Local gov. Central gov. Semi-gov. NPOs Private companies
Local gov. Central gov. Semi-gov. NPOs Private companies
○ ○
Local gov. Central gov. Semi-gov. NPOs Private companies
○ ○ ○ ○ ○
Local gov. Central gov. Semi-gov. NPOs Private companies ○ Source: A.Kuchiki 3 Find actors Find actors Find actors Find actors 1 Find actors
Priority of actors to bottlenecks
1 1 2 2 2 1 1 Industrial Zone for Export Does infrastructure exist? Does institutions exist? Does Human resources exist? Living conditions Anchor firms Yes Yes Yes Yes Yes Yes No No No Return Return Return No Return No Return No Return No Return No Return
24
1 China 89 China 93 China 91 China 82 China 77
2 Thailand 28 Thailand 29 Thailand 30 India 36 India 47
3 USA 26 USA 22 India 24 Thailand 31 Vietnam 33
4 Indonesia 15 Vietnam 18 Vietnam 22 Vietnam 27 Thailand 29
5 Vietnam 15 India 14 USA 20 USA 20 USA 21
6 India 13 Indonesia 13 Russia 10 Russia 13 Russia 20
7 Korea 8 Korea 9 Indonesia 10 Korea 11 Brazil 9
8 Taiwan 8 Taiwan 7 Korea 9 Indonesia 9 Korea 9
9 Malaysia 8 Malaysia 6 Taiwan 8 Brazil 7 Indonesia 8
10 Brazil 5 Russia 5 Malaysia 6 Taiwan 7 Taiwan 6
11 Singapore 4 Singapore 5 Singapore 3 Malaysia 5 Malaysia 5
Source: 2006 JBIC Institute
(number of repliers: 484)
Ranking
(number of repliers: 418) (number of repliers: 490) (number of repliers: 497) (number of repliers: 483)
2002 2003 2004 2005 2006
Table 1. Changes in Countries and Regions for Promising Businesses in the Medium Term (three years)
(Unit : %)
Table 2. Suitable production sites in the medium and long run
Country (ASEAN/India)
no. of effective
replies Thailand Malaysia Singapore Indonesia Philippines Vietnam India China
others (Hong Kong/Taiwan) Thailand 199 124 0 0 4 1 30 20 16 4 Malaysia 169 28 68 0 2 1 30 10 18 12 Singapore 95 16 5 23 8 0 20 5 14 4 Indonesia 149 21 2 2 53 0 21 18 20 12 Philippines 180 30 3 0 3 54 50 10 19 11 Vietnam 84 9 1 0 0 0 48 9 7 10 India 61 9 0 1 3 0 0 38 6 4 Total(note) 937 237 79 26 73 56 199 110 100 57
Note: Total is the summation of the number of firms that select countries and regions as suitable production sites.
Source: Japan External Trade Organization, Management Conditions of Japanese Firms in the Manufacturing Industries in Asia, March 2006.
Countries and regions selected for suitable production sites Countries where firms
are located (Unit:number of firms) 1996 1997 1998 1999 2000 2001 2002 2003 2004 2005 2006 Malaysia 364.8 404.8 163.9 288.4 343.2 396.4 435.0 405.0 487.6 552 490 Thailand 589.1 363.2 144.1 218.3 262.2 297.0 409.4 533.2 626.0 703 680 Indonesia 337.4 386.7 58.3 93.8 301.0 299.6 317.8 354.6 483.1 534 320
Philippines 162.1 144.4 80.2 74.4 83.9 76.7 85.6 92.3 88.1 n.a. n.a.
Vietnam 7.9 5.9 9.7 10.5 12.0 19.6 28.9 43.0 40.1 n.a. n.a.
Source: "Automobile Statistics of Main Countries", "Annual Automobile Statistics of the World"(JAMA), "Monthly Automobile Survey of the World (No.237 May 2005), (No.242 October2005)" (FOURIN)
(Unit:thousand)
25
1996 1997 1998 1999 2000 2001 2002 2003 2004 Malaysia 390.6 449.8 164.1 302.8 359.2 428.7 456.8 424.1 487.6 Thailand 559.4 360.3 158.1 327.2 411.7 459.4 585.0 742.1 928.1 Indonesia 325.5 389.3 58.1 89.0 292.7 279.2 299.3 322.0 n.a. Philippines 136.6 111.0 45.0 65.6 70.9 65.2 74.8 84.2 n.a. Vietnam 6.0 6.3 5.0 6.5 13.4 20.7 26.7 41.1 n.a.Source: "Automobile Statistics of Main Countries", "Annual Automobile Statistics of the World" (JAMA), Thailand Automotive Institute, Malaysia Automotive Association
(Unit: thousand) Table 4. Automobile Production Figures in Main ASEAN Countries (1996-2004)
Table 5. Production, Trade and Domestic Sales
Year 2005 (Unit: 1,000)
Country Production Export Import Domestic Sales
Japan 10,800 5,053 268 5,852 China 5,708 195 162 5,762 Korea 3,699 2,586 32 1,142 ASEAN 2,365 531 1,885 Thailand 1,125 464 703 Malaysia 563 47 551 Indonesia 622 10 534 Philippines 55 10 97 India 1,642 196 n.a. 1,440
Taiwan 446 n.a. n.a. 515
Total 24,660 n.a. n.a. 16,528
26
Table 6. Reasons for Promising Countries and Regions 2006 Survey ※(number of repliers) 1.China (362) 2.India (223) 3. Vietnam (154) 4. Thailand (133) 5. USA (101) 6. Russia (94) 7. Brazil (44) 8. Korea (41) 9. Indonesia (37) 10. Taiwan (26)0 Risk averse to other countries 1.9 10.8 36.4 21.1 1.0 4.3 9.1 2.4 5.4
-0 Sites to export to Japan 15.2 2.2 11.0 12.8 - 1.1 4.5 - 18.9 3.8
0 Sites to export to the third countries 19.3 9.4 18.2 28.6 1.0 - 11.4 7.3 27.0 7.7
0 Present large size of local markets 24.9 11.7 5.2 24.1 70.3 14.9 15.9 41.5 27.0 50.0
0 Growth potential of local markets 82.3 83.0 46.8 42.1 44.6 93.6 81.8 73.2 59.5 69.2
0 Profitability of local markets 7.2 4.0 3.9 10.5 21.8 8.5 13.6 17.1 13.5 11.5
0 Political and social stability 1.4 5.8 15.6 24.8 37.6 3.2 6.8 7.3 2.7 3.8
1 Developed infrastructure 5.8 1.8 3.9 27.8 42.6 4.3 4.5 17.1 8.1 15.4
2 Developed logistics services 3.0 0.4 1.9 6.8 24.8 - - 9.8 8.1 11.5
2 Preferential tax system 13.5 5.4 16.9 24.1 2.0 4.3 4.5 12.2 - 19.2
2 Stable policies 1.4 1.3 8.4 16.5 5.0 1.1 2.3 4.9 2.7 3.8
3 Excellent human resources 16.6 35.0 35.1 17.3 15.8 5.3 6.8 9.8 8.1 11.5
3 Cheap labor 57.2 44.4 71.4 45.9 2.0 17.0 22.7 7.3 54.1 15.4
4 Cheap parts and materials 23.5 9.0 5.8 9.0 4.0 3.2 6.8 2.4 16.2 11.5
4 Supply sites to assemble companies 27.3 21.1 22.7 36.8 18.8 16.0 18.2 12.2 18.9 15.4
4 Industrial agglomeration 16.6 6.3 4.5 30.1 19.8 2.1 4.5 12.2 10.8 11.5
5 Sites for product development 4.4 2.2 1.3 5.3 12.9 - - 2.4 -
-Source: Outlook for Japanese Foreign Direct Investment , 2006 JBIC (Japan Bank for International Cooperation) Institute, May 2007.
(Unit: %)
Table 7. Problems in localization of employees, products and technology Problems in localizing employees
※(number of repliers) China (462) Thailand (265) Malaysia (145) Indonesia (152) Vietnam (93) India (77)
Shortage of local managers employable at reasonable wages 50.2 45.3 33.1 48.0 44.1 27.3
Shortage of top managers to promote localization 39.4 37.7 36.6 52.0 39.8 28.6 Difficulty of smooth communication 37.9 27.9 18.6 28.9 32.3 26.0 Prevention of outflow of secret information to other firms(including job hopping) 34.0 18.9 17.2 19.1 16.1 23.4 Difficulty of making the manual of work processes 16.2 14.0 12.4 12.5 19.4 14.3 Construction of staff evaluation system suitable to local employees 16.7 9.8 9.7 12.5 12.9 18.2
Others 3.5 3.8 8.3 3.9 5.4 14.3
No problem 8.0 18.5 21.4 9.9 14.0 14.3
Problems in localizing products
※(number of repliers) China (400) Thailand (218) Malaysia (116) Indonesia (136) Vietnam (78) India (61) Shortage of technology of local firms 55.3 45.0 32.8 51.5 38.5 41.0 Prevention secret information from flowing out other firms (including the outflow of blueprints) 35.0 12.8 12.9 12.5 15.4 18.0 Shortage of competitiveness in costs of Japanese and foreign firms 17.0 12.4 20.7 15.4 17.9 14.8 Shortage of competitiveness in costs with local firms 14.8 15.6 11.2 17.6 16.7 13.1
Lack in local supporting industries 12.3 6.9 11.2 16.9 34.6 24.6 Shortage of technology of Japanese and foreign firms 9.5 9.2 3.4 11.0 12.8 4.9
Others 7.5 6.0 5.2 4.4 3.8 13.1
No problem 14.3 33.0 34.5 20.6 15.4 14.8
Source: 2006 JBIC Institute (the same source as that of Table 7).
27
Table 8. Evaluation Index of Investment Environment of ASEAN and India in Comparison with China
Evaluation Items (2006) Thailand Malaysia SingaporeIndonesia Vietnam India
Pre-condition Infrastructure 64.5 67.0 95.6 ▲59.8 ▲74.6 ▲77.5
Tax system 50.4 61.7 97.1 ▲35.2 7.0 ▲13.2
Transparency of laws related to investment 68.9 66.1 92.6 ▲17.2 6.9 22.5
Little risk of volatility of currency exchange rates 13.1 30.2 52.2 ▲68.1 28.1 ▲13.2
Import procedures 42.0 64.2 95.6 ▲14.4 ▲7.0 ▲40.5
Protector of intellectual property rights 34.2 38.5 94.1 ▲12.1 ▲6.9 39.5
Easiness of personnel labor management 52.0 21.2 85.1 ▲4.4 48.3 0.0
Level of research and skilled labor ▲7.4 ▲9.5 75.0 ▲65.6 ▲20.7 33.3
Political and social stability 90.8 84.8 95.7 ▲22.7 73.8 50.0
Communication of capability of employees 34.6 52.7 88.2 ▲7.4 20.3 71.8
AgglomerationLevel of development of supporting industries 27.5 ▲6.6 22.1 ▲71.1 ▲85.2 ▲31.6
(Note) A=(Number of firms who replied “superior”)-(Number of firms who replied “inferior”) B=(Number of firms who replied “superior”)+(Number of firms who replied “inferior”) Evaluation Index=(A/B)×100
Source: JETRO, Current Management of Japanese Manufacturing Industries in Asia, March 2006.
(Unit: %)
Table 9. Questionnaire Survey on an Application of Flowchart Approach to Industrial Cluster Policy (May 2007)
1 2 3 4 5 6 7 8 9 10 %
1. Is the size of market of Malyasia large? × × × ○ × × × × × X 10
2. Can Malaysia be export sites? × ○ × ○ ○ × ○ × ○ X 50
3. Can foreign auto firms invest in Malaysia under the present regulations? × ○ × ○ × × ○ × × X 30
4. Can foreign auto firms invest in Malaysia under the shortage of unskilled labor? ○ × ○ ○ ○ ○ ○ ○ ○ X 80
5. Can Malaysia catch up Thailand in the supporting industry? × ○ × × × × ○ × × ○ 30
6. Are the controls over foreign capital inflow of suppliers to the national cars deregulated? × ○ × × × × ○ × ○ X 30 Source: Author.