Introduction
Chicken muscle loses its freshness faster than beef or pork muscle, and its quality is thereby significantly affected.1) To evaluate the quality of chicken, changes in pH, volatile basic nitrogen and live bacterial count are measured as indicators of preservative condition. However, these indices are inadequate for determining the extent of deterioration before the onset of putrefaction. Against such a background, the suitability of K values2), which are used to indicate fish freshness, for determining the freshness of chicken has been evaluated.1),3-6) The results showed that freshness is an important indicator in determining the extent of autolysis, or aging, in chicken. A quick method
of chicken freshness evaluation involving a non-destructive approach is needed to enable quality determination for commercial distribution.
In the area of food freshness evaluation, three papers7–9) have reported on the non-destructive determination of K values to indicate the freshness of fish7, 8) and pork9) using near-infrared (NIR) spectroscopy. One of these studies involved bonito and tuna7), and the others focused on mackerel8) and pork.9) The results indicated the potential for practical evaluation of freshness using K values. In this study, NIR spectroscopy was applied to measure the K values of chicken in real-time determination of freshness. 1 Tsutomu SATO 千里金蘭大学 生活科学部 食物栄養学科 受理日:2015年10月15日 2 Tatsuo WATANABE 静岡県立大学 食品栄養科学部 3 Sachiko KAMO 静岡県立大学 食品栄養科学部 4 Masahiro KOHASHI 静岡県立大学 食品栄養科学部 5 Hiroshi NAKAYAMA 静岡県工業技術研究所 6 Toshihiro SUZUKI 静岡県工業技術研究所 〈研究ノート〉
The trial for evaluation of chicken freshness using near
infrared spectroscopy
Tsutomu Sato
1,Tatsuo Watanabe
2,Sachiko Kamo
3Masahiro Kohashi
4,Hiroshi Nakayama
5,Toshihiro Suzuki
6Summary
The freshness of chicken breast muscle was non-destructively determined using near-infrared (NIR) spectroscopy after comparison of the degradation characteristics for chicken breast muscle and pork Boston butt under storage at 4°C in consideration of changes in K values and nucleic-related compound content. The NIR diffuse reflectance spectra of chicken samples were measured using a spectrophotometer with a fiber optic probe, and multiple linear regression was carried out based on second derivative spectra and K values.
The rate of chicken meat degradation was quite rapid, with decomposition from inosine (HxR) to hypoxanthine (Hx) being observed within seven days of the start of storage. HxR increased steadily in pork, for which a viable calibration equation has been established as previously reported. The best multiple correlation coefficient of 0.83 was obtained from multiple linear regression analysis using K values of less than 50% as an objective variable (composed of wavelengths of 1,156, 835 and 1097 nm). As the ratio of HxR and Hx in K values changed greatly when K values were over 50%, it can be inferred that determination of K values using NIR spectroscopy might be more applicable to chicken breast muscle with K values significantly below 50%.
Materials and Methods
Production of chicken samples
Breast muscles obtained from chickens slaughtered in the morning at Shizuoka Broiler Center were cut into pieces measuring 3 × 3 × 1 cm. The numbers of pieces cut from breast muscles were 40, 43 and 50 (Nos. 1 – 3). They were put into polyethylene bags with a thickness of 0.04 mm and stored in a refrigerator at 4 °C for individual grading over seven consecutive days (Days 0 – 7), thereby creating three stored samples with wide K value distributions. The samples were then used for NIR analysis and subsequent quantitative analysis of ATP-related compounds for determination of K values using high-performance liquid chromatography (HPLC) as outlined below.
Chemicals
Perchloric acid (PCA), phosphoric acid, potassium hydroxide, potassium carbonate anhydrous, sodium dihydrogenorthophosphate, adenosine 5’-triphosphate (ATP), adenosine 5’-diphosphate (ADP), adenosine 5’-monophosphate (AMP), inosine 5’-monophosphate (IMP), inosine (HxR) and hypoxanthine (Hx) were obtained from Wako Pure Chemical Industries, Ltd. (Osaka, Japan).
NIR evaluation of chicken breast muscle
NIR diffuse reflectance spectra were evaluated using a Model 6250 spectrophotometer (NIRECO-NIR Systems, Tokyo, Japan) with a coaxial fiber optic probe (680 – 1,235 nm) fixed and settled vertically toward chicken samples set on the upturned bottom of a piece of white ceramic chinaware.9) The distance between the contact point (lower end) of the probe and the surface of the chinaware was 1 cm. The whole measurement section was covered with a light-shielding cloth during NIR evaluation with 50 scans conducted at 20°C with the fiber optic probe set on 3 – 4 points of the large planes for each chicken sample after a ceramic plate with a thickness of 6.5 mm was evaluated for reference.
Determination of ATP-related compound content using HPLC
After NIR evaluation, ATP-related compound content in each piece of meat was measured as described here. First, two 1.5-gram portions of each sample were homogenized using a Model BM-2 (Nihonseiki Kaisha Ltd., Tokyo, Japan) in test tubes with 4.0 ml of iced 5.0% PCA for 90 seconds each, followed by centrifugation at 3,000 rpm for 5 minutes. Second, 1.0 mL of supernatant from each sample was mixed in a test tube, and the mixture was neutralized to pH 6.8 with 40 µL of 10 M potassium hydroxide and 160 µL of 1.0 M potassium carbonate, followed by centrifugation at 3,000 rpm for 3 minutes. Third, 0.5 mL of the supernatant was mixed with 2.0 mL of distilled water and then passed through a 0.45 µm membrane filter (DISC-13, Toyo Roshi Kaisha, Ltd., Tokyo, Japan) before injection. Finally, a 10 µL portion of test solution was injected into an Asahipak GS320HQ (7.6 × 300 mm, Shodex, Tokyo, Japan) column eluted with 0.2 M of sodium dihydrogenorthophosphate adjusted with 0.2 M phosphoric acid to pH 3.0. The flow rate of the eluate was 0.5 ml/min and the column was at room temperature. The eluate was monitored with UV absorption at 250 nm, and the ATP-related compounds were analyzed by comparing the retention times of HPLC peaks between samples and authentic compounds. The freshness of the muscle was judged from the K value as defined by Equation2) :
K value (%) = (HxR + Hx) / (ATP + ADP + AMP + IMP + HxR + Hx) × 100
Statistical analysis
NIR spectral analysis was conducted using Spectra analysis software version 3.27 (NIRECO-NIR Systems) with the measurement device, and multiple linear regression was carried out based on second derivative spectra and the K values as determined from chemical analysis. The data from the three sets of chicken samples (Nos. 1 – 3) mentioned above were used in the statistical analysis for calibration.
Results and Discussion
K values and IMP, HxR and Hx content in stored chicken samples compared with those of pork The relationships between K values and percentages of IMP, HxR and Hx among all
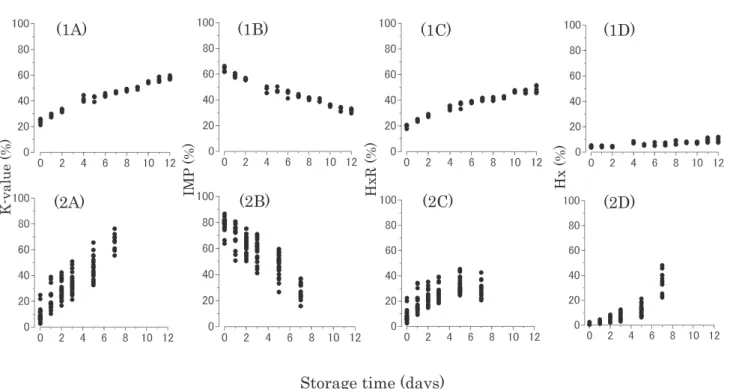
ATP-related compounds in stored pork9) and chicken samples are shown in Figs. 1 (1A – 1C) and Figs. 1 (2A – 2C), respectively. K values and percentages of IMP, HxR and Hx among all ATP-related compounds in stored pork9) and chicken are shown in Figs. 2 (1A – 1D) and Figs. 2 (2A – 2D),
K-valu e( %) Hx (%) (1A) r = - 0.99 (1C) r = 0.82 (2A) r = - 0.99 (1B) r = 0.99 (2B) r = 0.85 (2C) r = 0.87 IMP (%) HxR (%)
Fig. 1 Relationship between K values and percentages of IMP, HxR and Hx among all ATP-related compounds in stored pork and chicken samples. Figures (1A – 1C) and (2A – 2C) show data for pork and chicken samples, respectively. Each dot represents the mean value of two samples from the same piece of meat. 1A – 1C, n=67; 2A – 2C, n=133.
Storage time (days)
K-value (%) Hx (%) (1A) (1C) (2A) (1B) (2B) (2C) IMP (%) HxR (%) (1D) (2D)
Fig. 2 K values and percentages of IMP, HxR and Hx among all ATP-related compounds in stored pork and chicken samples. Figures (1A – 1D) and (2A – 2D) show data for pork and chicken, respectively. Each dot represents the mean value of two samples from the same piece of meat. 1A – 1D, n=67 ; 2A – 2D, n=133.
respectively. Figs. 1 (1A – 1C) and Figs. 2 (1A – 1D) are based on previously reported data.9) In Fig. 1 (1B), a high correlation between K values and HxR as well as IMP (Fig. 1 (1A)) is observed, while a lesser correlation is seen between K values and HxR in the chicken samples containing high K values of more than 50% (Fig. 1 (2B)). On the other hand, a high correlation (0.965) between K values and HxR was also reported in bonito.7) Figure 2 (2C) shows that HxR values began to decrease seven days after the start of preservation, while Hx, which is a product of HxR degradation, suddenly began to increase (Fig. 2 (2D)). The rate of change in K values in chicken was quite rapid compared with that in pork, and decomposition from HxR to Hx started within seven days whereas the amount of HxR in pork continued to increase constantly during storage (Fig. 2 (1C)). In pork and bonito7), those were presumed to be applicable for NIR analysis, HxR amounts increased with storage time. However, the amount of HxR in chicken did not increase in proportion with storage time (Fig. 2 (2C)). These results suggest that if NIR spectra are influenced by HxR, the correlation coefficient of the calibration equation might be low, especially with samples whose K values exceed 50%.
Formulation of a calibration equation using multiple linear regression
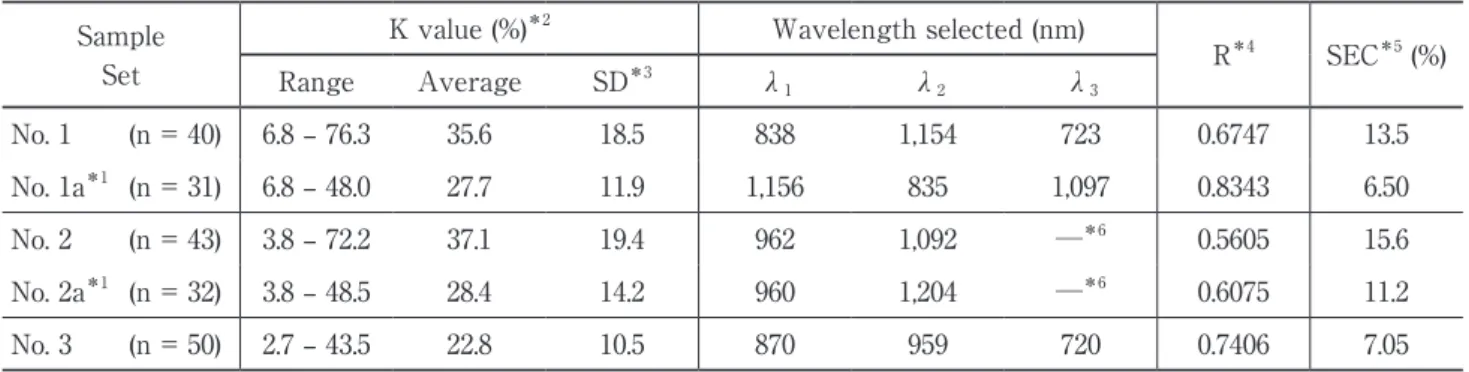
The calibration equation created from multiple linear regression analysis was based on second derivative spectra and K values determined by chemical analysis, and the results are shown in Table 1. For the three wavelengths selected, multiple correlation coefficients of about 0.8 were obtained using K values of less than 50% for calibration. Removing samples in which the K value exceeded 50% increased the multiple correlation coefficient of each sample set as observed in data nos. 1 – 1a and 2 – 2a.
These results suggest the applicability of the calibration equation for determining K values to chicken breast muscle with low K values not exceeding 50%.
Finally, in terms of the property of chicken meat, it can be difficult to maintain the freshness of it with K values of less than 50% because these values stop increasing only at temperatures less than -30°C.1) In a practical context, K values exceeding 50% were found in several samples of commercially available fresh chicken and imported frozen chicken.1, 4) Essentially, it is quite possible for chicken meat to have a significant range of K values and extents of putrefaction. For example, chicken meat with fairly high K values but no extent of putrefaction can be produced. In addition
Table 1. Results of calibration for determining K values (%) Sample
Set
K value (%)*2 Wavelength selected (nm)
R*4 SEC*5 (%) Range Average SD*3 λ 1 λ2 λ3 No. 1 (n = 40) 6.8 – 76.3 35.6 18.5 838 1,154 723 0.6747 13.5 No. 1a*1 (n = 31) 6.8 – 48.0 27.7 11.9 1,156 835 1,097 0.8343 6.50 No. 2 (n = 43) 3.8 – 72.2 37.1 19.4 962 1,092 ─*6 0.5605 15.6 No. 2a*1 (n = 32) 3.8 – 48.5 28.4 14.2 960 1,204 ─*6 0.6075 11.2 No. 3 (n = 50) 2.7 – 43.5 22.8 10.5 870 959 720 0.7406 7.05
*1 No. 1a, 2a: sets from which samples with K values exceeding 50% were eliminated. *2 K value (%): chemically determined values of sample sets.
*3 SD: standard deviation.
*4 R: multiple correlation coefficient. *5 SEC: standard error of calibration.
to examining methods of determining chicken freshness, it is also quite important to determine the relationship between K values and the chicken quality demanded by consumers.
References
1) Kunio Numata, Hiroshi Suzuki and Kohzo Usui, Nippon Shokuhin Kogyo Gakkaishi, 28(10), 542-547 (1981)
2) Tsuneyuki Saito, Ken-ichi Akai and Minoru Matsuyoshi, Bulletin of the Japanese Society of Scientific Fisheries, 24(9), 749-750 (1959) 3) Yoshimi Kitada, Akikazu Hasuike, Michiko
Sasaki, Kaoru Tanigawa, Ryutaro Horiuchi and Hideo Yuba, Nippon Shokuhin Kogyo Gakkaishi, 30(3), 151-154 (1983)
4) Kunio Numata and Hiroshi Suzuki, Bulletin of the Tokyo-to Agricultural Experiment Station, 17, 20-31 (1984)
5) Ryoichi Tanabe, Koichi Motomura, Takakichi Kuriki, Shirou Andou, Toshio Ikeda, Shigeru Otsuka and Hiroyasu Nakai, The Japanese Journal of Zootechnical Science, 61(11), 998-1003 (1990)
6) Haruo Negishi and Sumio Yoshikawa, The Japanese Journal of Zootechnical Science, 65(9), 882-889 (1994)
7) Masahiro Kohashi, Reitou, 70(816), 1127-1132 (1995)
8) Shinji Shimamoto and Kaoru Hasegawa, Bulletin of the Shizuoka Prefectural Fisheries Experiment Station, 38, 43-46 (2003)
9) Tsutomu Satoh, Chinami Nakai, Masahiro Kohashi, Tatsuo Watanabe, Hiroshi Nakayama, Toshihiro Suzuki and Atsushi Horiuchi, The Journal of Senri Kinran University, 11, 113-120 (2014)
〈研究ノート〉
近赤外分光法の利用による鶏肉鮮度評価の試み
The trial for evaluation of chicken freshness using near infrared spectroscopy